


Abstract
Ozone (O3) is a criteria air pollutant with the most frequent incidence of exceeding air quality standards. Inhalation of O3 is known to cause lung inflammation and consequent systemic health effects, including endothelial dysfunction. Epidemiologic data have shown that gestational exposure to air pollutants correlates with complications of pregnancy, including low birth weight, intrauterine growth deficiency, preeclampsia, and premature birth. Mechanisms underlying how air pollution may facilitate or exacerbate gestational complications remain poorly defined. The current study sought to uncover how gestational O3 exposure impacted maternal cardiovascular function, as well as the development of the placenta. Pregnant mice were exposed to 1PPM O3 or a sham filtered air (FA) exposure for 4 h on gestational day (GD) 10.5, and evaluated for cardiac function via echocardiography on GD18.5. Echocardiography revealed a significant reduction in maternal stroke volume and ejection fraction in maternally exposed dams. To examine the impact of maternal O3 exposure on the maternal-fetal interface, placentae were analyzed by single-cell RNA sequencing analysis. Mid-gestational O3 exposure led to significant differential expression of 4021 transcripts compared with controls, and pericytes displayed the greatest transcriptional modulation. Pathway analysis identified extracellular matrix organization to be significantly altered after the exposure, with the greatest modifications in trophoblasts, pericytes, and endothelial cells. This study provides insights into potential molecular processes during pregnancy that may be altered due to the inhalation of environmental toxicants.
Pregnancy drives substantial hemodynamic shifts as increasing nutrient requirements of the growing fetus and placenta demand augmented maternal cardiac function (Savu et al., 2012). Insufficient accommodation of the cardiac and systemic circulatory system may result in pregnancy-associated health complications such as gestational hypertension, preeclampsia, and intrauterine growth deficiency (Kovo et al., 2013). Hypertensive disorders of pregnancy (HDP) affect between 2% and 8% of pregnancies globally, and have been shown to increase the risk for both future pregnancy complications as well as other cardiovascular sequelae (Khan et al., 2006; Sliwa and Böhm, 2014).
Gestational hypertension is associated with chronic placental perfusion insufficiency, ultimately leading to the release of pressors from the placenta that increase maternal vascular resistance (Valensise et al., 2006). Among the various risk factors for HDP, epidemiological associations with early gestational exposure to air pollution have emerged recently, highlighting the global impact of poor air quality. Ozone (O3), particulate matter, and other airborne toxicants have been examined in the context of harmful elements for gestational health (Grippo et al., 2018; Mozzoni et al., 2022). Ground-level O3 is a ubiquitous, gaseous air pollutant forming from the reactions of volatile organic compounds in air pollution. O3 specifically has been reported in several studies to correlate positively with low birth weight (Geer et al., 2012), HDP (Hu et al., 2017), and preterm birth (Rappazzo et al., 2021). Similarly, particulate matter and combustion mixtures such as traffic-related air pollutants have been associated with an increased risk of gestational hypertension (Beverly, 2020; Mobasher et al., 2013; Sears et al., 2018).
The placenta contains a diverse assortment of cell types (Barrozo and Aagaard, 2022) with a high degree of proliferative potential and metabolic demand as trophoblasts differentiate. As maternal spiral arteries are remodeled during pregnancy and the placenta begins to be perfused with maternal blood, placental cellular growth transitions from hypoxic to normoxic conditions (Colson et al., 2021; Zhao et al., 2021). The hypoxic response is implicated in angiogenic stimulation through the HIF-1α/VEGF axis (Tirpe et al., 2019). Cellular signaling between vascular cells, such as pericyte HIF-1-mediated vascular permeability, has been studied in the context of the brain and kidney (Baumann et al., 2022; Pan et al., 2021; Tsao et al., 2021), however, less is known about these types of interactions within the context of the unique vascularization of the placenta. The process of maternal spiral artery remodeling can conceptually be broken down into an initial remodeling phase mediated largely by uterine natural killer cells, and a latter phase that is mediated by extravillous trophoblasts (Sato, 2020). Improper spiral artery remodeling leads to placental insufficiency, which may result in gestational complications such as preeclampsia or intrauterine growth deficiency.
Recent studies in murine models with O3 inhalation have revealed a potential early window of vulnerability to a preeclampsia phenotype, at approximately the time of placentation (Garcia et al., 2021; Miller et al., 2017). In murine models, placentation occurs between gestational day (GD) 6–10, and O3 exposures in rat studies during this window lead to elevated uterine artery resistance and soluble Flt-1 at term, along with reductions in cardiac function and proteomic/phosphoproteomic changes consistent with early cardiomyopathic changes (Garcia et al., 2021). Research with another pulmonary toxicant, multiwalled carbon nanotubes, revealed that pulmonary responses to xenobiotics lead to the shedding of peptide factors into the circulation that have antiangiogenic properties (Aragon et al., 2017; Young et al., 2021). We postulate that exposure to air pollutants, including O3, can slow the development of the early placental vasculature and ultimately promote maternal cardiovascular abnormalities later in gestation. The present study sought to expand upon the current understanding of air pollution-induced placental vascular impairment by deep transcriptional phenotyping of placentae through the use of single-cell RNA sequencing (scRNA-seq) using a mouse model of early gestational exposure to O3. We hypothesized that, at term, transcriptional profiles of placental endothelial and vascular cells would be persistently altered in response to midgestational exposures to O3.
Materials and methods
Animals and exposure paradigm
For echocardiography measurements, male and female C57BL/6J (stock no: 000664, Jackson Laboratory) were mated. For scRNA-seq studies, male and female Tg (TIE2 GFP) 287 Sato/J (stock no: 003658) and FVB/N-Tg (Kdr-mCherry) 1 Medi/2J (stock no: 032145) mice were obtained from Jackson Laboratory. Female TIE2 GFP mice were paired with male Kdr-mCherry mice at a ratio of 2:1, respectively. These models were selected for vascular imaging; however, expression of GFP and mCherry were insufficient in the developing placenta for the present study. Pregnancy was confirmed by the evidence of a vaginal plug and weight gain, and plug-positive females were removed and double-housed in larger breeding cages. Animals were housed in an Association for Assessment and Accreditation of Laboratory Animal Care-approved facility at the University of New Mexico Health Sciences Center. Animals were maintained at constant temperature (20°C–24°C) and relative humidity (30%–60%), and on a 12-h light/dark cycle throughout the study. Animals were provided with standard mouse chow and water ad libitum, except during O3 exposures.
Dams were exposed to either FA (as controls) or 1 ppm O3 for a single 4 h period via whole-body inhalation at GD10.5, based on this window of vulnerability reported previously (Garcia et al., 2021; Miller et al., 2019b). This concentration and dose were chosen based off of previous studies to produce a well-described pulmonary insult. O3 was generated using an OREC silent arc discharge generator (Osmonics, Phoenix, Arizona) as described previously (Tirpe et al., 2019). Water was available for dams during the 4-h exposure, but food was withheld. Mice were exposed in standard shoebox cages without bedding to minimize O3 scavenging. All animal handling and procedures were conducted humanely and approved by the Institutional Animal Care and Use Committee at the University of New Mexico.
Echocardiography
Echocardiographic measurements were performed on dams at GD18.5 under isoflurane in O2 anesthesia (Vevo LAZR, VisualSonics, Toronto, Canada). A 30-MHz linear array transducer was used to record transthoracic 2D M-mode echocardiogram utilizing cardiac (maternal) and abdominal (fetal) settings. Software (Vevo LAB) from the ultrasound instrument was used to measure left ventricular posterior wall thickness, pulse wave measurements, and the internal diameter of the left ventricle in end-diastole and end-systole. Fractional shortening was calculated from these measurements. Measurements for each parameter (thickness of the LVPW, pulse wave measurements, and the internal diameter of the left ventricle in end-diastole and end-systole) were obtained from at least 5 consecutive heartbeats from 3 separate images of the M-Mode cardiac view, taken for each animal and averaged. Fetal cardiac function was determined and averaged from 2 to 3 separate fetuses per dam to give a single fetal readout per dam. Averages for each dam were then combined with those for animals in the same treatment group/time point. Image collection and analysis were conducted without the knowledge of exposure groupings.
Tissue collection
Following exposure, animals were allowed to continue gestation under standard housing conditions until GD18.5. Dams were anesthetized via isoflurane and euthanized by exsanguination. Following exsanguination, placentae were surgically excised, and excess decidual tissue was removed prior to placement in ice-cold PBS similar to reported previously (Marsh and Blelloch, 2020). A total of 7 (mixed male and female) placentae were removed from each dam (n = 3 per exposure condition) and each sample was pooled together for dissociation (6 individual libraries) using a Spleen Dissociation kit for mouse (Miltenyi Biotec: 130-095-926) according to the manufacturer’s protocol.
Single-cell methods: multiple samples, integrated
10× library preparation and sequencing
Cell concentrations and viability were determined using the Cell Countess II FL (ThermoFisher) prior to calculating cell counts and loading the suspension into the Next GEM Chip G and Chromium Controller (10× Genomics) per the manufacturer’s protocol for GEM formation. The 10× Chromium Next GEM 3′ protocol (v3.1) was used to create 3′ libraries for sequencing at the University of Colorado Anschutz Medical Campus Genomics Shared Resource Cancer Center using Illumina NovaSEQ 6000 instruments on S4 Flow cells. Briefly, cells were lysed and barcoded within each GEM prior to first-strand cDNA synthesis. After GEM’s are broken, cells were pooled prior to library completion as described in the manufacturer’s protocol. Library quality was assessed after cDNA synthesis and after completion on the BioAnalyzer using a DNA High Sensitivity Chip (Agilent). Prior to sequencing, Agilent Tape Station 4200 and Invitrogen Qubit 4.0 reagents were used to determine final library concentrations prior to dilution, normalization and pooling at 4 nM. qPCR was used to determine cluster efficiency, before loading libraries into NovaSEQ machines. Libraries were sequenced at an appropriate depth for 20 000 reads per cell (per recommendation from 10× Genomics).
Data analysis
Echocardiographic data were tested for normality using a Shapiro-Wilk test and compared between control and exposed groups using a Student’s t test, with p < .05 considered significant. scRNA-seq sample data were demultiplexed and fastq files were generated using bcl2fastq (v2.20.0.422, Illumina) with parameter “–barcode-mismatches” set to 1. Fastq files were aligned and genes/cells were counted using CellRanger (v3.1.1, 10× Genomics) against the Mus musculus reference genome (mm10).
Seurat (v4.0.2), an R package (v4.1.0), was used for downstream analysis (R Core Team, 2020; Satija et al., 2015; Stuart et al., 2019). Single-Cell Analysis Toolkit for Gene Expression scater (v1.20.1) was used to identify and remove cells that were outliers for counts, features or mitochondrial percent (McCarthy et al., 2017). ScDblFinder (v1.6.0) was used to identify and remove doublet cells (Germain, 2021). Data were transformed using SCTransform (v0.3.2) (Hafemeister and Satija, 2019) as implemented in Seurat. Data from all samples were integrated using Seurat’s standard integration workflow. Principle component (PC) analysis and an elbow plot were used to visualize the variance and select PCs that encompass approximately 80% of the variance prior to unsupervised clustering. Clusters were determined using the FindNeighbors and FindClusters function with default parameters and a sufficiently high-resolution parameter to capture biological variability (Yu et al., 2012). Cell type prediction was performed using singleR (v1.4.0) against a publicly available murine mid-gestational placenta scRNA-seq dataset (Zhou et al., 2021). Differential gene expression determined using the R package MAST (v1.16.0) (McDavid et al., 2020) as implemented in Seurat. Significant genes were defined by average log fold-change ≥0.25, adjusted p-value ≤.05, and expressed in >10% of the cells in the cluster. An additional “biomarker” level of stringency was defined as genes either having an average log fold-change ≥1.0 and in ≥30% of the cells and an adjusted p-value ≤ .01, or genes expressed in ≥90% of the cells in the cluster and ≤30% outside of the cluster. ClusterProfiler (v3.18.0) (Hafemeister and Satija, 2019) was used for pathway analysis. The Seurat wrapper in NicheNetR (v1.0.0) was used to identify differentially expressed ligands and receptors (Browaeys et al., 2020).
Results
Maternal cardiac phenotype
Maternal cardiac function was assessed 8 days after exposure to 1 PPM O3 to evaluate the cardiac function at term of pregnancy. Anesthesia was adjusted to maintain heart rates above 400 bpm, to minimize error due to anesthetic depth; thus, heart rate values were similar between groups by design. Cardiac output was not significantly altered between FA and O3-exposed mice, however, both maternal stroke volume and ejection fraction were significantly decreased in dams exposed to O3 on GD10.5, consistent with similar models in rats (Garcia et al., 2021). Echocardiographic assessment of the fetal heart function was feasible at GD18.5, but revealed no significant difference between control and exposed fetuses in terms of cardiac output, stroke volume, or ejection fraction (Figure 1).
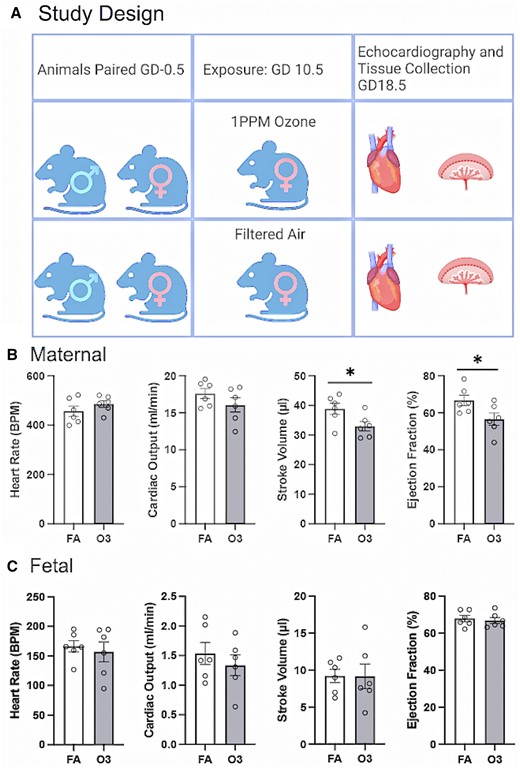
A, Graphical representation of exposure paradigm. Echocardiographic data obtained on gestational day 18.5 in filtered air (FA) or ozone (O3)-exposed dams (Figure made with Biorender). B, Maternal cardiac parameters, collected in a standardized range of heart rates, present with unaltered cardiac output but significant reduction in stroke volume and ejection fraction in dams exposed to 1 ppm O3 on GD10.5. C, Fetal cardiac parameters at GD18.5 show no significant changes after maternal O3 exposure to 1 ppm O3 at GD10.5. Asterisks (*) indicate a significant difference from FA controls (p < .05) by Student’s t test.
Overall placental scRNA-seq clustering
To identify molecular signatures associated with O3 exposure in placental cells, we performed scRNA-seq (n = 3 dams per condition, 42 placentae total, 7 placentae pooled a biological replicate for each dam). The placental scRNA-seq analysis of 46 587 total cells highlighted 17 cellular clusters, which were used for differential gene expression analysis (Figure 2A). Unique cellular clusters identified include T cells, monocytes, macrophages, Hofbauer cells (HBC), fetal mesenchymal (FM) cells, epithelial cells, natural killer cells, pericytes, erythrocytes, endothelial cells as well as a subpopulations of angiogenic endothelial cells, granulocytes, yolksac cells, decidual stromal (DS) cells, basophils, and trophoblasts divided broadly into 2 clusters: Trophoblast1 and Trophoblast2. The Trophoblast2 cluster is largely spongiotrophoblasts, whereas the Trophoblast1 cluster contains multiple types of trophoblasts (extravillous trophoblasts, syncitiotrophoblasts, trophoblast progenitor cells). An overlay of FA control and O3 exposure data (Figure 2B) reveals visually distinct changes in monocyte, HBC, and pericyte concentrations. Differences in cell counts by cluster (Figure 2C) show statistically significant reductions in Trophoblast1 cells and increases in HBC. Relative proportions of cell clusters in FA and O3-exposed mice can be found in Figure 2D.
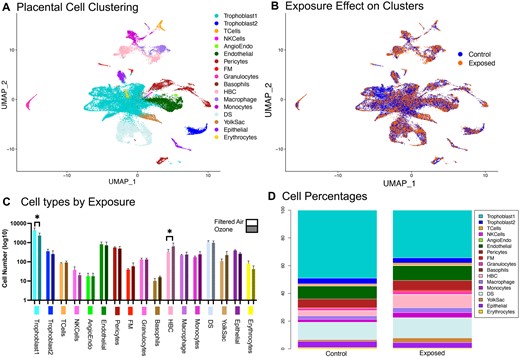
A, Uniform manifold approximation projection (UMAP) of 46 000 mouse placental cells. A total of 17 unique clusters were identified for further analysis. B, UMAP of placental cells divided by exposure to either filtered air or 1PPM O3 on gestational day 10.5. C, Cell counts per cluster comparing exposure conditions. D, Percent of total cells by cluster for each exposure condition. Abbreviations: Angioendo, angiogenic endothelial cells; DS, decidual stromal cells; FM, fetal mesenchymal cells; HBC, Hofbauer cells; NKCells, natural killer cells.
Pseudobulk differentially expressed gene analysis across exposure
Gene expression profiles for cluster calling were adapted for placentae from another published source (Marsh and Blelloch, 2020). Though other human studies have highlighted specific trophoblast interactions specific to preeclampsia (Zhang et al., 2021), our current study focused on vascular interactions specifically, which led us to cluster all trophoblast cells for our analysis. Specific trophoblast sub-clustering was performed for this dataset (Supplementary Figure 2), however the current analysis focuses on the larger trophoblast cluster (Trophoblast1) in order to preserve potential interactions potentially lost with specific subdivisions.
Differential gene analysis of all cells in the placental tissue based on treatment highlighted 4021 genes significantly altered (inclusive of all cell types) 8 days post-O3 inhalation, when compared with the FA control group. A total of 2486 of these genes were unique, a pairwise analysis of differentially expressed gene (DEG) overlap between cellular clusters is available in Supplementary Figure 4 (Table 1). These genes were compared against human homolog genes identified in a recent study of human preeclampsia (Leavey et al., 2016). This comparison outlined 565 homologous DEGs between this murine model of environmental exposure and human pathophysiology. GO Biological Process pathway analysis of these genes (Figs. 3A and 3B) graphed using EnrichR pathway analysis utilizing the GO Biological Processes database (Kuleshov et al., 2016; Xie et al., 2021) software identified collagen fibril organization and extracellular matrix (ECM) organization as the biological pathways most significantly altered due to the exposure. Degradation of the ECM is a crucial element for angiogenesis, placental growth, and uterine artery remodeling that is essential for normal placentation (Lin et al., 2020; Mongiat et al., 2016). When analyzed individually, the DEGs from the pericyte cluster (Figs. 4A and 4B) accounted largely for the perturbations in the ECM outlined in the total pathway analysis. The endothelial cell cluster showed significant alterations in receptor binding pathways (Figs. 4C and 4D).
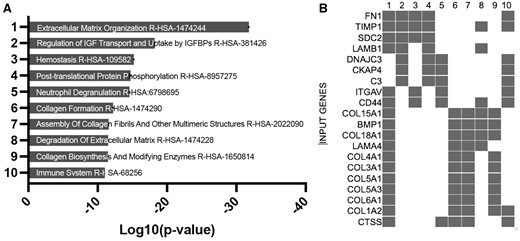
EnrichR gene ontology of DEGs pathway analysis using GO biological process 2021 dataset. Bargraph (A) and clustergram (B) of the 565 significantly DE genes across all cells based on exposure to 03 relative to controls for the entire combined dataset overlapping with DEGs identified in the Leavey et al. (2016) study of human preeclampsia.
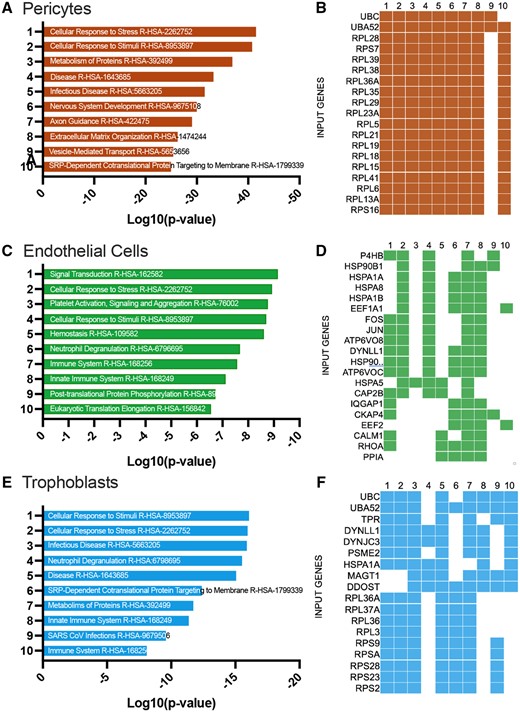
EnrichR gene ontology of DEGs pathway analysis using GO biological process 2021 dataset. Bargraph (A) and clustergram (B) of 1936 DEGs for the pericyte cluster response to O3 in the dataset highlighting the top 10 pathway analysis hits. A total of 331 DEGs for endothelial (C and D) and 641 DEGs for Trophoblast1 cell (E and F)-specific ontological pathway analysis.
Overlap DEGs for the top 10 significant pathways identified in the Leavey et al. (2016) study of human preeclampsia.
| Table of top 10 significant p-values and q-values for Reactome 2022 | |||
|---|---|---|---|
| Term | p-Value | q-Value | overlap_genes |
| Extracellular matrix organization R-HSA-1474244 | 1.55E-32 | 1.58E-29 | COL18A1, COL16A1, ICAM2, PLOD2, CTSS, ICAM1, ADAMTS5, SH3PXD2A, ADAMTS1, CTSK, TIMP2, CAPN2, ITGAV, TIMP1, MMP2, BGN, PCOLCE, HSPG2, DCN, MMP11, VCAN, LOX, COL4A1, COL6A2, COL6A1, ADAM9, COL6A3, ADAM8, ITGA5, CD44, COL15A1, SDC4, SDC2, LAMA4, FBLN1, NID1, THBS1, FBLN5, TTR, JAM3, TGFB2, VCAM1, LUM, FN1, LAMB1, COL1A1, MFAP5, MFAP4, COL3A1, BMP2, COL1A2, BMP1, COL5A1, P4HA1, P4HA2, COL5A3, FMOD, FBN1 |
| Regulation of IGF transport and uptake by IGFBPs R-HSA-381426 | 6.28E-19 | 3.20E-16 | APP, KLK1, SDC2, PRSS23, HSP90B1, C3, CST3, LGALS1, STC2, PENK, IGFBP7, APOE, IGFBP6, TIMP1, IGFBP4, MMP2, FN1, APOA1, LAMB1, IGF1, PDIA6, CKAP4, DNAJC3, VCAN, SPARCL1, NUCB1, MFGE8, FBN1, PAPPA2 |
| Hemostasis R-HSA-109582 | 6.34E-16 | 2.15E-13 | LGALS3BP, APP, ECM1, PROS1, F13A1, PLAT, ABHD12, THBD, ISLR, GNGT2, TMSB4X, ITGAV, TIMP1, SLC16A3, SRGN, FCER1G, APOA1, F3, RHOB, PROCR, SLC7A8, KIF2A, PRKAR1A, SERPING1, CD48, ITGA5, CD44, SDC4, SDC2, GATA6, SRI, PIK3R1, TFPI, THBS1, CLEC3B, TTR, RAP1A, EPCAM, PDPN, FLNA, JAM3, TGFB2, RARRES2, CAV1, FN1, IGF1, ATP2B1, GNG11, P2RX4, MAFF, CAPZA2, CD9, ESAM, TEK, CALM1, RAB5A |
| Post-translational protein phosphorylation R-HSA-8957275 | 1.85E-15 | 4.70E-13 | APP, IGFBP4, SDC2, FN1, APOA1, LAMB1, PDIA6, PRSS23, CKAP4, HSP90B1, C3, DNAJC3, CST3, VCAN, LGALS1, STC2, PENK, SPARCL1, NUCB1, IGFBP7, APOE, TIMP1, MFGE8, FBN1 |
| Neutrophil degranulation R-HSA-6798695 | 2.59E-15 | 5.27E-13 | HEXB, CTSZ, CXCL1, CTSS, GLIPR1, FTH1, C3AR1, TIMP2, COTL1, CTSH, ITGAV, B2M, CTSC, CD53, HSP90AA1, EGFL7, FCER1G, CD93, CD300A, CYBB, CKAP4, DNAJC3, CLEC4D, PKM, SLPI, ADAM8, S100A8, CD44, TLR2, GRN, ROCK1, FGL2, C5AR1, C3, PLAC8, CST3, PRDX4, RAP1A, TTR, CREG1, NCKAP1L, IDH1, GGH, TUBB4B, BST2, ERP44, RCAN1, DLC1, HSPA1A |
| Collagen formation R-HSA-1474290 | 6.08E-13 | 1.03E-10 | COL18A1, COL15A1, COL16A1, LAMA4, PLOD2, PCOLCE, CTSS, COL1A1, COL3A1, BMP1, COL1A2, LOX, COL5A1, P4HA1, COL4A1, P4HA2, COL6A2, COL5A3, COL6A1, COL6A3 |
| Assembly of collagen fibrils and other multimeric structures R-HSA-2022090 | 2.64E-12 | 3.77E-10 | COL18A1, COL15A1, LAMA4, PCOLCE, CTSS, COL1A1, COL3A1, BMP1, COL1A2, LOX, COL5A1, COL4A1, COL6A2, COL5A3, COL6A1, COL6A3 |
| Degradation of extracellular matrix R-HSA-1474228 | 3.09E-12 | 3.77E-10 | COL18A1, COL15A1, COL16A1, MMP2, LAMA4, LAMB1, NID1, HSPG2, CTSS, DCN, ADAMTS5, MMP11, BMP1, ADAMTS1, CTSK, CAPN2, TIMP2, ADAM9, ADAM8, TIMP1, CD44 |
| Collagen biosynthesis and modifying enzymes R-HSA-1650814 | 3.33E-12 | 3.77E-10 | COL18A1, COL15A1, COL16A1, PLOD2, PCOLCE, COL1A1, COL3A1, BMP1, COL1A2, COL5A1, P4HA1, COL4A1, P4HA2, COL6A2, COL5A3, COL6A1, COL6A3 |
| Immune system R-HSA-168256 | 9.12E-12 | 9.28E-10 | APP, IFITM2, PROS1, ICAM2, F13A1, ICAM1, ACTG1, FTH1, C3AR1, COTL1, B2M, RSAD2, CD93, CD300A, CYBB, LIFR, CLEC4D, IFI27, SLPI, SERPING1, TXNIP, ADAM8, IL6ST, SQSTM1, S100A8, CSF1R, CFH, EBI3, C5AR1, TWIST1, PIK3R1, HSP90B1, C3, PLAC8, SOCS3, PRDX4, RAP1A, HMOX1, NDN, NCKAP1L, VASP, EGR1, JUN, VCAM1, IDH1, FN1, GGH, MSN, ISG15, BST2, RCAN1, COL1A2, CALM1, LGMN, HEXB, CTSZ, PTPN22, CXCL1, WASL, CXCL2, CTSS, GHR, GLIPR1, CTSK, TIMP2, CTSH, ITGAV, TIMP1, CTSC, JAK1, CD53, HSP90AA1, EGFL7, FCER1G, MMP2, FOS, CKAP4, DNAJC3, ZEB1, PKM, SLC7A8, KIF2A, IRF7, IRF8, RHOU, CD44, TLR2, COLEC12, GRN, ROCK1, CEBPD, FGL2, CST3, TTR, CREG1, CCL3, FLNA, TUBB4B, ERP44, TEC, … |
Integrated assessment of cellular changes
In an effort to further understand the gestational effects of maternal O3 exposure was having on the placenta, this study utilized NicheNet ligand-target modeling analysis (Browaeys et al., 2020) to highlight cellular interactions of the near-term placentae (Figure 5). Ligand and receptor expression within the placentae exposed to O3 was compared with the FA controls. The pericyte cluster appeared to have a modest upregulation of several receptors, including Mylk, Sdc2, Ptgdr2, and Tgfbr3. Endothelial cell signaling through ligands such as Vegfc, Pecam, and Cxcl2 were identified, potentially accounting for the significant receptor signaling pathways identified previously (Figure 4C).
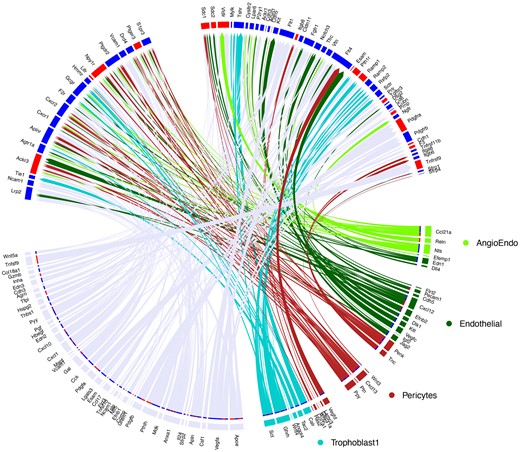
Circos plot of ligand/receptor interactions of various cell types within the placenta. Specific interactions of angiogenic endothelial, endothelial, pericyte, and trophoblast cell ligands are highlighted in respective colors, and shared ligand/receptor interactions are highlighted in grey (lower). Receptors from the Trophoblast1 cluster (upper) show upregulated (red) or downregulated (blue) expression of the receptors within this cellular cluster following O3 exposure as compared with the filtered air control.
Discussion
The effects of air pollution exposure during pregnancy on fetal and maternal health remain poorly defined mechanistically. The placenta is a transient organ in the body that grows and develops rapidly, and is home to abundant progenitor cell populations that give rise to greatly diverse trophoblast populations (Marsh and Blelloch, 2020; Mohammed et al., 2017; Natale et al., 2017); disruption to this rapid growth and cellular differentiation can have deleterious impacts to both the fetus and mother. The present report provides further evidence for adverse maternal cardiac effects at term following a mid-gestational O3 exposure in a mouse model. ScRNA-seq analysis revealed robust transcriptional alterations to vascular cells, including pericytes and endothelial cells, detectable up to 8 days after maternal exposure. These altered transcriptional elements are ontologically coherent with vascular remodeling and HDP.
Mid-gestational O3 exposure was sufficient to decrease maternal stroke volume and ejection fraction at term. Single exposures to O3 in nonpregnant murine models are known to induce a transient pulmonary inflammation with systemic endothelial dysfunction that generally lasts only approximately 24–48 h (Gowdy et al., 2021; Ishii et al., 1998; Marzec and Nadadur, 2022), so the evolution of a cardiac phenotype 8 days post-exposure suggests a more complex interaction with the growing placenta and/or fetus. Notably in rats, the mid-gestational exposure promoted similar decrements in stroke volume, but exposure to O3 within 24 h of term led to negligible impacts on cardiac function (Garcia et al., 2021). Based on previous research with other pollutants (Aragon et al., 2017; Young et al., 2021), we postulate that O3-induced, lung-derived factors [especially fragmented peptides from lung matrix metalloproteinase (MMP) activity (Young et al., 2021)] shed into the circulation and have general inhibitory effects on angiogenesis. During early critical windows of placentation and spiral artery formation (ie, around GD10–12), such exposures may slow the normal development of the placenta, promoting a latent placental insufficiency and the risk of HDP in late gestation as fetal demands increase.
Similar to humans, mice undergo changes in cardiac performance across pregnancy, with increases in stroke volume and overall cardiac output increasing throughout pregnancy (Kulandavelu et al., 2006). Hypertensive syndromes can occur in 5%–10% of human pregnancies, with manifestations ranging from mild gestations hypertension (arterial pressures around 140/90 mmHg) to preeclampsia, where blood pressure increases and proteinuria become life threatening. Stroke volume decreases have been shown in human studies of preeclampsia (Gibbone et al., 2022), and preeclampsia increases risks of cardiac impairment and stage B heart failure (Melchiorre and Thilaganathan, 2011). The present study and previous work (Garcia et al., 2021) highlight function maternal cardiac functional effects, but blood pressure and proteinuria have not yet been assessed. However, the impact of the mid-gestational O3 exposure in rodents collectively appears mild and not fulminant preeclampsia, but more comprehensive characterization is needed. The maternal cardiac consequences of air pollution exposure on improper placental vascularization, particularly the effects of placental-derived secretory systemic factors on cardiac function require further investigation. Notably, the O3 exposure did not affect fetal cardiac function, at least at term when we assessed via ultrasonography. We thus conclude that O3 exposure promotes a phenotype of placental insufficiency, based on the present findings of placental ECM organization and similar results in related studies (Garcia et al., 2021; Miller et al., 2017). The use of animal models to study gestational disorders such as preeclampsia have been instrumental in uncovering the pathophysiology of these disease states; however, despite structural similarities in placental morphology, the overarching differences such as labyrinth organization and overall gestational time may complicate our understanding of molecular mechanisms when extrapolating murine system effects to human disease (Turco and Moffett, 2019).
Data presented here provide evidence for remodeling of the placental ECM following maternal exposure to O3. ScRNA-seq specifically identified altered expression of 15 different collagens and precollagens to be affected by maternal O3 exposure, across the Pericyte, Endothelial, Trophoblast1, Decidial Stromal, and HBC clusters. Some of the differentially expressed collagens include Col1a1, Col6a3, Col14a1, P4ha2, and Pcolce. A list of all affected collagens can be found in Supplementary Table 3. Targeted measurement of placental RNA transcripts in rats previously found reductions in Mmp10 and increases in Col1a1, consistent with disruptions in the ECM (Garcia et al., 2021). ECM composition is not only crucial for angiogenesis and vascular development, but has also been found to sequester sFlt1 in murine pregnancies (Moore et al., 2020). Bioactive molecules such as soluble fms-like tyrosine kinase 1 (sFlt1) in serum contribute to endothelial dysfunction and improper placental vascularization (Maynard et al., 2003; Vogtmann et al., 2019; Yonekura Collier et al., 2019). Flt1 was significantly downregulated in the Trophoblast1 cluster in the O3-exposed animals. O3 inhalation during early gestation in rats increased sFlt1 levels, impaired maternal cardiac function, and elicited a “myopathy-like” proteomic phenotype (Garcia et al., 2021). Alteration of collagen and peptidase expression in the placenta may be a substrate for increased cleavage and release of sFlt-1.
Inhaled O3 activates MMPs in the lung (Yoon et al., 2007), leading to systemic changes in vascular tone. The genes found to be differentially expressed in the maternal O3-exposed placentae included MMPs 2, 11, 14, 16, and 23 across the Pericyte, DS, and HBC clusters. MMP2 has been studied in terms of increased vasoconstriction, whereas MMP14 has been shown to be elevated in cases of severe human preeclampsia causing the release of soluble endoglin. MMPs have integral roles in placental development, with numerous studies linking altered MMP levels to preeclampsia and other HDP (Chen and Khalil, 2017; Pang and Xing, 2003; Sundrani et al., 2017; Zhang et al., 2018). Alterations in placental MMP expression may be important in driving the formation and organization of collagens and other accessory proteins integral to ECM organization.
Of the 4021 DEGs identified in this analysis, 1936 of these genes were found in the pericyte cluster. Gene ontology analysis of these DEGs revealed similar ECM-associated pathways to the total ontology findings (Figure 4), suggesting the pericyte cluster may be driving total transcriptional changes in the dataset. Pericytes serve functional roles for vessel function and homeostasis, and are critically important for angiogenesis (Dessalles et al., 2021; Teichert et al., 2017). Less is known about pericyte function within the context of the placenta, where pericytes are derived from mesenchymal stem cells (Wang and Zhao, 2010). Studies have shown reduced fetoplacental pericyte coverage in pregnancies complicated by type 1 diabetes mellitus. Pericyte coverage and angiogenesis are also linked to the expression of the matricellular protein Olfml3 (Imhof et al., 2020; Miljkovic-Licina et al., 2012), which was significantly upregulated in this study by pericyte and DS cells in O3-exposed dams. Transcriptional studies of preeclampsia (Ren et al., 2021) have shown increases in Olfml3, a secreted scaffolding protein that aids in pericyte recruitment on developing vessels, to be increased in human preeclamptic placentae compared with normal controls. It has recently been reported that pericytes within the placental villi preferentially cover endothelial junctions furthest away from the trophoblast (Harris et al., 2021). Our data show that placental pericytes showed increased expression of Serfinf1, a potent antiangiogenic factor that has been implicated in development of syncytiotrophoblasts from cytotrophoblasts (Hettfleisch et al., 2021). Serfinf1 has also been highlighted in transcriptional studies of preeclampsia. The contribution of pericytes toward spiral artery remodeling and placental vascular deficits during pregnancy are poorly defined and present a unique potential mechanism for the development of gestational complications. This study provides data for cellularly heterogeneous transcriptional responses of placental cells to maternal O3 exposure during gestation.
The endothelial cell cluster accounted for 331 of the 4021 DEGs reported in this study. The maternal O3 exposure caused an increase in transcriptional levels of neuropilin 1 (Nrp1) a coreceptor that forms a trimeric complex with Vegf-A and VegfR-2 to affect angiogenic signaling. Neuropilin levels have been observed to be decreased in the placentae of women with preeclampsia, and reduction of Nrp1 has been shown to contribute to trophoblast developmental dysfunction (Naidoo et al., 2022; Xu et al., 2016; Yang et al., 2021). The endothelial cluster also showed altered levels of apelin receptor, whose signaling controls vasodilatory functions and has recently been shown to be associated with preeclampsia or preeclamptic like symptoms in humans and mice (Eberlé et al., 2019; Ho et al., 2017; Liu et al., 2019). Finally, the expression of Foxf1 and Sox17 were both altered, both proteins playing roles in placental vascular development (Igarashi et al., 2018; Ren et al., 2014) (Figs. 4C and 4D). Endothelial cells are paramount to vascular formation, and through their actions during spiral artery remodeling may influence nutritional availability to the developing fetus where improper function may contribute to placental and fetomaternal pathology.
This study used a single, mid-gestation exposure paradigm—targeting the initial period of placentation—and assessed placental transcription at near-term. Epidemiological data highlight the first trimester of pregnancy in humans to be a particularly vulnerable stage for air pollution-induced inflammatory damage (Grippo et al., 2018; Hettfleisch et al., 2021; Miller et al., 2019a). The implantation stage has been shown to be a vulnerable period of gestation for fetal and maternal health, with multiple studies in rats highlighting O3-induced gestational deficits (Garcia et al., 2021; Wiegman et al., 2020). The mid-gestational model was chosen in an effort to mitigate the chances of the animals reabsorbing the early embryos due to the effects of the exposure, or the stress of the procedure itself. Maternal weight and litter size was not significantly different between groups (data not shown). The hybrid mouse strain utilized in the single-cell experiments was chosen to elucidate differences from maternally- and fetally derived endothelial cells. Unfortunately, poor reporter expression in the placental tissue made it impossible to stratify the endothelial cells in this manner. Future studies may benefit from comparative assessments of different exposure times along gestation, as well as the assessment of acute effects directly following the exposure.
Finally, air pollution is a complex mixture of O3, volatile organic compounds, particulate matter, and other gases with high regiospecificity, making it impossible to perfectly model the spectrum of real-world conditions. O3 as a pulmonary oxidant gas has been studied extensively for its localized effects within the lung, as well as systemic consequences throughout the body (Bălă et al., 2021; Manisalidis et al., 2020; Sokolowska et al., 2019; Wiegman et al., 2020). Notably, due to its high reactivity, O3 is unable to penetrate further than 0.1 µm into the lung epithelial lining fluid (Postlethwait et al., 1998) and would not be able to transit to directly impact the placenta. Particulate matter may have limited systemic uptake that would bring into question direct versus indirect effects. The value of O3 as a model is that it highlights the lung-specific responses as key to downstream placental impacts (as opposed to a direct impact of a toxicant on the placental cells). Our study utilized O3 as a pulmonary toxicant in an effort to understand the interplay of the lung-placental axis of gestational health; future studies may benefit from utilizing particulate matter or mixed air pollution models, for example, engine emissions or wildfire smoke, to further our understanding and provide better risk assessment for pregnant mothers.
In summary, O3 exposure at GD10.5 led to persistent transcriptional alterations in placentae at GD18.5 in parallel with maternal cardiac functional deficits. These murine findings are consistent with earlier results in rat models and further identify placental pericytes and endothelial cells as principal targets and/or drivers. Inhalation of particulates and gases leads to shedding of peptides and other factors from the impacted lung into the circulation, that in turn target the systemic vascular endothelium through numerous receptor-ligand interactions (Aragon et al., 2016, 2017; Mostovenko et al., 2019). In the case of the growing placenta, this interaction with peptides at the time of inflammation may alter growth and result in a progressive impairment in development facilitating later gestational pathologies. The present study adds to our understanding of how inhaled pollutants can disrupt normal placental development and promote adverse pregnancy outcomes such as gestational hypertension.
Supplementary data
Supplementary data are available at Toxicological Sciences online.
Declaration of conflicting interests
The authors declared no potential conflicts of interest with respect to the research, authorship, and/or publication of this article.
Funding
National Institute of Child Health & Human Development (F31 HD107945); National Institute of Environmental Health Sciences (R01 ES014639); the National Institute for General Medical Sciences (P20 GM130422); the UNM Comprehensive Cancer Center Support Grant (P30 CA118100); the Analytical and Translational Genomics Shared Resource, which receives additional support for the State of New Mexico, and the University of Colorado Anschutz Medical Campus Genomics Shared Resource Cancer Center Support Grant (P30 CA046934).

Comments