


Abstract
Neonicotinoid insecticides are synthetic nicotine derivatives that have high affinity for invertebrate nicotine receptors and low affinity for mammalian nicotine receptors. However, imidacloprid (IMI), the most commonly used neonicotinoid, can be bioactivated by the liver in mammals to desnitro-imidacloprid, an intermediate metabolite that effectively binds and activates mammalian receptors. However, it is not known if other tissues such as the ovaries can metabolize IMI. Thus, the present study tested the hypothesis that ovarian antral follicles metabolize and bioactivate IMI. Antral follicles were dissected from the ovaries of CD-1 mice and cultured in media containing dimethyl sulfoxide or IMI (0.2–200 µg/ml) for 48 and 96 h. Media were subjected to liquid chromatography-mass spectrometry for detection of phase I IMI metabolites. Follicles from the cultures were used for gene expression analysis of metabolic enzymes associated with IMI metabolism. All IMI metabolites were detected at 48 and 96 h. Oxidized IMI intermediates were detected in media from cultured follicles, but not environmental controls. Reduced IMI intermediates were detected in media from cultured follicles and the environmental controls. At 48 h, IMI did not affect expression of any metabolic enzymes compared with control. At 96 h, IMI induced Cyp2e1 and Cyp4f18 compared with control. These data indicate that mouse ovarian follicles metabolize IMI and that IMI induces ovarian Cyp expression over time.
Mammals are primarily exposed to neonicotinoids through consumption of contaminated food and drinking water and contact with companion animals (Craig et al., 2005; Ospina et al., 2019). The popularity of neonicotinoids is partially due to their structures, which make them highly insect selective and thus, considered safer for mammals than other pesticides. Structurally, neonicotinoids are nicotine derivatives synthesized with high affinity for invertebrate nicotinic acetylcholine receptors (nAChR) and low affinity for mammalian nAChRs (Tomizawa and Casida, 1999). However, structural changes during metabolism can produce metabolites that interact with mammalian receptors and thus, are no longer insect selective. Imidacloprid (IMI), the most popular neonicotinoid, is bioactivated in mammals to desnitro-imidacloprid (DNI), an intermediate metabolite that effectively binds and activates mammalian nAChRs. In fact, DNI has been shown to be over 300 times more potent than IMI at the mammalian nAChR (Lee Chao and Casida, 1997; Tomizawa and Casida, 2003, 2005).
IMI is readily absorbed in the gastrointestinal tract of mammals. Once absorbed, it travels to the liver where it undergoes phase I and phase II biotransformation (Brunet et al., 2004). In the liver, IMI is subject to oxidation by cytochrome p450 monooxygenases (CYPs) as well as reduction by CYPs and aldehyde oxidases (AOXs). The specific enzymes involved in phase I biotransformation of IMI have been identified in vitro using human liver microsomes. IMI is oxidized by CYP2A6, CYP2C9, CYP2C19, and CYP3A4 and reduced by AOX, CYP1A2, CYP2B6, CYP2D6, CYP2E1, and CYP3A4 (Table 1) (Dick et al., 2005; Schulz-Jander and Casida, 2002). IMI oxidation yields 4-OH-imidacloprid, 5-OH-imidacloprid, and imidacloprid-olefin. IMI reduction yields DNI, imidacloprid-urea, aminoguanidine-imidacloprid, and nitrosoguanidine-imidacloprid (Casida, 2011). These metabolites are further modified to the terminal metabolites 6-chloronicotinic acid (6CNA) and 6-hydoxynicotinic acid (6HNA), which are subject to phase 2 biotransformation in preparation for excretion through urine and feces (Casida, 2011) (Figure 1).
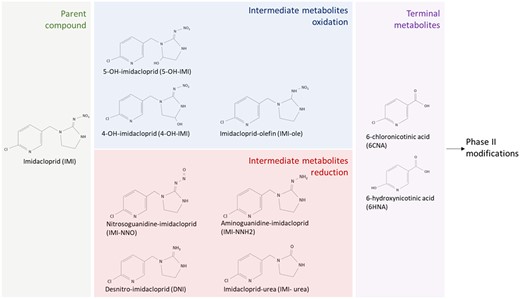
Schematic of imidacloprid and phase I imidacloprid metabolites quantified in this study. Formation of intermediate metabolites is categorized based on the oxidation or reduction of imidacloprid. Terminal metabolites are formed through both oxidation and reduction pathways.
Human and mouse orthologs of enzymes associated with IMI metabolism
| Human Ortholog | Mouse Ortholog | |
|---|---|---|
| Oxidation | CYP2A6 | CYP2A5 |
| CYP2C9 | CYP2C29 | |
| CYP2C19 | CYP2C29 | |
| CYP3A4 | CYP3A11 | |
| CYP4F3 | CYP4F18 | |
| Reduction | AOX | AOX1 |
| — | AOX2 | |
| — | AOX3 | |
| — | AOX4 | |
| CYP1A2 | CYP1A2 | |
| CYP2B6 | CYP2B10 | |
| CYP2D6 | CYP2D22 | |
| CYP2E1 | CYP2E1 |
In laboratory animal experiments, IMI and its metabolites have been detected in various nontarget tissues following acute and chronic IMI exposure, suggesting that IMI is readily distributed in mammals prior to clearance (Kapoor et al., 2014; Nimako et al., 2021). Tissue disposition experiments conducted in Wistar rats quantified IMI, 6CNA, and 6HNA in the brain, blood, urine, liver, kidney, and ovaries after a single oral administration of IMI (20 mg/kg) (Kapoor et al., 2014). In all tissues, the compounds were detected as soon as 6 h postdosing and reached peak concentrations at 12 h postdosing. Interestingly, the proportion of metabolites to IMI was different for the ovaries compared with the other tissues. Although the total concentrations of IMI, 6CNA, and 6HNA were lowest in the ovaries, the ovaries were the only organs where 6HNA was present at higher concentrations than IMI and 6CNA (Kapoor et al., 2014). The metabolite profile of IMI in the ovaries suggests that the ovary may be capable of preferentially metabolizing IMI into 6HNA. Previously, we have shown that IMI and the bioactive metabolite DNI have different effects on antral follicle growth, morphology, and hormone synthesis in vitro (Mourikes et al., 2023). Notably, DNI, but not IMI, inhibited follicle growth and caused follicles to rupture compared with control (Mourikes et al., 2023). The ability of the ovary to breakdown IMI can direct the toxicological consequences of ovarian exposure to IMI, especially if the ovaries can bioactivate IMI to DNI. Thus, the objective of this study was to test the hypothesis that ovarian antral follicles metabolize and bioactivate IMI. To test this hypothesis, we cultured antral follicles isolated from mouse ovaries and directly exposed them to IMI to assess their metabolic potential in the absence of the liver. We quantified intermediate and terminal phase I metabolites as well as gene expression of the murine orthologs to AOXs and CYPs associated with IMI metabolism (Table 1).
Materials and methods
Chemicals
The chemicals used in this study were dimethyl sulfoxide (DMSO) and IMI which were purchased from Sigma-Aldrich (St Louis, Missouri). Stock solutions of IMI were prepared in DMSO and treatment solutions of IMI were prepared by diluting the stocks in DMSO such that equal volumes of each treatment (0.75 µl) could be added per milliliter of culture media. Treatment solutions (0.267, 2.67, 26.7, and 267 µg/ml) were aliquoted and stored at −80°C. On the first day of each culture, aliquots were thawed in a 37°C bead bath and added to supplemented culture media for final working concentrations of 0.2, 2, 20, and 200 µg/ml. We found that changes in the ambient temperature affected the solubility of the highest concentration of IMI so all treated media were sonicated in a solid state/ultrasonic water bath (model FS-14, Fisher Scientific) for 30 min or until the IMI was completely dissolved in media. The selected doses were based on human relevance and our previous study (Mourikes et al., 2023; Ospina et al., 2019). Importantly, we opted to use a wide range of doses to identify dose-response relationships at both timepoints.
IMI and metabolites were quantified using mass spectrometry in the culture media. 4-OH-imidalcoprid and 5-OH-imidacloprid were purchased from Cambridge Isotope Laboratories (Tewksbury, Massachusetts); imidacloprid-urea was purchased from Toronto Research Chemicals (North York, ON, Canada); and DNI, imidacloprid-olefin, 6-hydroxynicotinic acid, and 6-chloronicotinic acid were purchased from Sigma-Aldrich.
Animals
CD-1 mice of reproductive age (postnatal day [PND] 32–42) were purchased from Charles River Laboratories (Wilmington, Massachusetts). The mice were housed in the animal facility located at the University of Illinois College of Veterinary Medicine, where they were given a 1- to 2-week acclimation period prior to use. The mice were kept under 12-h light-dark cycles at 22±1°C and were provided food and water ad libitum. All procedures involving animal care, euthanasia, and tissue collection were approved by the Institutional Animal Use and Care Committee at the University of Illinois Urbana-Champaign.
Antral follicle culture
Antral follicles (220–400 µM) were manually isolated from the ovaries of CD-1 mice (PND 32-42) using watchmaker’s forceps under a dissecting microscope. Each follicle was placed in a single well of a 96-well plate containing 150 µl of supplemented media containing either vehicle control (DMSO) or IMI (0.2, 2, 20, and 200 µg/ml). The supplemented media contained α-MEM (Gibco) with 1% ITS (10 ng/ml insulin, 5.5 ng/ml transferrin, 5 ng/ml selenium, Sigma-Aldrich), 100 U/ml penicillin (Sigma-Aldrich), 100 mg/ml streptomycin (Sigma-Aldrich), 5 IU/ml recombinant follicle-stimulating hormone (Dr A.F. Parlow, National Hormone and Peptide Program, Harbor-UCLA Medical Center, Torrance, California), and 5% fetal bovine serum (Atlanta Biologicals, Lawrenceville, Georgia). Follicles were cultured for 48 or 96 h in a 37°C incubator supplying 5% CO2. Each culture was repeated 5–7 times, with 8–12 follicles per treatment group per culture. For each timepoint, one experiment included environmental controls (media that were cultured in the absence of antral follicles) and used to determine how much IMI was broken down in the environment. This was done to ensure that the metabolites detected in the culture media represent antral follicle metabolism and not environmental breakdown of IMI. At the end of the culture period, follicles were collected for gene expression analyses and media were collected for metabolite quantification via liquid chromatography-mass spectrometry (LC-MS). The follicles from each treatment group were collected in 1.5-ml Eppendorf tubes, snap frozen in liquid nitrogen, and stored at −80°C. The media were removed from the plate and stored in 2-ml Eppendorf tubes at −80°C.
Liquid chromatography-mass spectrometry
Media samples were analyzed for IMI and IMI metabolites using LC-MS by the Carver Metabolomics Core Facility of the Roy J. Carver Biotechnology Center, University of Illinois Urbana-Champaign (Supplementary Table 1). Using an Agilent 1260 Infinity LC system (Agilent Technologies, Santa Clara, California), metabolites were separated using a Phenomenex Kinetex PS C18 100A (2.6 µm, 100 × 4.6 mm) column (Phenomenex, Torrance, California) via a gradient method consisting of mobile phase A: H2O+0.1% formic acid and mobile phase B: acetonitrile +0.1% formic acid. The gradient was 0–2 min = 90% A; 8–12.5 min = 0% A; 12.6–18 min = 90% A. A Sciex 6500+ triple quadrupole MS (Sciex, Framingham, Massachusetts) operating in negative ionization mode used multiple reaction monitoring to screen for IMI, DNI, 5-hydroxy-imidacloprid, 4-hydroxy-imidacloprid, 6-hydroxynicotinic acid, 6-chloronicotinic acid, imidacloprid-olefin, imidacloprid-urea, aminoguanidine, and 6-chloronicotinic-gly. Metabolites were quantified with Sciex Analyst software using 5- to 8-point calibration curves adjusted for labeled internal standards (imidacloprid-d4 and 13C6-6-chloronicotinic acid).
Gene expression analysis
Expression of relevant genes was quantified in the antral follicles that were snap frozen at the end of each culture period (48 and 96 h). Total RNA was isolated from the antral follicles using the RNeasy Micro Kit (Qiagen Inc, Valencia, California) according to the manufacturer’s protocol. RNA was eluted in RNase-free water and the concentration was determined using a NanoDrop (Nanodrop Technologies, Inc, Wilmington, Delaware). Total RNA (300 ng) was reverse transcribed to complementary cDNA using the iScript RT kit (Bio-Rad Laboratories, Inc, Hercules, California) according to the manufacturer’s protocol. Quantitative polymerase chain reaction (qPCR) analysis was done using cDNA from 1.67 ng total RNA, 0.75 pmol/µl of each forward and reverse primers, and 1× SsoFastEvaGreen dye (Bio-Rad Laboratories) in 10 µl reaction volumes. Gene expression was quantified using the CFX96 Real-Time Detection System (Bio-Rad Laboratories) and CFX Manager Software. The qPCR protocol began with incubation at 95°C for 5 min. This was followed by 35 cycles at 95°C for 10 s, at 60°C for 10 s, and at 72°C for 10 s. Melting from 65 to 95°C was followed by extension at 72°C for 2 min. Melting temperature graphs, standard curves, and threshold cycle (Ct) values were acquired for each gene analyzed. The expression data were normalized to the corresponding values for the housekeeping gene (βactin). Individual relative fold changes were calculated by the Pfaffl method and then fold changes for each treatment were calculated compared with the control for the corresponding culture. Lyophilized primers (sequences in Table 2) were purchased from Integrated DNA Technologies (Coralville, Iowa) and dissolved in DNase and RNase free water. In this study, we analyzed expression of the murine orthologs to genes associated with IMI metabolism in human liver microsomes (Table 1). Untreated whole adult ovaries, isolated antral follicles, kidneys, and livers were used for primer validation because many of the selected genes have not been characterized in the ovaries. In the untreated tissues, we quantified aldehyde oxidase 4 (Aox4), cytochrome P450 family 2 subfamily A member 5 (Cyp2a5), cytochrome P450 family 2 subfamily C member 29 (Cyp2c29), and cytochrome P450 family 3 subfamily A member 11 (Cyp3a11), cytochrome P450 family 1 subfamily A member 2 (Cyp1a2), and cytochrome P450 family 2 subfamily B member 10 (Cyp2b10). In the IMI treated follicles, we quantified aldehyde oxidase 1 (Aox1), aldehyde oxidase 2 (Aox2), aldehyde oxidase 3 (Aox3), cytochrome P450 family 2 subfamily D member 22 (Cyp2d22), cytochrome P450 family 2 subfamily E member 1 (Cyp2e1), and cytochrome P450 family 4 subfamily F member 18 (Cyp4f18).
Genes and primer sequences used in PCR
| Gene Name | Symbol | Forward Sequence | Reverse Sequence |
|---|---|---|---|
| Beta actin (housekeeper) | βactin | GGGCACAGTGTGGGTGAC | CTGGCACCACACCTTCTAC |
| Aldehyde oxidase 1 | Aox1 | ATAGGCGGCCAGGAACATTT | GCTGAGAGCTTCAAGGTTGC |
| Aldehyde oxidase 2 | Aox2 | AGAACGGAAGCTGGAGTGTG | CCGCCTATGTGTATTTCACCTTC |
| Aldehyde oxidase 3 | Aox3 | AAAAAGGTCACCGAGAGGAATG | GGGGTCGTATCTTGAGATCATCA |
| Aldehyde oxidase 4 | Aox4 | CCTTCCGTCTCCGAGTCTGA | GCTGTACTTAGTGCCTGTGAG |
| Cytochrome P450 family 1 subfamily A member 2 | Cyp1a2 | AGTACATCTCCTTAGCCCCAG | GGTCCGGGTGGATTCTTCAG |
| Cytochrome P450 family 2 subfamily A member 5 | Cyp2a5 | CCTTCCTCATCCGAATGCTGGA | TGACGGTCTCTGTGCCAGCAAA |
| Cytochrome P450 family 2 subfamily B member 10 | Cyp2b10 | GTCGTTGAGCCAACCTTCAA | TTGGGCTTCCTCCTGAATCC |
| Cytochrome P450 family 2 subfamily C member 29 | Cyp2c29 | TCCCCATGGTTGCAGGTAAAC | GTCCCTGCACCAAAGAGGTC |
| Cytochrome P450 family 2 subfamily D member 22 | Cyp2d22 | CAGTGGTTGTACTAAATGGGCT | GCTAGGACTATACCTTGAGAGCG |
| Cytochrome P450 family 2 subfamily E member 1 | Cyp2e1 | TGGCTACAAGGCTGTCAAGG | TTAGGGAAAACCTCCGCACG |
| Cytochrome P450 family 3 subfamily A member 11 | Cyp3a11 | GTGCTCCTAGCAATCAGCTT | CAGTGCCTAAAAATGGCAGAGG |
| Cytochrome P450 family 4 subfamily F member 18 | Cyp4f18 | GCGAGCCTGAGGAGATTGAA | ATTGCAGTGACGGGAGGATG |
| Marker of proliferation Ki-67 | Ki67 | GCTCACCTGGTCACCATCAA | ACTACAGGCAGCTGGATACG |
Statistical analysis
All data analyses were performed using Graphpad Prism 9.4.1. Data were expressed as means ± SEM (standard error of the mean) from 5 separate cultures per timepoint. For gene expression data, multiple comparisons between normally distributed experimental groups were made using 1-way analysis of variance followed by Dunnett’s post hoc comparison. If data were not normally distributed, comparison between groups was performed using Kruskal-Wallis sample tests. Statistical significance was assigned at p ≤ .05.
Results
IMI and IMI metabolite levels in culture media from antral follicles
Isolated antral follicles were cultured in media treated with IMI (0.2, 2, 20, and 200 µg/ml) and the media were used to determine IMI concentrations after 48 and 96 h in culture. For each timepoint, one experiment included environmental controls (media that were cultured in the absence of antral follicles and used to determine how much IMI was broken down in the environment). At both time points, we found that IMI concentrations (2 and 200 µg/ml treatment groups) were lower in the media from cultured follicles compared with the media cultured without follicles, indicating that the follicles were metabolizing IMI (Figure 2). All oxidized metabolites were detected in the media cultured with follicles and they were not detected in the environmental controls. At both timepoints, 5-OH-IMI was the predominant intermediate followed by 4-OH-IMI and IMI-ole (Figure 3). The reduced intermediate DNI was detected in the media cultured with follicles as well as the environmental controls at 48 and 96 h. At 48 h, the DNI in the media cultured with follicles exceeded the environmental controls, whereas at 96 h, less DNI was present in the media cultured with follicles compared with the environmental controls (Figure 4). After 48 h, IMI-urea was only detected in the media cultured with follicles. By 96 h, IMI-urea was detected in the media cultured with follicles as well as the environmental controls. In the lower treatment groups (0.2 and 2 µg/ml), IMI-urea was only detected in the environmental controls. In the higher treatment groups (20 and 200 µg/ml), more IMI-urea was detected in the media cultured with follicles compared with the environmental controls. The metabolite 6HNA was not detected in any samples, whereas 6CNA was detected in the media cultured with follicles as well as the environmental controls at 48 and 96 h (Figure 5).
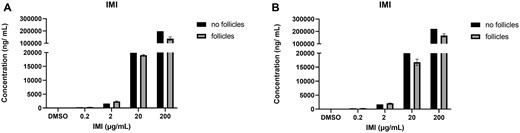
IMI quantification in media cultured with and without antral follicles. Media were treated with DMSO or IMI (0.2–200 µg/ml) for 48 (A) and 96 (B) hours. The graphs indicate means ± SEMs from 5 to 7 separate cultures (8–12 follicles per treatment per culture). Abbreviations: DMSO, dimethyl sulfoxide; IMI, imidacloprid.
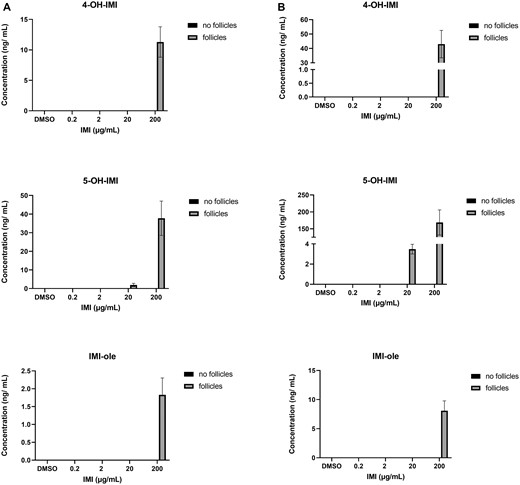
Quantification of oxidized IMI intermediates (4-OH-IMI, 5-OH-IMI, and IMI-ole) in media cultured with and without antral follicles. Media were treated with DMSO or IMI (0.2–200 µg/ml) for 48 (A) and 96 (B) hours. The graphs indicate means ± SEMs from 5 to 7 separate cultures (8–12 follicles per treatment per culture). Note: No metabolites were present in media cultured without follicles. Abbreviations: DMSO, dimethyl sulfoxide; IMI, imidacloprid.

Quantification of reduced IMI intermediates (DNI and IMI-urea) in media cultured with and without antral follicles. Media were treated with DMSO or IMI (0.2–200 µg/ml) for 48 (A) and 96 (B) hours. The graphs indicate means ± SEMs from 5 to 7 separate cultures (8–12 follicles per treatment per culture). Note: IMI-urea was not present in media cultured without follicles. Abbreviations: DMSO, dimethyl sulfoxide; DNI, desnitro-imidacloprid; IMI, imidacloprid.
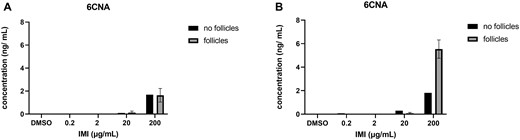
6CNA quantification in media cultured with and without antral follicles. Media were treated with DMSO or IMI (0.2–200 µg/ml) for 48 (A) and 96 (B) hours. The graphs indicate means ± SEMs from 5 to 7 separate cultures (8–12 follicles per treatment per culture). Abbreviations: DMSO, dimethyl sulfoxide; IMI, imidacloprid.
Metabolic enzyme gene expression in the ovary
Whole adult ovaries, antral follicles, kidney, and liver tissues were used for primer validation because many IMI-associated genes have not been characterized in the ovaries. Cyp2c29 and Cyp3a11 were not detected in whole adult ovaries. Aox4, Cyp1a2, Cyp2a5, and Cyp2b10 were detected in whole adult ovaries, but not in isolated antral follicles. Aox1, Aox2, Aox3, Cyp2d22, Cyp2e1, and Cyp4f18 were detected in both whole adult ovaries and isolated antral follicles (Figure 6).
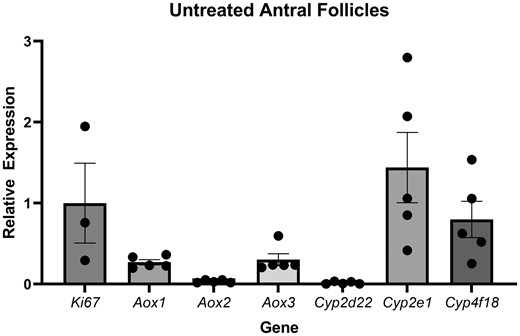
Gene expression of metabolic enzymes in untreated antral follicles. The graphs indicate means ± SEMs from 5 separate cultures (8–12 follicles per treatment per culture).
Isolated antral follicles were cultured in media treated with IMI (0.2, 2, 20, and 200 µg/ml) for 48 and 96 h. At the end of each culture period, follicles were used for gene expression analysis of metabolic enzymes associated with IMI metabolism. At 48 h, IMI exposure did not affect expression of any metabolic enzymes compared with control (Figs. 7A and 8A). At 96 h, IMI (200 µg/ml) significantly increased Cyp2e1 and Cyp4f18 expression compared with control (Figs. 7B and 8B). Comparatively, IMI induced Cyp2e1 to a greater extent than Cyp4f18.
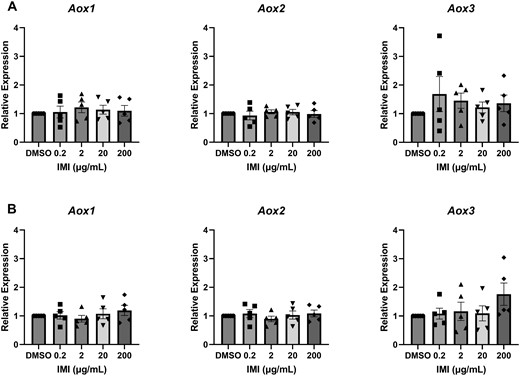
Gene expression of aldehyde oxidases in antral follicles treated with DMSO or IMI (0.2–200 µg/ml) for 48 (A) and 96 (B) hours. The graphs indicate means ± SEMs from 5 separate cultures (8–12 follicles per treatment per culture). Abbreviations: DMSO, dimethyl sulfoxide; IMI, imidacloprid.
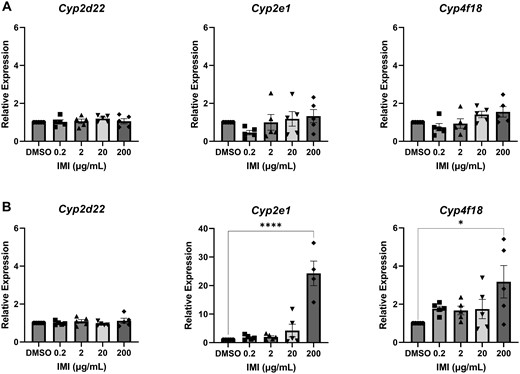
Gene expression of cytochrome P450s in antral follicles treated with DMSO or IMI (0.2–200 µg/ml) for 48 (A) and 96 (B) hours. The graphs indicate means ± SEMs from 5 separate cultures (8–12 follicles per treatment per culture). Asterisks indicate significant differences between treatment groups and DMSO controls. *p < .05, ****p < .00001. Abbreviations: DMSO, dimethyl sulfoxide; IMI, imidacloprid.
Discussion
Most data on IMI tissue disposition and pharmacokinetics come from experiments using male laboratory animals, leaving many gaps in knowledge regarding the effects of IMI in female mammals. This is particularly relevant in the context of IMI metabolism because Arslan et al. (2016) have shown that sex steroid hormones may regulate CYP-mediated metabolism of IMI. Furthermore, IMI and the terminal metabolites 6CNA and 6HNA have been detected in the ovaries of Wistar rats within hours of IMI exposure (20 mg/kg) and reach peak concentrations 12 h post exposure, with the metabolite 6HNA being the predominant chemical identified at the 12-h time point. In other tissues, IMI was the predominant chemical identified at the 12-h time point, indicating that IMI may be rapidly and preferentially converted to 6HNA in the ovaries (Kapoor et al., 2014). The ovary’s ability to metabolize IMI can determine the toxicological consequences of ovarian exposure to IMI. Previously, we have shown that IMI and the bioactive metabolite DNI differentially affect ovarian antral follicle growth, morphology, and hormone synthesis in vitro (Mourikes et al., 2023). Notably, DNI, but not IMI, inhibited follicle growth and caused antral follicles to rupture in culture compared with the controls (Mourikes et al., 2023). In the context of these findings, we designed a study to determine the capacity of mature ovarian follicles to metabolize and bioactivate IMI. We directly exposed isolated antral follicles to IMI in culture for 48 and 96 h to quantify IMI metabolites and gene expression of metabolic enzymes. We also cultured IMI-treated media in the absence of ovarian follicles to determine the extent to which IMI is broken down in the environment. Using the culture media, we quantified oxidized intermediates (5-OH-IMI, 4-OH-IMI, and IMI-ole), reduced intermediates (DNI and IMI-urea), and terminal phase I metabolites (6CNA and 6HNA). Using the antral follicles, we quantified expression of AOXs and CYPs associated with IMI metabolism in other tissues.
After 48 and 96 h, we detected less IMI in the media from cultured follicles compared with the environmental controls, supporting the hypothesis that ovarian tissues have some capacity to metabolize IMI. Previously, we have shown that IMI (0.2–20 µg/ml) does not interfere with antral follicle growth, morphology, and sex steroid hormone production at 48 or 96 h, whereas IMI (200 µg/ml) significantly increased follicular progesterone at 96 h (Mourikes et al., 2023). Together, these data suggest that at environmentally relevant levels, the follicles’ ability to metabolize IMI is unrelated to their growth and steroidogenic capacity in vitro.
Follicular oxidation of IMI to 5-OH-IMI, 4-OH-IMI, and subsequently IMI-ole was demonstrated by the detection of all 3 metabolites in the media from cultured follicles, with 5-fold increases in their concentrations at 96 h compared with 48 h (Figure 3). None of these metabolites were detected in the environmental controls, verifying the role of the follicles in oxidizing IMI. Of the 6 metabolic enzymes quantified in antral follicles, Cyp4f18 was the only enzyme that catalyzed IMI oxidation and it was the second most expressed enzyme in the untreated follicles, suggesting that Cyp4f18 is constitutively expressed in antral follicles in the absence of toxic insult. In the IMI (200 µg/ml) exposed follicles, Cyp4f18 was significantly induced at 96 h compared with controls (Figure 8). Collectively, these data indicate that environmentally relevant levels of IMI can be oxidized by Cyp4f18 at its baseline expression levels and that ovarian follicles can induce its expression in the presence of high IMI levels in a time-dependent manner.
IMI is reduced to DNI and subsequently IMI-urea (Casida, 2011). Interestingly, the media from cultured follicles had more DNI than the environmental controls at 48 h and less DNI than the environmental controls at 96 h (Figure 4). We expected to see appreciable levels of DNI in the environmental controls because published studies indicate that IMI is readily reduced to DNI in the environment (Craddock et al., 2019; Elumalai et al., 2021; Kandil et al., 2015; Lindgren et al., 2022; Mahai et al., 2021; Naumann et al., 2021; Wan et al., 2020; Wang et al., 2022, 2023). Our interpretation of these data is that IMI is rapidly converted to DNI in the environment and in the follicles, but the follicles play a critical role in converting DNI to IMI-urea and other down-stream metabolites. Furthermore, follicular reduction of IMI is likely happening in less than 48 h. By 48 and 96 h, any DNI that was previously formed had already been converted to IMI-urea and other down-stream metabolites, resulting in decreased concentrations of DNI in the media cultured with follicles compared with the environmental controls. Overall, IMI-urea was detected at much higher concentrations than DNI, further supporting our hypothesis that the follicles rapidly convert IMI to DNI, and by 48 h, appreciable amounts of DNI have already been converted to IMI-urea. By 96 h, there were significant levels of IMI-urea in the environmental controls in the lower treatment groups, indicating that DNI can be converted to IMI-urea in the environment at a slow rate. In the higher treatment groups, we detected more IMI-urea in the media cultured with follicles compared with the environmental controls. The increased levels of IMI-urea in the media cultured with follicles at the higher treatment groups coincide with the induction of Cyp2e1, suggesting that Cyp2e1 plays a critical role in the conversion of DNI to IMI-urea.
Of the 6 metabolic enzymes identified in untreated antral follicles, 5 are associated with the reduction of IMI. AOXs, best characterized as xenobiotic oxidizers, have been identified as major contributors to IMI bioactivation by catalyzing the reduction of the nitro group (Dick et al., 2005; Swenson and Casida, 2013). Interestingly, their nitro reductive capacity varies greatly among species, with the highest activity levels reported in rabbits and monkeys, followed by humans, mice, cows, and rats (Dick et al., 2005; Khidkhan et al., 2021). Dogs and cats, which are chronically exposed to IMI through flea and tick preventatives, have negligible AOX activity (Dick et al., 2005). We detected 3 of the 4 mouse Aox orthologs in the untreated antral follicles (Figure 7). Aox3, the ortholog that shares the highest identity to human Aox, was predominantly expressed followed by Aox1 and Aox2. Although none of the Aoxs were transcriptionally induced by IMI at 48 or 96 h, their role in the rapid conversion of IMI to DNI should be further investigated at earlier time points, when we suspect that the nitroreduction of IMI is taking place in the follicles.
The remaining metabolic enzymes identified in untreated antral follicles were Cyp2d22, which had the lowest relative expression levels and Cyp2e1, which had the highest relative expression levels of all the evaluated genes. Beyond the steroidogenic regulators, we expect the ovaries to have limited Cyp diversity. Few detoxifying Cyps have been characterized in the ovaries including CYP2E1, which has been shown to modulate the formation of reactive oxygen species in microplastic and di(2-ethylhexyl)phthalate-exposed granulosa cells as well as the bioactivation of 4-vinylcyclohexene in neonatal ovaries in vitro (Rajapaksa et al., 2007; Wu et al., 2023). Cyp2e1 induction has also been demonstrated in neonatal ovaries exposed to polycyclic aromatic hydrocarbons in vitro (Madden et al., 2014). In fact, we observed a significant induction of Cyp2e1 in IMI-exposed (200 µg/ml) follicles at 96 h. This induction coincides with elevated levels of IMI-urea and 6CNA in media cultured with follicles compared with environmental controls, supporting the conclusion that Cyp2e1 has a role in follicular IMI reduction. Although our study focused on antral follicles, Cyp2e1 is likely expressed throughout the ovary. Thus, we expect that there might be greater metabolism of IMI in vivo relative to the isolated antral follicles. Interestingly, we previously reported that after 96 h, IMI (200 µg/ml) exposure increased progesterone levels in media from cultured antral follicles compared with DMSO-exposed follicles (Mourikes et al., 2023). In vivo, progesterone levels have been shown to mediate the constitutive expression of Cyp2e1 in the livers of female rodents more so than the other sex steroid hormones (Konstandi et al., 2013). If these same regulatory mechanisms exist within the ovary, the induction of Cyp2E1 in IMI exposed follicles may also be mediated by progesterone.
In the liver, all redox intermediates of IMI are converted to 6HNA or 6CNA which form various phase II conjugates prior to excretion (Casida, 2011). Interestingly, 6HNA, identified as the predominant ovarian metabolite in vivo, was the only metabolite that was not recovered in the media from our antral follicle cultures, suggesting that other ovarian cell types or the liver are critical for the conversion of IMI to 6HNA. In contrast, 6CNA was detectable in the media from cultured follicles at 48 h and increased 3-fold by 96 h (Figure 5). The formation of 6CNA at 48 h cannot be attributed to follicular metabolism because equal proportions of 6CNA were present in the follicle media and the environmental controls. By 96 h, significantly more 6CNA was present in the media from cultured follicles compared with the environmental controls, indicating that the follicles play a role in its formation at later timepoints.
Altogether, these data support our hypothesis that ovarian antral follicles can metabolize IMI in vitro and they express many of the same IMI-associated enzymes as the liver. These data contribute to our understanding of the effects of IMI in female mammals and provide some insights into the detoxification capacity of the ovary in the absence of the liver.
Supplementary data
Supplementary data are available at Toxicological Sciences online.
Acknowledgments
The authors would like to thank the Carver Metabolomics Core Facility of the Roy J. Carver Biotechnology Center for IMI and IMI metabolite quantification.
Declaration of conflicting interests
The authors declared no potential conflicts of interest with respect to the research, authorship, and/or publication of this article.
Funding
NIH (F30 ES033914, T32 ES007326, R01 ES028661).

Comments