


Abstract
Humans are consistently exposed to thousands of untested chemicals that have been detected in the follicular fluid of the ovaries, and can disrupt reproductive health. Human granulosa cells (GCs) are the functional unit of the ovarian follicle with steroidogenic and signaling activities, and play a pivotal role in oocyte development. During follicle progression, GCs multiply to form a 3D avascular structure, and establish gap junction intercellular communication (GJIC) that is critical to maintaining optimal viability and function. We developed a high-throughput in vitro platform of human GCs for the screening of chemicals that can impact GJIC and estradiol (E2) production of human granulosa. Our granulosa 3D microtissues fabricated with human ovarian granulosa-like tumor KGN cells are multicell-layered structures that mimic the avascular granulosa layers surrounding the oocyte. These microtissues robustly expressed the steroidogenic CYP19 aromatase enzyme and GJIC intercellular membrane channel, connexin 43. Granulosa microtissues produced E2 at rates comparable to primary human GCs as previously reported. E2 production was suppressed by the CYP19 inhibitor, letrozole, and induced by CYP19 activators, bisphenol A at 100 µM, and genistein at 100 µM. Granulosa microtissues displayed active GJIC function, as demonstrated by the connexin 43-dependent diffusion of calcein fluorescent dye from microtissue surface to the core using high-throughput confocal microscopy in conjunction with our open-sourced automated image analysis tool. Overall, our 3D human granulosa screening platform is highly promising for predictive and efficient in vitro toxicity testing to screen for chemicals that contaminate follicular fluid and may affect fertility.
Granulosa cells (GCs) provide critical functions in the female reproductive system (Bahr, 2018; Baumgarten and Stocco, 2018; Fraser, 2006). Ovarian follicles consist of an oocyte and surrounding follicular wall comprised of an inner layer of GCs and an outer layer of theca cells (TCs) separated by a basement membrane. TCs have both blood vessels and nerves (Gougeon, 1986), whereas the GCs are devoid of both, but are exposed to follicular fluid (Bahr, 2018; Baumgarten and Stocco, 2018; Fraser, 2006). Together, GCs and TCs provide the hormonal milieu required to support early pregnancy (Baumgarten and Stocco, 2018). TCs synthesize androgens (including testosterone) as precursors that are converted by GCs into estradiol (E2) via the aromatase enzyme (CYP19) (Baumgarten and Stocco, 2018). Follicle stimulating hormone (FSH) induces GCs CYP19 transcription and activity via increasing intracellular cyclic adenosine monophosphate (cAMP; Parakh et al., 2006). TCs are the primary site of progestin (eg, progesterone) production, whereas GCs synthesize a basal level of progesterone until stimulated by luteinizing hormone immediately prior ovulation (Baumgarten and Stocco, 2018).
Cuboidal GCs proliferate from single to multiple layers during follicle development, forming a 3D avascular structure (Bahr, 2018; Baumgarten and Stocco, 2018; Fraser, 2006). Gap junctions are critical for the direct communications between GCs, and between GCs and the oocyte to orchestrate folliculogenesis (Bahr, 2018; Baumgarten and Stocco, 2018; Fraser, 2006; Grazul-Bilska et al., 1998). Gap junction intercellular communication (GJIC) is mediated by intercellular membrane channels composed of connexins (eg, connexin 43 [Cx43]) that allow coupled cells to share small molecules (< 1 kDa) including second messengers and metabolites (Downs, 1995; Eppig, 1991; Kidder and Mhawi, 2002). Receptor-mediated signals that regulate meiotic maturation of oocyte pass through GC-oocyte gap junctions (Coskun and Lin, 1994; Downs, 1995; Fagbohun and Downs, 1991; Grazul-Bilska et al., 1998), in part via diffusion of cyclic guanosine monophosphate (cGMP; Shuhaibar et al., 2015). Cx43 is present during the onset of folliculogenesis, and Cx43 deletion inhibited GC proliferation (Ackert et al., 2001; Gittens et al., 2003; Juneja et al., 1999; Kidder and Mhawi, 2002).
The increased production of industrial chemicals, along with lenient controls and limited safety testing, has translated to widespread chronic human exposure to environmental pollutants that may impact reproductive health (Björvang and Damdimopoulou, 2020). Disruptions of the appropriate intraovarian signaling pathway (eg, GJIC, hormonal actions) could lead to deleterious effects on reproduction (Björvang and Damdimopoulou, 2020; Woodruff et al., 2008). Heavy metals, polychlorinated biphenyls, insecticides, as well as persistent chemicals like per- and polyfluoroalkyl substances have been detected in follicular fluid (Björvang and Damdimopoulou, 2020; Bloom et al., 2012; Younglai et al., 2002), demonstrating direct exposure of ovarian follicles. Importantly, these chemicals in follicular fluid have been associated with worse outcomes in in vitro fertilization (IVF; Bloom et al., 2017; Johnson et al., 2012; Mahalingaiah et al., 2012; Petro et al., 2012; Younglai et al., 2002). Needed are new, more effective and higher throughput methods to screen emerging chemicals for their potential impact on the female reproductive system.
The in vitro culture of GCs is a valuable model for studying female reproductive hormone synthesis, follicular development, and fertility (Havelock et al., 2004). However, primary human GCs has limitations as a cell source for in vitro models because of the small numbers of cells, a short life span in vitro, their rapid luteinization soon after isolation (Breckwoldt et al., 1996), and their limited generalizability when derived from patients undergoing IVF (Bagnjuk and Mayerhofer, 2019). KGN cells are a human granulosa-like immortalized cell line that was established from a stage III GC carcinoma (Nishi et al., 2001). KGN cells have an unlimited life span, but can be limited by its cancerous nature, particularly when cultured as a conventional 2D monolayer (Nishi et al., 2001). KGN cells in 2D maintained most physiological activities including the expression of functional FSH receptor, as well as the same pattern of steroidogenesis and Fas-mediated apoptosis as observed in normal GCs (Nishi et al., 2001). However, E2 synthesis by KGN cells cultured in 2D was significantly lower than primary human GCs (Havelock et al., 2004; Schipper et al., 1993; Wen et al., 2010). Furthermore, the 2D monolayer model cannot recapitulate the 3D avascular multicell layer of GCs in vivo that is critical for evaluating how environmental contaminants may alter GJIC.
This study determined if KGN cells cultured as 3D spheroids improve their ability to recapitulate the native physiology, the 3D avascular multicell-layer structure, and GJIC of human GCs in ovarian follicles. In addition, we developed a high-throughput platform accompanied with automated data analysis for the rapid screening of chemicals that may modulate GJIC.
MATERIALS AND METHODS
Cell culture
Human ovarian granulosa-like cells (KGN) were a gift from Yanase T. and Nishi Y., the laboratory that established the KGN cell line (Bao et al., 2011; Nishi et al., 2001) and externally authenticated. KGN cells were expanded in complete Dulbecco’s Modified Eagle Medium (DMEM; Thermo Fisher Scientific, Waltham, Massachusetts, 11995073) with 10% fetal bovine serum (FBS; Thermo Fisher Scientific, 12483020) and 1% penicillin/streptomycin (MP Biomedicals, Irvine, California, 091670249) at 37°C with 10% CO2. KGN cells were used between passages 10 and 16. Confluent cell monolayers were harvested using 0.05% trypsin (Fisher Scientific; SH3004201), concentrated by centrifugation at 120 × g for 6 min, and counted. Cells were resuspended in serum-free DMEM prior to seeding into nonadhesive agarose micromolds for spheroid formation.
Micromold fabrication and hydrogel formation for the high-throughput 96-well plate platform to study GJIC
Molds, designed using computer-assisted design (CAD; Solidworks, Concord, Massachusetts), have been previously described and consisted of a base platform upon which lay a series of 6 rows by 8 columns of pegs, with each peg designed to fit within 1-well of 96-well plate (Sensoplate Plus, Grenier Bio One; Leary et al., 2018). Atop each peg were 4 conical-shaped microposts. Molds were milled out of aluminum (Proto Labs, Inc, Maple Plain, Minnesota). To form hydrogels, 90 µl of sterile 2% w/v molten agarose in phosphate-buffered saline (PBS) was pipetted into each well and the mold was inverted on top of the 96-well plate allowing the microposts to be submerged in agarose. The mold was removed after 10 min when the agarose solidified. Each agarose hydrogel contained 4 microrecesses where spheroids would be formed. Prior to spheroid formation, hydrogels were equilibrated with 150 µl of serum-free DMEM supplemented with 1% penicillin/streptomycin for 24 h incubating at 37°C with 10% CO2.
Spheroid formation, fluorescent dye labeling, and drug treatment for high-throughput 96-well platform
Confluent KGN cell monolayers were labeled with 5 µM CellTracker Green CMFDA (CTG) (Fisher Scientific, C7025). The CTG-staining of KGN cells in monolayer was used to normalize fluorescence loss due to the optical limitations of confocal microscopy of 3D spheroids, as previously described (Leary et al., 2018). For dye labeling, the medium was removed and the cells were washed once with serum-free DMEM. Dyes were reconstituted in serum-free DMEM, and incubated with the cells for 30 min at 37°C with 10% CO2. After labeling, medium was exchanged with fresh serum-free DMEM, and incubated for 15 min (37°C, 10% CO2). The labeled cell monolayers were trypsinized, centrifuged, and resuspended in serum-free DMEM at a concentration of 200 000 cells/ml. A 20 µl aliquot of cell suspension was pipetted into the loading dock of each hydrogel to form 4 spheroids, each composed of approximately 1000 cells. After allowing the cell suspension to settle to the bottoms of the microwells for 30 min, 150 µl of serum-free DMEM was added per well. GJIC was evaluated by measuring the diffusion of the membrane-permeant nonfluorescent dye calcein-red-orange-AM dye (calceinRO; Fisher Scientific, 50-113-7411), which is converted to a membrane-impermeant fluorescent calcein after acetoxymethyl ester hydrolysis by intracellular esterases. When inside the cells of the outer layer of the spheroid, the membrane-impermeant fluorescent calcein can only diffuse into the inner cell layers of spheroids via GJIC. Twenty-four hours later after the cells had self-assembled spheroids, 2.5 µM of calceinRO was added. To inhibit GJIC, spheroids were incubated with 0–100 µM carbenoxolone (CBX) for 5 h prior to the addition of calceinRO.
Confocal microscopy of KGN spheroids in high-throughput 96-well platform
Spheroids were imaged using the Opera Phenix High Content Screening System (Perkin Elmer, Waltham, Massachusetts), equipped with proprietary Synchrony Optics consisting of a Nipkow spinning microlens disk in conjunction with pinhole disk and 2 sCMOS cameras. Fluorescent images for each dye were acquired using the 20× water objective in conjunction with 2 excitation lasers: 488 nm for CTG and 561 nm for calceinRO. Confocal z-stacks were acquired every 5 µm for a total of 375 µm. To study the dose-dependent effects of CBX on GJIC inhibition, spheroids were exposed to 0, 3.125, 6.25, 12.5, 25, 50, or 100 µM of CBX for 5 h prior to addition of calceinRO (3 independent studies; a total of 663 spheroids were analyzed with approximately 80 spheroids per dose). Spheroids were then imaged approximately 80 min after the addition of calceinRO. The 80 min time between calceinRO addition and imaging was selected based on our previously published work that elucidated the kinetics of calcein diffusion in KGN spheroid (Achilli et al., 2014; Leary et al., 2016). To provide visualization of the calceinRO diffusion in KGN spheroids over time, spheroids were imaged at approximately 30, 45, 70, and 80 min after the addition of calceinRO. The same spheroid could not be imaged over all 4 time points due to the extended plate imaging time required by the Opera Phenix for our experimental setup.
Spheroid formation, fluorescent dye labeling, and confocal imaging of partially stained KGN cells in 3D spheroids to measure single-cell volume within spheroids
One flask of a confluent KGN cell monolayer was labeled with 5 µM CTG as described above. One flask of an unstained confluent KGN cell monolayer and 1 flask of a CTG-stained confluent KGN cell monolayer were trypsinized, resuspended in serum-free DMEM, counted, and mixed in 1:9 ratio of stained: unstained KGN cells to generate a cell suspension for seeding into hydrogel to form 4 spheroids, each composed of approximately 5000 cells. Suspensions of KGN cells (10% CTG labeled) were seeded into agarose molds and self-assembled for 12 h. Confocal image stacks (total height 250 µm, 1 µm z-axis interval) of 3D spheroids were obtained using the Opera Phenix (40× water immersion objective, NA = 1.1; Figure 1B, Supplementary Video 1). For volume analysis, the Find Nuclei region of interest (ROI) function in the Perkin Elmer Harmony software was used to identify individual cells and compute volume. Doublets and cell fragments were removed by thresholding. Specifically, the volume datasets were filtered to eliminate measurements from single ROIs containing multiple cells and ROIs containing staining segments not quantitative of a single cell. Volume measurements > 7000 µm3 were excluded from analysis to eliminate multiple cell ROIs measured via the Harmony software. Volume measurements < 1000 µm3 were excluded from data analysis as well. On average, ROIs formed below this parameter contained stained segments within the field of view and were not connotative of a single cell. A total of 5239 cells in 45 spheroids (n = 15 spheroids per independent experiment) were analyzed for single-cell volume (Figure 1C), with a mean ± SD cell volume of 2442 ± 1307 µm3 and a median cell volume of 2014 µm3.
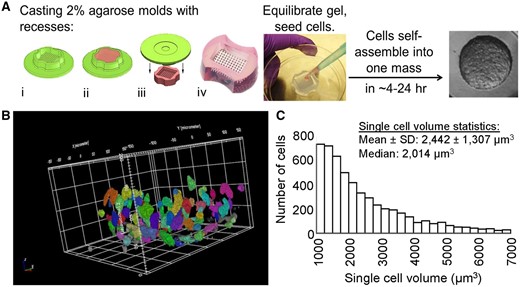
Methods for forming 3D spheroids with human KGN cells and analysis of single-cell volume of KGN cells within spheroids. To form spheroids, monodispersed KGN cells were pipetted into micromolded agarose gels with circular recesses wherein they self-assembled spheroids (approximately 750 cells/spheroid) within 24 h (A). The micromolded agarose gels were made with the 3D Petri Dish system (A-i), where 2% molten agarose was pipetted and gelled inside the dish (A-ii), the gel was removed (A-iii), and equilibrated in serum-free culture medium (A-iv). Monodispersed KGN cells were pipetted into the agarose gels, settled into the circular recesses by gravity, and self-assembled into spheroids within 24 h. Size and morphology of CellTracker Green CMFDA (CTG) labeled KGN cells in 3D spheroids (B, C). Suspensions of KGN cells (10% CTG labeled) were seeded into agarose molds and self-assembled for 12 h. Confocal image stacks (total height 250 µm, 1 µm z-axis interval) of 3D spheroids were obtained using the Opera Phenix (40× water immersion objective, NA = 1.1). For volume analysis, the Find Nuclei region of interest function in the Perkin Elmer Harmony software was used to identify individual cells and compute volume. Doublets and cell fragments were removed by thresholding. Three independent experiments were performed. The histogram in C consists of volume measurements for 5239 cells of 45 spheroids with a mean ± SD cell volume of 2442 ± 1307 µm3 and a median cell volume of 2014 µm3.
Automated batch processing and analysis of confocal images for the high-throughput 96-well plate platform to study GJIC
Spheroids with an equatorial diameter between 20 and 80 µm were included. These selection criteria were based upon previous work (Leary et al., 2018) where fluorescence in spheroids with diameters > 80 µm cannot be accurately quantified with our method due to the optical limitations of confocal microscopy. GJIC of KGN spheroids with or without the GJIC inhibitor CBX, as depicted by the degree of calceinRO diffusion or the “Diffusion Index” from spheroid surface into the inner cell layers of spheroids, were represented as a ratio by dividing the normalized calceinRO for concentric shells 4 and 5 counted from the surface of the spheroid with the normalized calceinRO for concentric shells 1 and 2. Open-sourced Matlab code for automatic batch processing is located in the Supplementary Materials.
Spheroid formation for hormone studies
KGN spheroids were formed in nonadhesive agarose micromolds (Figure 1A) with 256 circular recesses (400 μm in diameter) that were cast from flexible polymeric molds (Microtissues, Inc., Providence, Rhode Island) filled with 2% w/v molten agarose (Thermo Fisher Scientific, BP160) in PBS (GE Healthcare, Westborough, MA SH30256.FS). One micromolded agarose gel was placed in 1-well of a 12-well cell culture plate and gels were equilibrated in serum-free medium supplemented with 1% penicillin/streptomycin with 3 medium exchanges. After trypsinization, monodispersed KGN cells were pipetted into each gel such that each microwell, and therefore, each spheroid would contain approximately 375–3000 cells/spheroid, depending on experiment. A total of 750 or 1000 cells/spheroids were used for most experiments except those that examined the effect of spheroid size on hormone production. KGN spheroids were allowed to self-assemble for 24 h in DMEM with 10% charcoal:dextran-stripped FBS (CDS; Gemini Bio, West Sacramento, California, 100-119, Lot No. A37E22F), and 1% penicillin/streptomycin at 37°C with 10% CO2. The charcoal:dextran stripping removed most of the hormones (estrogen, testosterone, etc.) that are normally present in serum, while retaining other biochemicals including cholesterol. KGN spheroids in agarose molds were imaged from underneath in brightfield using a Zeiss Axio Observer Z1 microscope equipped with an Axio MRm camera (Carl Zeiss Micro-Imaging, Thornwood, New York). The cross-sectional area of spheroids was measured using ImageJ (U.S. National Institutes of Health, Bethesda, Maryland). Spheroids were assumed to be spherical. Spheroid radius was calculated from the measured cross-sectional area using and was used to calculate spheroid volume (.
Analysis of hormone production
To measure hormone production (E2 or progesterone), KGN cells were allowed to self-assemble for 24 h and the media was changed to DMEM-CDS and collected after 72 h for analysis. For E2 production, testosterone, the precursor for E2 was added (10−7M) (Sigma Aldrich, St Louis, Missouri, T1500), or 5α-dihydrotestosterone (DHT), the nonreactive testosterone analog, was added (10−7M; Sigma Aldrich, A8380). Also included was a vehicle control. Testosterone and DHT stocks were made with 100% ethanol (Electron Microscopy Sciences, Hatfield, Pennsylvania, 15056). The testosterone concentration was selected to match that used in previously published work with primary human GCs (Schipper et al., 1993; Wen et al., 2010) or KGN cells (Nishi et al., 2001). To induce hormone production, various doses of cell-permeable dibutyryl-cAMP, sodium salt (R&D Systems, Minneapolis, Minnesota, 1141, water-soluble) dissolved in sterile water or FSH from human pituitary (Sigma Aldrich, F4021, PBS-soluble) dissolved in sterile PBS were added. The concentrations of human FSH (hFSH; 250 ng/ml or 2.5 IU/ml) and dibutyryl-cAMP (0–10−3 M) were compatible to published work using KGN cells (Meseke et al., 2018; Nishi et al., 2001; Simon et al., 2017; Xie et al., 2017). To examine the effect of CYP19 inhibition on hormone production, KGN spheroids were treated with the CYP19 inhibitor, letrozole (R&D Systems, 4382) at concentrations of 0 to 100 000 pM. KGN spheroids were also treated with bisphenol A (BPA; Sigma Aldrich, 239658) dissolved in 100% ethanol at concentrations of 0 to 100 μM based on prior published work (Feng et al., 2016; Kwintkiewicz et al., 2010; Watanabe et al., 2012), and genistein (Sigma Aldrich, 345834) dissolved in sterile dimethyl sulfoxide (DMSO; Sigma Aldrich, D2650) at concentrations of 0–100 μM based on prior published work (Lacey et al., 2005; Nynca and Ciereszko, 2006), to examine their potential effects on steroidogenesis. The final concentration of ethanol and DMSO were < 0.1% in all experiments.
Levels of E2 and progesterone were measured using commercially available ELISA kits (E2, R&D Systems, KGE014; Progesterone, Enzo Life Sciences, Inc., Farmingdale, New York, ADI-900-011) according to the manufacturer’s protocol. These ELISA kits were selected for their high analyte specificity with negligible cross-reactivity to other steroids, according to Certificate of Analysis of the kits. The R&D Parameter Immunoassay Control Set 791 for E2 (R&D Systems, QC87) was used for each of the ELISA plates that assayed for E2. Experimental media was diluted 10-fold with DMEM-CDS media prior to measuring E2. Progesterone was measured in undiluted samples.
Histology and immunohistochemistry analyses
KGN spheroids in gels were fixed in 10% neutral buffered formalin (Thermo Fisher Scientific, 427098) 24 h after self-assembly, or after 72 h of hormone production. The gels were embedded in paraffin, sectioned (5 µm), stained with hematoxylin and eosin (H&E), and scanned with the Olympus VS200 Slide Scanner (Olympus Life Science, Waltham, Massachusetts) for morphological analysis. The numbers of pyknotic nuclei were counted in H&E-stained slides and normalized to cross-sectional area to evaluate cell viability, and Student’s t test was used to examine the statistical difference between the mean normalized pyknotic nuclei number in control versus each of the treated groups. We did not evaluate cell viability biochemically using standard kits such as the LDH-Glo Cytotoxicity Assay (Promega) or the CellTiter-Glo 3D Cell Viability Assay (Promega), because the cell to media ratio of our 12-well plate assay is at least 50-fold lower than the vendor’s recommended ratio, rendering these kits not sensitive enough to examine to cell viability.
To examine the expression of CYP19 by immunostaining, sections were first deparaffinized and rehydrated. Rehydrated slides underwent an antigen retrieval step by incubating in 1× antigen retrieval buffer (Abcam, Cambridge, Massachusetts, ab93678) inside a vegetable steamer for 45 min. The slides were then incubated in a blocking solution containing PBS with 10% normal goat serum (Abcam, ab7481) in 1× Blocker bovine serum albumin (BSA) solution (Thermo Fisher, 37520) that contained 1% BSA in Tris-buffered saline (TBS) for 2 h at room temperature. Slides were incubated overnight at 4°C in primary antibody solution containing either the anti-CYP19 antibody (Abcam, ab18995; 1:100 dilution), anti-Cx43 (Abcam, ab11370; 1:100 dilution) or the isotype control (Abcam, ab171870; 1:100 dilution) diluted in Blocker BSA solution. Slides were rinsed 3 times with 0.025% Triton in TBS and then incubated at room temperature for 30 min in Alexa Fluor 488 goat antirabbit IgG secondary antibody (Abcam, ab150077; 1:2000 in Blocker BSA) secondary antibody. Slides stained with anti-CYP19 antibody were rinsed 3 times in TBS, counterstained with DAPI (4′,6-diamidino-2-phenylindole) Solution (Thermo Fisher, EN62248; 1:1000 in PBS) for 10 min for nuclei labeling and mounted using Prolong Diamond Antifade Mountant (Fisher Scientific, P36961). Slides stained with anti-Cx43 were rinsed 3 times in TBS, followed by 3 rinses with Hank’s balanced salt solution (HBSS) without phenol red (Fisher Scientific, MT21023CV), then was first counterstained with wheat germ agglutinin Texas Red-X conjugate (Fisher Scientific, W21405; 5 μg/ml) in HBSS for 10 min to reveal cell membrane, followed by 3 rinses with HBSS, and then counterstained with DAPI Solution for 10 min and mounted using Prolong Diamond Antifade Mountant. Immunostained slides were imaged with a confocal laser scanning microscope (Zeiss LSM 800). CYP19 and Cx43 staining intensity was quantified using ImageJ and the intensity was normalized by the cross-sectional area of the spheroid section.
At least 3 independent experiments were conducted for histological and immunohistochemical analyses, where the statistical analyses were performed with N of at least 3, and each observation was the mean of the replicates for each of the groups in 1 of the 3 experiments.
Statistical analysis
SAS 9.4 software was used for statistical analyses. Data are presented as mean ± SD. At least 3 independent experiments were conducted for each of the described experiments. All data were first examined for equal variance and for normality using the Shapiro-Wilk test. Student’s 2-sided t test or 1-way ANOVA with post hoc Tukey HSD test were used to evaluate the effects of different treatments on hormone biosynthesis and release. Statistical significance was set at p ≤ .05.
RESULTS
KGN Cells Formed Multilayer Spheroids That Expressed Gap Junction Protein Cx43 and CYP19 Aromatase Enzyme
To determine if KGN cells would form 3D spheroids, we seeded trypsinized cells onto micromolded agarose gels that had been equilibrated with culture media. In < 24 h, KGN cells self-assembled spheroids whose size could easily be controlled by varying the number of cells seeded (Figure 1). The histology of spheroids after 24 h self-assembly (Figure 2A) and after 72 h in media containing 10−7M testosterone (Figure 2B) showed that spheroids had a multicell layer structure similar to the avascular multicell granulosa layer in human ovarian follicles (Bahr, 2018; Baumgarten and Stocco, 2018; Fraser, 2006; Gougeon, 1986), and that the presence of pyknotic nuclei was minimal in KGN spheroids. Immunostaining showed that KGN spheroids also expressed robust Cx43 (Figure 2C), the main connexin found in GCs (Ackert et al., 2001; Gittens et al., 2003; Juneja et al., 1999; Kidder and Mhawi, 2002), and CYP19 (Figure 2D), the key enzyme for the synthesis of E2 from the precursor, testosterone.
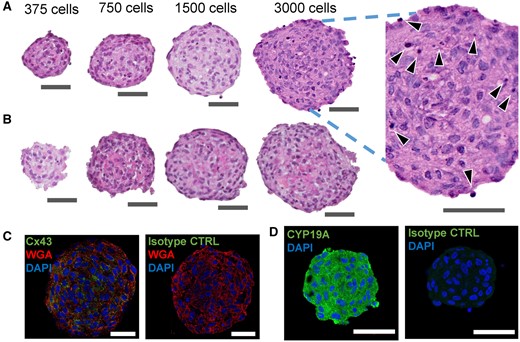
Human KGN cells formed stable 3D spheroids that expressed connexin 43 and CYP19 aromatase enzyme. Representative image of formalin-fixed, paraffin-embedded sections of KGN spheroids, stained with hematoxylin and eosin (A, B), immunostained for Cx43 (green) (C) or CYP19 enzyme (green) (D), isotype control for both anti-Cx43 and anti-CYP19 antibody (green) (C, D), cell membrane with wheat germ agglutin (WGA, red) (C), and nuclei with DAPI (blue) (C, D). KGN spheroids were fixed at 24 h postself-assembly (A, C, and D), or at 72 h after incubation in media containing 10−7M testosterone (B). Figure 2A includes an enlarged inset of a spheroid section with black arrows pointing at the pyknotic nuclei. Scale bar = 50 µm. Three independent experiments, n = 2–3 gels per experiment, each with 256 spheroids.
KGN Spheroids Synthesized and Secreted E2 and Progesterone
To determine if KGN spheroids synthesized E2, KGN spheroids were incubated for 72 h with or without testosterone and the levels of E2 in the culture media were measured by ELISA (Figure 3A). In the absence of testosterone, E2 levels were undetectable. When testosterone was added, KGN spheroids synthesized and secreted significant levels of E2. To demonstrate substrate specificity, we omitted testosterone and added the nonreactive testosterone analog, DHT. Levels of E2 were undetectable in the presence of DHT.
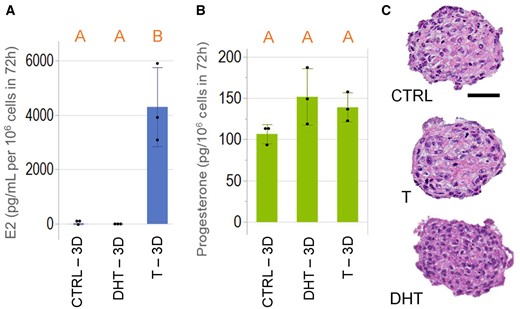
KGN spheroids synthesized and secreted estradiol and progesterone. KGN spheroids were incubated without or with the estradiol (E2) substrate, testosterone (T), or the nonreactive analog, 5α-dihydrotestosterone (DHT) for 72 h. Culture media was harvested and measured for levels of E2 and progesterone. Addition of testosterone-induced E2 synthesis, whereas in the absence of testosterone (CTRL) and in the presence of DHT, E2 was undetectable (A). Progesterone was detected in the media of KGN spheroids in CTRL, or in the presence of testosterone or DHT (B). Representative images of hematoxylin and eosin-stained sections of KGN spheroids showed no difference in the presence of pyknotic nuclei among all 3 groups (C). Scale bar = 50 µm. Data presented in mean ± SD overlayed with experimental values in dots. One-way ANOVA with Tukey’s HSD for multiple comparisons was performed to examine the statistical difference between CTRL, T, and DHT. Bars that do not share the same letters are significantly different (p value ≤ .05). Three independent experiments, n = 2–3 gels per experiment, each with 256 spheroids.
In the same culture media, we used an ELISA to measure levels of progesterone (Figure 3B). KGN spheroids synthesized progesterone were not statistically significant in the presence or absence of testosterone or DHT. This observation recapitulates the function of GCs in native ovarian tissue, where progesterone synthesis relies on cholesterol as a substrate and not testosterone (Bahr, 2018; Baumgarten and Stocco, 2018; Fraser, 2006). The numbers of pyknotic nuclei between testosterone, DHT, and the nontreated control groups did not differ (Figure 3C), which were 4.2 ± 1.1, 5.3 ± 2.6, and 5.4 ± 1.7 × 10⁻⁴ nuclei/µm2, respectively.
Synthesis of E2 and Progesterone Is Higher in 3D Spheroids Versus 2D Monolayers
Traditional in vitro models of cells cultured as 2D monolayers often fall short of recapitulating human tissue physiology and associated biochemical and functional outputs. To compare hormone synthesis between 2D and 3D, we cultured KGN cells as monolayers and spheroids and measured the levels of E2 and progesterone. To facilitate comparison between the 2 culture environments, values were normalized to cell number. KGN cells cultured as spheroids secreted significantly higher amounts of E2 (approximately 6-fold) and progesterone (approximately 3-fold) than KGN cells cultured in 2D (Figs. 4A and 4B).
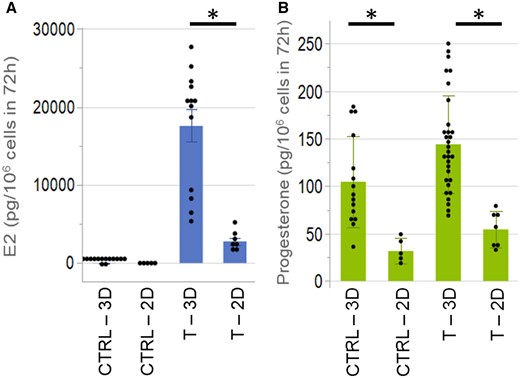
KGN cells in 3D synthesized higher amounts of estradiol and progesterone than 2D. KGN cells cultured as spheroids or 2D monolayers were incubated without (CTRL) or with testosterone (T) for 72 h. Estradiol (E2, A) and progesterone (B) levels were measured by ELISA and normalized to cell number. Levels of E2 and progesterone were significantly higher in spheroids versus 2D monolayers. Data presented in mean ± SD overlayed with experimental values in dots. Student’s t tests were used to examine the statistical difference between 3D and 2D in CTRL or T. p Value ≤ .05 is denoted by *. Three independent experiments, n = 2–3 gels per experiment, each with 256 spheroids.
Adsorption of E2 and Progesterone to the Agarose Gel Is Minimal
To examine whether hormones released by KGN spheroids were adsorbed onto the agarose gel, media from KGN spheroids in agarose molds that had synthesized hormones for 72 h in the presence of testosterone was harvested, and pooled. An equal volume of this media was added to 12-well plates with or without a new agarose gel (no spheroids) that had been equilibrated with serum-free DMEM. To compensate for the media in the gel, additional serum-free media was added to the wells without gels. Plates were incubated for another 72 h and E2 and progesterone levels were measured by ELISA. Our data show that the agarose gel did not adsorb significant amounts of E2 (Supplementary Figure 2A) or progesterone (Supplementary Figure 2B).
Synthesis of E2 and Progesterone Is Dependent on Spheroid Size
To maximize hormone synthesis, we examined the effect of spheroid size on E2 and progesterone production. Spheroids with approximately 750, 1500, and 3000 cells per spheroid were formed, incubated with testosterone for 72 h and the levels of E2 and progesterone were measured. Total E2 production decreased as spheroid size increased, whereas total progesterone production increased slightly (Figs. 5A and 5B). However, when hormone levels were normalized to either cell number or to cross-sectional area of the spheroids, E2 and progesterone production both decreased as spheroid size increased (Figs. 5A and 5B). The decline in E2 production as a function of size was more pronounced than progesterone production. Immunohistochemical staining visually showed that CYP19 expression declined with increasing spheroid size (Figure 5C). Student’s t test showed that smaller KGN spheroids (375 or 750 cells/spheroid) had greater normalized CYP19 expression by spheroid cross-sectional area than larger spheroids (1500 or 3000 cells/spheroid; Figure 5D).
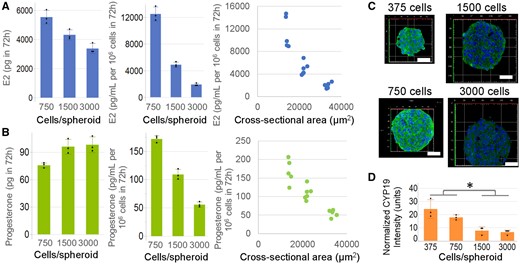
Steroidogenesis by KGN spheroids is size dependent. To examine whether spheroid size modulated hormone production, we formed KGN spheroids in 3 different sizes (approximately 750, approximately 1500, or approximately 3000 cells/spheroid) and incubated them in media with testosterone (T) for 72 h and measured levels of estradiol (E2, A) and progesterone (B) by ELISA. Total E2 production declined with increasing size, whereas total progesterone production increased slightly. When the same data were normalized to cell number or to cross-sectional area of the spheroids, E2 and progesterone declined with increasing size. Immunohistochemical staining of CYP19 aromatase enzyme of formalin-fixed, paraffin-embedded, and sectioned spheroids revealed that CYP19 expression declined with increasing spheroid size (C, D). Data presented in mean ± SD overlayed with experimental values in dots, or as dot plots of all data points. Student’s t test was used to examine the statistical difference between the normalized CYP19 expression in small (375 or 750 cells/spheroid) versus large (1500 or 3000 cells/spheroid) spheroids. p Value ≤ .05 is denoted by *. Three independent experiments, n = 2–3 gels per experiment, each with 256 spheroids.
E2 Synthesis Was Induced by FSH and cAMP
After binding to its receptor, FSH activates downstream signaling cascades, which includes the intracellular increase in cAMP (Nishi et al., 2001), and the subsequent upregulation of CYP19 gene expression (Bahr, 2018; Baumgarten and Stocco, 2018; Fraser, 2006). In the presence of testosterone, KGN spheroids were incubated with FSH or varying concentrations of cell permeable dibutyryl-cAMP for 72 h and levels of E2 and progesterone were measured. E2 production per cell was induced by FSH (Figure 6A), and by dibutyryl-cAMP (Figure 6B) in a dose-dependent manner. Dibutyryl-cAMP (Figure 6C), but not FSH (Figure 6D)-induced progesterone production. FSH treatment did not alter the degree of pyknotic nuclei in KGN spheroids (Figure 6E), where the numbers of pyknotic nuclei were 4.7 ± 1.9 and 5.0 ± 1.7 × 10⁻⁴ nuclei/µm2 for control versus FSH treatment, respectively. However, dibutyryl-cAMP treatments at 1 mM but not at other tested concentrations had significantly higher number of pyknotic nuclei than the nontreated control group (Figure 6F). The numbers of pyknotic nuclei were 2.6 ± 1.2, 3.2 ± 1.0, 3.1 ± 0.8, and 4.3 ± 1.8 × 10⁻⁴ nuclei/µm2 for the nontreated control, 0.25, 0.5, and 1.0 mM dibutyryl-cAMP, respectively.
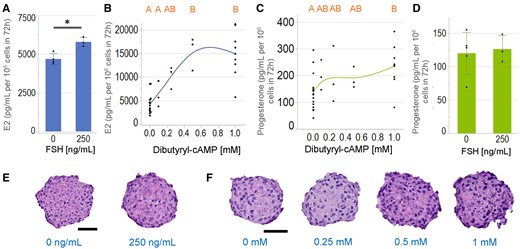
Estradiol (E2) production, but not progesterone is induced by follicle stimulating hormone (FSH), whereas both were induced by dibutyryl-cAMP. KGN spheroids were incubated in media with testosterone (T) in the absence or presence of FSH (250 ng/ml) or varying concentrations of dibutyryl-cAMP (0–1 mM) for 72 h and levels of E2 (A, B) and progesterone (C, D) were measured by ELISA. FSH significantly induced E2 (A), but not progesterone (D) production. Dibutyryl-cAMP induced a dose-dependent increase in E2 (B) and progesterone (C) production. Representative images of hematoxylin and eosin-stained sections of spheroids treated with FSH (E) or dibutyryl-cAMP (F) showed that FSH did not alter the presence of pyknotic nuclei, but dibutyryl-cAMP at 1 mM increased the number of pyknotic nuclei as compared to the control. Scale bar = 50 µm. Data presented in mean ± SD overlayed with experimental values in dots, or as dot plots of all data points. Student’s t tests were used to examine the statistical difference between FSH treatments. p Value < .05 is denoted by *. One-way ANOVA with Tukey’s HSD for multiple comparisons was performed to examine the effects of dibutyryl-cAMP. Bars that do not share the same letters are significantly different (p value ≤ .05). Three independent experiments, n = 2–3 gels per experiment, each with 256 spheroids.
Synthesis of E2, but Not Progesterone Is Inhibited by Letrozole
To determine if hormone synthesis was sensitive to agents that inhibit CYP19, we incubated KGN spheroids with varying concentrations of letrozole, a well-known CYP19 inhibitor (Brueggemeier et al., 2005), and measured levels of E2 and progesterone. E2 production was inhibited in a dose-dependent manner, but progesterone production, which is independent of CYP19, was unaffected (Figure 7). The half-maximal inhibitory concentration (IC50) of letrozole on E2 production was approximately 800 pM. Letrozole treatment at all tested dosages did not alter the degree of pyknotic nuclei in KGN spheroids (Figure 7C). The numbers of pyknotic nuclei were 8.4 ± 2.8, 7.7 ± 1.8, 7.4 ± 1.8, 6.6 ± 2.7, and 9.2 ± 2.7 × 10⁻⁴ nuclei/µm2 for the nontreated control, 0.1, 1.0, 10, and 100 nM letrozole, respectively.
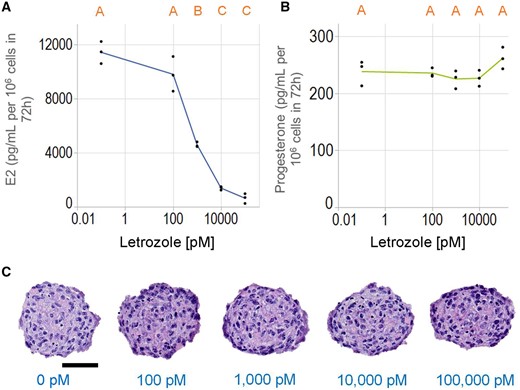
Letrozole inhibits estradiol, but not progesterone production. KGN spheroids were incubated in media with testosterone (T) in the absence or presence of varying concentrations of letrozole (0–100 000 pM) for 72 h. Letrozole-inhibited estradiol (A), but not progesterone (B) production in a dose-dependent manner. Representative images of hematoxylin and eosin-stained sections of spheroids treated with different concentrations of letrozole showed no difference in the presence of pyknotic nuclei (C). Scale bar = 50 µm. Data presented as dot plot of all data points, and x-axis in log10 scale. One-way ANOVA with Tukey’s HSD for multiple comparisons was performed to examine the effects of Letrozole. Bars that do not share the same letters are significantly different (p value ≤ .05). Three independent experiments, n = 2–3 gels per experiment, each with 256 spheroids.
BPA and Genistein-Induced E2 Production by KGN Spheroid at High Dosage
To examine if E2 synthesis by KGN spheroids is modulated by chemicals that are present in our environment, we incubated KGN spheroids with varying concentrations of BPA or genistein, and measured levels of E2. E2 production was induced by BPA and genistein only at the highest dosages tested (Figs. 8A and 8B). BPA treatments at all tested dosages did not alter the degree of pyknotic nuclei in KGN spheroids (Figure 8C), where the numbers of pyknotic nuclei were 8.3 ± 2.9, 8.0 ± 3.1, 7.0 ± 1.8, 7.5 ± 2.4, 7.2 ± 3.1, and 5.3 ± 2.3 × 10⁻⁴ nuclei/µm2 for the nontreated control, 0.01, 0.1, 1.0, 10, and 100 µM BPA, respectively. Genistein at 100 µM but not at other tested concentrations had greater number of pyknotic nuclei than in the control (Figure 8D), where the numbers of pyknotic nuclei were 6.4 ± 1.4, 5.8 ± 2.0, 6.5 ± 2.0, 7.2 ± 2.9, and 10.2 ± 2.9 × 10⁻⁴ nuclei/µm2 for the nontreated control, 0.1, 1.0, 10, and 100 µM genistein, respectively.
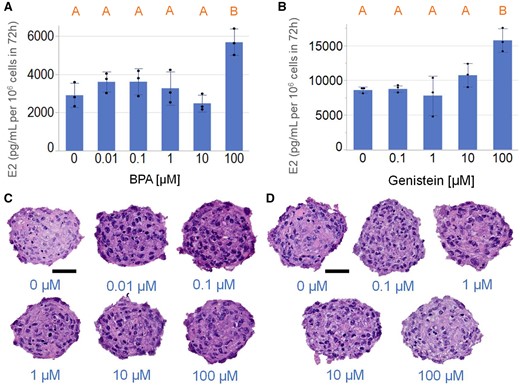
Bisphenol A (BPA) and genistein-induced estradiol (E2) production by KGN spheroid at high dosage. KGN spheroids were incubated in media with testosterone (T) in the absence or presence of varying concentrations of BPA (0–100 µM) or genistein (0–100 µM) for 72 h. BPA (A) and genistein (B) induced KGN spheroid E2 production only at 100 µM concentration. Representative images of hematoxylin and eosin-stained sections of spheroids treated with different concentrations of BPA or genistein showed no difference in the presence of pyknotic nuclei except for genistein at 100 µM, where the genistein treated group had greater number of pyknotic nuclei than the nontreated control (C, D). Scale bar = 50 µm. Data presented in mean ± SD overlayed with experimental values in dots. One-way ANOVA with Tukey’s HSD for multiple comparisons was performed to examine the statistical difference between concentrations. Bars that do not share the same letters are significantly different (p value ≤ .05). Three independent experiments, n = 2–3 gels per experiment, each with 256 spheroids.
Gap Junction-Mediated Diffusion of Calcein Is Inhibited by CBX
To evaluate GJIC, KGN cells that had been uniformly labeled with CellTracker Green CMFDA (CTG), were seeded into a 96-well plate to form spheroids (4 per well). Similar to the data from our previously published work using CalceinAM (Achilli et al., 2014; Leary et al., 2016), it took approximately 80 min for calceinRO fluorescence to diffuse into the core via gap junctions (Figure 9). Treatment with CBX (100 µM) a gap junction inhibitor, for 5 h inhibited calceinRO diffusion into the spheroid core at all time points (Figure 9). In very large spheroids, CBX treatment altered spheroid morphology (Supplementary Figure 3), but had no effects on the expression of Cx43 (Supplementary Figure 4) or CYP19 (Supplementary Figure 5).
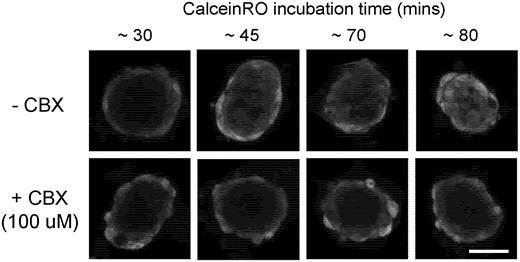
Gap junction-mediated diffusion of calcein is inhibited by carbenoxolone. Self-assembled KGN spheroids were incubated with the gap junction inhibitor carbenoxolone (CBX) or its vehicle control for 5 h prior to the addition of 2.5 µM of calceinRO. Confocal z-stacks of spheroids were acquired at 30, 45, 70, and 80 min after the addition of calceinRO. To quantify CBX inhibition of gap junction intercellular communication, the equatorial image at 80 min were taken for further analysis by automated batch processing. Representative equatorial images of calceinRO fluorescence (561 nm) were rendered for spheroids. Scale = 50 µm.
To increase the throughput of image analysis, we developed an open-source automated batch processing method to quantify the z-stacks of fluorescent images. Data were analyzed in parallel on the Brown University’s supercomputer. Within 1 h and with minimal human bias, the automated method detected all 384 spheroids in a 96-well plate, identified the images of the southern hemisphere and computed the ratio of fluorescence (calceinRO/CTG) of 5 µm concentric shells of the southern hemisphere from each spheroid’s outer surface to its inner core. The data from this analysis, as applied to approximately 80 spheroids per dose, show CBX appeared to inhibit GJIC of KGN cells in a dose-dependent manner, with the maximum inhibition concentration of 50 µM (Figure 10).
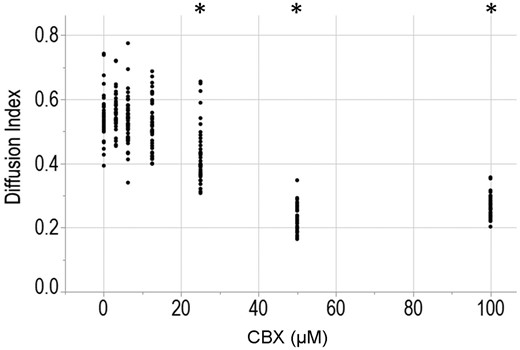
Automated batch processing of confocal images speeds analysis and removes bias. KGN spheroids that had been uniformly labeled with 5 µM CellTracker Green CMFDA (CTG) were incubated the gap junction inhibitor carbenoxolone (CBX) at dosages of 0, 3.125, 6.25, 12.5, 25, 50, or 100 µM for 5 h prior to the addition of 2.5 µM calceinRO. Confocal z-stacks of spheroids were acquired with the Perkin Elmer Opera Phenix at 80 min after the addition of calceinRO using the 20× water objective in conjunction with 2 excitation lasers: 488 nm for CTG and 561 nm for calceinRO, in 5 µm step size for a total of 375 µm. Confocal z-stacks of each spheroid were analyzed with our automated batch processing method and the “Diffusion Index” was quantified, where higher the Diffusion Index equates to greater calceinRO diffusion from the spheroid outer rim into the inner core (see method for equation). Data presented as dot plot of all data points. Three independent experiments, with a total of 663 spheroids analyzed and approximately 80 spheroids per dose of CBX. Student’s t test was used to examine the statistical difference between the diffusion index of each of the CBX doses with the no CBX control. p Value ≤ .05 is denoted by *. Three independent experiments, n = 25–30 spheroids per experiment.
DISCUSSION
Due to the expense and limitations of animal testing, new in vitro models based on cultured cells are needed to screen for the potential toxicities of emerging drugs and chemicals of commerce (Cote et al., 2016; ICCVAM, 2018). Although in vitro models can never mimic the full human response, the strategy has been to develop models based on human cells that mimic the most important physiological functions and to use quantitative assays to measure perturbations of these functions. This study showed that KGN cells rapidly form 3D spheroids whose structure mimicked the avascular multicell layer of GCs surrounding the oocyte. KGN spheroids synthesize high levels of E2 and perform GJIC, 2 physiological functions critical for fertility. KGN spheroids expressed CYP19 aromatase and synthesized estradiol at levels approximately 8-fold higher than cells in 2D. Similar to in vivo, E2 synthesis was testosterone dependent, induced by FSH or cAMP and inhibited by letrozole in a dose-dependent manner. KGN spheroids also expressed Cx43 and formed functional gap junctions that were inhibited by CBX in a dose-dependent manner. These data demonstrate the physiological relevance of a model based on a 3D multicellular microtissue.
The 3D structure of KGN spheroids upregulated E2 synthesis. The laboratory that established KGN cells documented that KGN cells cultured as 2D monolayers synthesize E2 at 171 pg/106 cells in 72 h. Our results in 2D are higher than this report (2773 pg/106 cells in 72 h), but these levels are nearly 6- to 85-fold lower than the average E2 produced by primary human GCs in the presence of 10−7 M of testosterone (15 000 pg/106 cells in 72 h; Schipper et al., 1993). In our study, when KGN cells were cultured as 3D spheroids, E2 synthesis increased 6.3-fold to 17 595 pg/106 cells in 72 h, which is comparable to primary human GCs. E2 synthesis by KGN spheroids was stimulated by both FSH and the intracellular downstream signaling molecule dibutyryl-cAMP that is induced after cell surface FSH receptors have been activated (Parakh et al., 2006). The induction by the cell-permeant dibutyryl-cAMP was dose dependent and was more robust than FSH, potentially due to limited access to cell surface FSH receptors in a 3D microtissue versus a 2D monolayer. Furthermore, we showed that the CYP19 inhibitor letrozole dose-dependently inhibited E2 production by KGN spheroids, with an IC50 of approximately 800 pM. This is lower than values observed in KGN cells cultured in 2D (10 nM; Solak et al. 2014), suggesting that KGN cells cultured in 3D instead of 2D may increase cell sensitization to aromatase inhibitors.
Our KGN 3D spheroids increased progesterone synthesis as compared with 2D. However, the progesterone produced by KGN spheroids was at levels similar to previous published work by other laboratories that cultured KGN cells in 2D (approximatley 260 pg/106 cells; Nishi et al., 2001), and was significantly less than cultured luteinized human GCs collected from IVFs procedures (approximatley 3 500 000 pg/106 cells in 72 h; Dain et al., 1991; Whitehead et al., 2002; Yung et al., 2014). Whether the KGN cells became more luteinized when cultured in 3D than in 2D remains to be explored.
Interestingly the level of E2 and progesterone synthesis by KGN spheroids was influenced by spheroid size. E2 and progesterone synthesis normalized to number of cells declined by about 120% and 30% from 750 to 1500 cells/spheroid, respectively. Our data suggested that CYP19 expression, nutrient and diffusion limitations may affect cell function. This association between spheroid size and hormone production can potentially increase the interassay variability due to the large number of spheroids (256×) per agarose mold in the 12-well plate. Nevertheless, we expect that this variability can be minimized when using our 96-well high-throughput platform, with only 4 spheroids per well.
We utilized our 3D human granulosa screening platform to examine the potential impact of BPA and genistein on E2 production. BPA is a toxicant found in human serum and follicular fluid and linked to fertility problems (Björvang and Damdimopoulou, 2020; Ikezuki et al., 2002; Patel et al., 2015). Increasing BPA concentration (0–100 µM) was previously shown to modulate Cyp19 expression and E2 production in a bell-shaped manner in both KGNs and IVF GCs cultured in 2D (Kwintkiewicz et al., 2010). E2 production by KGN spheroids had a similar, but more subdued curve for BPA, except at the highest nonphysiologically relevant dose suggesting that KGNs spheroids maybe less sensitive to BPA effects than GCs cultured in 2D.
Phytoestrogens including genistein that are present in our diets have been shown to inhibit steroidogenic enzymes (Lacey et al., 2005; Whitehead et al., 2002). Genistein at 50 µM reduced E2 production in luteinized human IVF GCs (Lacey et al., 2005; Whitehead et al., 2002), but not in nonluteinized GCs from porcine preovulatory follicles (Nynca and Ciereszko 2006). Our results showed that genistein (0–50 µM) did not alter E2 production in KGN spheroids. It is plausible that KGN cells, which are significantly less luteinized than IVF human GCs as judged by progesterone production, are less sensitive to effects of genistein on E2 production.
Histology of the KGN spheroids showed that the cells formed a multicell-layered microtissue that mimics the avascular, multiple GC layer structure in developing follicles in vivo (Bahr, 2018; Baumgarten and Stocco, 2018; Fraser, 2006), with its oxygen and nutrient limitations. This 3D architecture was stable with no obvious signs of a necrotic core in the spheroid center, as indicated by the absence of empty space. Histological examination of the human ovary reveals the dynamic changes in the thickness of GC layers during follicle development (Gougeon, 1986), from the preantral (0.1 mm) with approximately 600 GCs lining thinly around the interior wall of the ovarian follicle and the oocyte, to the ovulatory stage (20 mm) with a thick 10–12 cell layer of approximately 60 million GCs. By varying the number of cells seeded, we could make KGN spheroids that varied in diameter from approximately 50–350 μm with about 4 and 10 cell layers, respectively.
The 3D structure of KGN spheroids also mimics the dense 3D cell-to-cell contacts and complex cellular interactions of the in vivo tissue including GJIC. GJIC is critical to ovarian function and controls the diffusion of cGMP whose levels control meiotic arrest of the oocyte (Shuhaibar et al., 2015). In this article, we adapted the spheroid model to 96-well plates and developed a high-throughput assay to measure GJIC within living spheroids by quantifying the transfer of a fluorescent dye. Our high-throughput confocal microscope rapidly acquires confocal z-stacks (2 channels, 75 images/channel, and 4 spheroids/well) for an entire 96-well plate, and we have previously established an imaging method to accurately quantify fluorescent signal of 3D spheroids despite the challenges of fluorescent signal loss deeper into the z-depth of the spheroid (Leary et al. 2016, 2018). We further developed an automated image analysis pipeline for the rapid processing of confocal images that is essential for the high-throughput screening of chemicals. This pipeline identified the images of the southern hemisphere of each spheroid and quantified the fluorescent signals of 5 µm conformal shells from the outer surface to the inner core of the spheroid. The pipeline removes bias and was used to show the dose-dependent inhibition of GJIC by CBX, a well-known inhibitor of gap junctions.
The KGN spheroid model mimics the avascular multicell layer structure of the granulosa and can be used to measure chemical perturbations of 2 of its most important physiological functions, E2 synthesis, and GJIC. Thus, KGN spheroids may offer an alternative testing platform to examine the potential impacts of environmental contaminants on female reproductive health in the context of the biology or biochemistry of the human granulosa. The U.S. Environmental Protection Agency currently uses 2 different assays to screen for disruptors of E2 synthesis. The microsome assay utilizing an extract of microsomes (United States Environmental Protection Agency, Prevention, Pesticides, and Toxic Substances, 2009) is limited to detecting chemicals that target aromatase and so is unable to detect other cellular targets that can disrupt E2 synthesis. The second cell-based assay uses H295R cells (OECD, 2011; United States Environmental Protection Agency, Prevention, Pesticides, and Toxic Substances, 2011), which express multiple pathways of steroidogenesis leading to the production of corticosteroids, mineralocorticoids, androgens, and estrogens that are not found in single normal tissue (Hecker et al., 2006). Thus, the abnormally complex steroidogenic functions of the H295R cells and the interdependencies of these pathways may not accurately reveal the effects of a test chemical on E2 synthesis, especially in the context of reproductive health. Currently, there are no approved tests for disruption of GJIC despite its critical role in ovarian function and fertility. We envision our 3D human granulosa screening platform that incorporates both the ovarian GJIC function and hormone production can elevate the predictive capacity and efficiency to screen for chemicals that contaminate follicular fluid and may affect fertility.
SUPPLEMENTARY DATA
Supplementary data are available at Toxicological Sciences online.
ACKNOWLEDGMENTS
We thank Prof. Kim Boekelheide for his insightful discussion and advice for histological evaluations. We also thank the Brown University Molecular Pathology Core and the Leduc Bioimaging Facility for their support.
FUNDING
A Bioengineering Research Partnership grant (U01 ES028184) from the National Institute of Environmental Health Sciences and a generous gift from Donna McGraw Weiss ‘89 and Jason Weiss.
DECLARATION OF CONFLICTING INTERESTS
J.R.M. has an equity interest in Microtissues, Inc. This relationship has been reviewed and is managed by Brown University in accordance with its conflict of interest policies.
REFERENCES
ICCVAM. (
OECD. (
United States Environmental Protection Agency, Prevention, Pesticides, and Toxic Substances. (
United States Environmental Protection Agency, Prevention, Pesticides, and Toxic Substances. (

Comments