


Abstract
Regulators of biotransformation are of particular interest in pharmacology and toxicology, determining in part the metabolism, disposition, and toxicity of chemicals. The nuclear receptor NR1I2 (pregnane X receptor, PXR) is a prominent xenosensor that regulates the expression of biotransformation enzymes governing elimination of many exogenous as well as endogenous compounds. Zebrafish (Danio rerio) has only one gene locus for pxr, but different genetic variants have been identified in zebrafish. However, the prevalence and significance of these variants are unknown. We hypothesize that sequence variation occurring in the Pxr gene of zebrafish may affect the action and fate of many chemicals in this species, a key model organism in various fields of research, including environmental toxicology. Here, we examine variation in Pxr sequences from four different strains of zebrafish and assess the responses of each Pxr to clotrimazole and butyl-4-aminobenzoate. The Pxr variants differed in both their ability to bind these structurally different ligands and to regulate reporter gene expression in vitro. We infer that the observed sequence variations in zebrafish Pxrs likely affect the response to putative Pxr agonists in vivo and potentially cause strain-specific biotransformation of xenobiotics in zebrafish. Thus, the choice of zebrafish strain could affect the outcome of downstream toxicological studies.
Regulators of xenobiotic biotransformation are of particular importance in pharmacology and toxicology because there is a strong relationship between the metabolism and disposition of chemicals and their toxicity. The pregnane X receptor (PXR; nuclear receptor 1I2, NR1I2), also known as steroid and xenobiotic receptor (SXR), is a ligand-modulated transcription factor with exceptionally broad ligand-specificity and a high number of target genes involved in xenobiotic metabolism (Orans et al., 2005; Rosenfeld et al., 2003). Thus, PXR is a key regulator of the biotransformation of both endogenous and exogenous compounds.
Zebrafish (Danio rerio) is a model organism that is widely used in genetics, developmental biology, medicine, pharmacology, and toxicology (reviewed in [Alestrom et al., 2006; Carvan et al., 2007; Dai et al., 2014; Kamstra et al., 2014; Lieschke and Currie, 2007; Quaife et al., 2012; Stegeman et al., 2010; Walogorsky et al., 2012]). Its widespread use is due in part to a well-studied and annotated genome, rapid development, short life cycle, and ease of genetic manipulation. In the field of toxicology, the nature of the chemical defensome and attendant adverse effect mechanisms are still being described on a molecular level in zebrafish (Stegeman et al., 2010).
Treatment of adult zebrafish with the mammalian PXR agonists clotrimazole and pregnenolone-16α-carbonitrile resulted in induction of defensome genes including cyp3a and mdr1, and pxr itself (BresoLin et al., 2005), suggesting similarities in PXR response pathways in zebrafish and mammals. We recently described the sequencing and functional characterization of zebrafish Pxr (Bainy et al., 2013), including regulatory targeting and a crosstalk between Pxr and the aryl hydrocarbon receptor (Kubota et al., 2015). A key finding was a high degree of allelic variation in Pxr sequences. Whether functional differences in Pxr occur between zebrafish strains is so far unknown.
Allelic variation is also known in mammals. Numerous polymorphisms, both in coding or non-coding regions, have been reported for human PXR (NCBI_dsSNP, 2017). Polymorphisms have been shown to affect the levels of PXR expression, the regulation of the PXR target gene CYP3A4, as well as rates of drug clearance (Lamba et al., 2008; Siccardi et al., 2008; Swart et al., 2012; Zhang et al., 2001). Single nucleotide polymorphisms (SNPs) have also been found in PXR of other species, including mice and pigs. In zebrafish, two allelic variants of pxr, denoted pxr*1 and pxr*2, were described in the Tupfel long fin (TL) strain, and were distinguished by differences in the amino acids at positions 184, 218, and 385 (Bainy et al., 2013).
Functional differences among Pxr variants in zebrafish could have important implications for the use of zebrafish as a model species in toxicology and risk assessment. In this study, we determined whether sequence variation in pxr from four strains of zebrafish could affect functional and structural properties of the translated protein. The strains examined were three commonly used laboratory strains, AB/Tübingen (AB/Tü), Tupfel long fin (TL), and Singapore wild type (SWT), as well as a strain of unknown origin (hereafter denoted UNK). We have studied ligand activation of the zebrafish Pxr variants and ligand-receptor interactions, using a luciferase reporter gene assay and surface plasmon resonance (SPR), respectively. In silico modeling of the different zebrafish Pxr variants was performed to unveil possible differences in the nuclear receptor structures that may have impacts on ligand-binding and receptor activation.
MATERIALS AND METHODS
Strains of zebrafish
Three commonly used strains of zebrafish were used in this study, including a hybrid of the Tübingen and AB strains (AB/Tü), the Singapore wild type (SWT), the Tupfel long fin (TL), as well as zebrafish of unknown strain (UNK), obtained from a pet shop in California.
Cloning of pxr from zebrafish
The cloning of zebrafish pxr from zebrafish of the Tupfel strain and from the unknown strain have previously been described elsewhere (Bainy et al., 2013; Milnes et al., 2008). Here we cloned pxr from the AB/Tü and SWT strains. Briefly, pxr was amplified from zebrafish liver total RNA in three-independent reactions. Subsequently, amplicons were subcloned and sequenced. For details on the cloning see Supplementary. The strain-specific sequences represent different alleles of pxr, which we designate pxr, allelic variant 3 through 5 (pxr*3, pxr*4, pxr*5; formally nr1i2*3, nr1i2*4, and nr1i2*3) ( Supplementary Figure 1). The zebrafish pxr sequences used or mentioned in this study were deposited in NCBI GenBank with the following accession numbers: MH879145 (pxr*1/pxrTL), MH879142 (pxr*2), MH879143 (pxr*3/pxrSWT), MH879143 (pxr*4/pxrAB/Tu), and MH879146 (pxr*5/pxrUNK).
We note that the current zebrafish nomenclature scheme does not have guidelines for naturally occurring alleles (ZFIN-Community, 2013). Hence, the allele nomenclature proposed here follows that of the HUGO Gene Nomenclature Committee (Antonarakis, 1998; den Dunnen and Antonarakis, 2000,, 2001; Gray et al., 2013), and is in accordance with the scheme currently in use for CYP alleles (Sim and Ingelman-Sundberg, 2013) and other genes with naturally occurring wild-type alleles (Nebert, 2002).
In vitro ligand activation of zebrafish Pxr variants
In vitro ligand activation of four zebrafish Pxr variants was measured in COS7 cells using a GAL4-DBD/GAL4-UAS-based luciferase reporter gene assay essentially as previously described in Bainy et al. (2013) and Lille-Langøy et al. (2015). Two test compounds were used, clotrimazole (CLO, 0.04–4.5 μM) and butyl-4-aminobenzoate (4BAB, 0.14–50 μM). Details on in vitro ligand activation assays can be found in Supplementary.
Analysis of receptor-ligand interactions
The hinge region and ligand-binding domain of the different zebrafish Pxr variants (amino acids 111–430/431) were recombinantly expressed in Escherichia coli BL21 as N-terminally 6Xhistidine tagged fusion-proteins with maltose-binding protein (MBP; pETM-41). His-tagged MBP-proteins were first purified by immobilized metal ion affinity chromatography (5 ml HisTrap HP, GE Healthcare) followed by size exclusion chromatography (Sephadex 75 16/60, GE Healthcare) to near homogeneity. Receptor-ligand interactions were analyzed by SPR (BIACORE T-200; CM5 chip; GE Healthcare) to establish kinetic constants and binding strengths. Single and multi cycle kinetic analyses were performed with CLO and 4BAB in concentrations ranging from 0 to 50 μM. Further details on recombinant protein expression and SPR can be found in Supplementary.
Sequence alignments, phylogeny, amino acid identity analysis, and functional prediction of amino acid substitutions
Sequence alignments were conducted in Clustal Omega (Sievers et al., 2011) and visualized using Jalview (Waterhouse et al., 2009). Amino acid identity analysis was performed using the “Sequence identity and similarity” (SIAS) resource (Reche, 2008a). Functional predictions of substitutions were performed using Sorting Intolerant from Tolerant (SIFT) (Kumar et al., 2009; Sim et al., 2012) and PolyPhen2 v2.2.2r398 (Adzhubei et al., 2010, 2013). Phylogenetic trees were constructed by analyzing cDNA sequences under maximum parsimony using MEGA5 (Tamura et al., 2013).
Modeling and ligand affinity
Homology models of the ligand binding domain of zebrafish Pxr were constructed using Modeller (v9.12; [Webb and Sali, 2014]) based on crystal structures of human PXR (PDB: 1M13 [Watkins et al., 2003], 2O9I [Xue et al., 2007], 3CTB [Wang et al., 2008], 4J5W [Wallace et al., 2013]). Computational solvent mapping of small molecule fragments was performed using the FTMap server (Brenke et al., 2009), and visualized with Pymol. Ligand docking was performed to protein ensembles using Autodock Vina (Trott and Olson, 2010), and Glide (Friesner et al., 2004; Halgren et al., 2004).
RESULTS
Sequence Analysis of Zebrafish Pxr Variants
The Pxr sequence identities were very high, and 94%–98% of the amino acids were positionally conserved among the zebrafish Pxr variants (Table 1). As expected, the intra-species conservation of zebrafish Pxrs was significantly greater than between the zebrafish Pxrs and the human PXR (44%–46%). Notably, the conservation of Pxrs across fish species was poor (51%, as illustrated for medaka [Oryzias latipes] in Table 1), only slightly greater than between zebrafish and human PXRs.
Amino Acid Identity Analyses of PXRs/Pxrs From Selected Organisms
| Ortholog/Variant | Human PXR | Medaka Pxr | Zebrafish Pxr | ||||||
|---|---|---|---|---|---|---|---|---|---|
| TL | AB/Tü | SWT | UNK | ||||||
| Amino acids | 107–434 | 87–414 | 111–430 | 111–431 | 111–431 | 111–431 | |||
| Human PXR | 1–434 | – | 40.9% | 46.6% | 46.5% | 46.5% | 46.5% | Hinge and ligand binding domain | |
| Medaka Pxr | 1–414 | 44.1% | – | 51.2% | 50.2% | 50.5% | 51.2% | ||
| Zebrafish Pxr | |||||||||
| TL | 1–430 | 47.7% | 52.6% | – | 96.7% | 97.0% | 98.6% | ||
| AB/Tü | 1–431 | 47.6% | 52.1% | 97.6% | – | 97.0% | 95.3% | ||
| SWT | 1–431 | 47.6% | 52.5% | 97.8% | 98.4% | – | 96.0% | ||
| UNK | 1–431 | N/A | N/A | N/A | N/A | N/A | – | ||
| Full-length | |||||||||
Identical amino acids in PXR/Pxrs were identified from a multiple sequence alignment (Clustal Omega). The amino acid identity analysis was performed using the SIAL tool and accounted for sequence gaps (Reche, 2008a).
UniProt accession numbers for sequences used in sequence comparisons and alignments were: human PXR (O75469), medaka Pxr (H2MUK7), zebrafish PxrTL (MH879145), zebrafish PxrSWT (MH879143), zebrafish Pxr AB/Tu (MH879143), and zebrafish PxrUNK (MH879146).
Abbreviations: AB/Tü, AB/Tübingen; SWT, Singapore wild type; TL, Tupfel long fin; UNK, unknown origin.
When comparing the sequences of the zebrafish Pxr variants from AB/Tü, SWT, and TL, we found that the DNA-binding domains (1–110) were identical. However, two indels occur in the hinge region and in the ligand-binding domain (Figure 1), and as a result the zebrafish Pxr variants vary in length (PxrAB and PxrTL: 430 AAs, PxrAB/Tü, and PxrSWT: 431 AAs). To overcome potential problems in numbering of the Pxr sequences, a consensus sequence of zebrafish Pxr (PxrCON) was constructed by combining the four individual sequences and PxrCON consisted of 432 amino acids. In the following, references to amino acid positions are based on the PxrCON numbering.
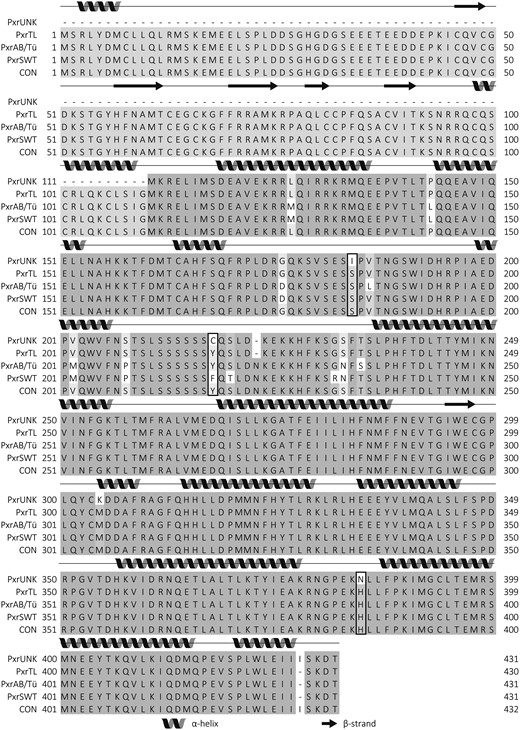
Multiple sequence alignment of Pxr from four strains of zebrafish. Protein sequences were aligned using Clustal Omega (Sievers et al., 2011) and visualized in Jalview (Waterhouse et al., 2009b). Darker scale of gray indicates higher degree of amino acid identity. Secondary structures were predicted using hidden neural networks (YAPIN (Lin et al., 2005) and were indicated by spirals (α-helices) and arrows (β-strands). Amino acid positions characteristic for the PxrTL/Pxr∗1 or Pxr*2 variants as described by Bainy et al. (2013) have been boxed. To assure a unique number for all amino acids in the variants, we constructed a zfPxr consensus sequence (CON) that included all amino acids of the alignment in which two gaps were introduced due to two indels in the sequences. The resulting CON had two amino acids more than any of the individual zfPxr variants (432 vs 430).
The two allelic variants of pxr denoted pxr*1 and pxr*2 previously described in TL strain zebrafish (Bainy et al., 2013) are characterized in part by substitutions of amino acids in positions 184, 218, and 385. The strain-specific sequences described in this paper represent different alleles of pxr, which we designate pxr allelic variant 3 through 5 (pxr*3, pxr*4, pxr*5; formally nr1i2*3, nr1i2*4, and nr1i2*5 [Supplementary Figure 1]). Of the variants from this study, PxrTL is Pxr*1 from (Bainy et al., 2013), PxrSWT is Pxr*3, PxrAB/Tü is Pxr*4, and PxrUNK is Pxr*5 used in Milnes et al. (2008) (Supplementary Figure 1). Both PxrTL and PxrAB/Tü are characterized by the same amino acid triad (S184, Y218, and H385), whereas PxrUNK is similar to Pxr*2 (I184, C218, and N385). PxrSWT possess two of three amino acids that correspond to Pxr*1, but a phenylalanine occupies position 218, in contrast to the tyrosine found in the Pxr*1 allelic variant (Table 2, Figure 1).
Amino Acids in Variable Positions of Allelic Variants of Zebrafish Pxr
| Position* | PxrTL (Pxr*1) | Pxr*2 | PxrSWT (Pxr*3) | PxrAB/Tü (Pxr*4) | PxrUNK (Pxr*5) |
|---|---|---|---|---|---|
| 127 | Leu (L) | Leu (L) | Met (M) | Met (M) | Leu (L) |
| 143 | Pro (P) | Pro (P) | Leu (L) | Leu (L) | Pro (P) |
| 176 | Gly (G) | Gly (G) | Asp (D) | Asp (D) | Gly (G) |
| 184 | Ser (S) | Ile (I) | Ser (S) | Ser (S) | Ile (I) |
| 186 | Val (V) | Val (V) | Val (V) | Leu (L) | Val (V) |
| 202 | Val (V) | Val (V) | Met (M) | Met (M) | Val (V) |
| 208 | Ser (S) | Ser (S) | Pro (P) | Pro (P) | Ser (S) |
| 218 | Tyr (Y) | Cys (C) | Phe (F) | Tyr (Y) | Cys (C) |
| 220 | Ser (S) | Ser (S) | Thr (T) | Ser (S) | Ser (S) |
| 223 | — | — | Asn (N) | Asn (N) | — |
| 232 | Gly (G) | Gly (G) | Arg (R) | Gly (G) | Gly (G) |
| 233 | Ser (S) | Ser (S) | Asn (N) | Asn (N) | Ser (S) |
| 235 | Thr (T) | Thr (T) | Thr (T) | Ser (S) | Thr (T) |
| 300 | Leu (L) | Pro (P) | Leu (L) | Leu (L) | Leu (L) |
| 305 | Met (M) | Met (M) | Met (M) | Met (M) | Lys (K) |
| 385 | His (H) | Asn (N) | His (H) | His (H) | Asn (N) |
| 428 | — | — | — | — | Ile (I) |
| References | Bainy et al. (2013) | Bainy et al. (2013) | Milnes et al. (2008) |
Positions have been numbered from a consensus sequence (CON) constructed from the four different variants.
We found a total of 16 positions in which the amino acids differed among the four zebrafish Pxr variants. PxrAB/Tü and PxrUNK were the most divergent, with different amino acids in 14 of 16 variable positions. PxrTL and PxrUNK were most similar and differed in only five positions (Table 2). PxrUNK (Pxr*5) is most similar to Pxr*2 previously described in Bainy et al. (2013).
Ligand Activation of Pxr Variants in Zebrafish
A luciferase reporter gene assay was used to investigate for functional implications of sequence variation between zebrafish Pxr variants. For this, two putative zebrafish Pxr in vitro agonists were used, a local anesthetic (4BAB) and an antifungal drug (CLO). Immunoblotting using anti-GAL4 antibodies demonstrated that the levels of the zfPxr variants were similar in the COS7 cells (Supplementary Figure 6). CLO increased luciferase activities by approximately 23–34 million RLUs in cells expressing PxrAB/Tü, PxrTL, and PxrSWT, whereas Rmax in cells expressing PxrUNK was approximately 1.8 million RLUs (Figure 2A, Tables 3 and 4). Butyl-4-aminobenzoate induced a moderate increase in the luciferase activities in cells expressing PxrAB/Tü, PxrTL, or PxrSWT (ΔRLUs in the range of 2.8–6.3 million), whereas luciferase activity in cells expressing PxrUNK did not increase (Figure 2B, Tables 3 and 4).
Dose-Response Dynamics for Activation of Allelic Variants of Zebrafish Pxr by CLO and 4BAB and Ligand-Receptor Interaction
| Zebrafish Pxr Variant | Clotrimazole (CLO) | Butyl 4-Aminobenzoate (4BAB) | |||
|---|---|---|---|---|---|
| Rmax (e6 ΔRLU±SD) | EC50 (e−7 M) | Dissociation Constant (Kd) (μM) | Rmax (e6 ΔRLU±SD) | EC50 (e−5 M) | |
| PxrAB/Tü | 22.6 ± 0.28 (b, c, d, *) | 1.42 (b, c, d, *) | 0.04 | 2.75 ± 1.65 (c, *) | 0.96 (b, c, *) |
| PxrTL | 34.0 ± 5.75 (a, d, *) | 1.08 (d, *) | 4.1 | 4.57 ± 2.41 (*) | 1.16 (a, *) |
| PxrSWT | 28.5 ± 6.80 (a, d, *) | 1.28 (a, *) | 260 | 6.31 ± 2.86 (a, *) | 1.18 (a, *) |
| PxrUNK | 1.81 ± 0.67 (a, b, c) | 3.48 (a, b) | 180 | N/D | N/D |
Maximum response (Rmax) and effective concentration 50 (EC50) of Pxr-mediated induction of luciferase activities in COS7 cells calculated from dose-response curves fitted by nonlinear regression (GraphPad Prism 7.0). Dissociation constants were determined from experimental data from surface plasmon resonance. Statistical significance differences of Rmax or EC50 were tested with Students t test (p < .05). Letter indicators signify more than 95% probability for difference of Rmax or EC50 for response via PxrAB/Tü (a), PxrTL (b), PxrSWT (c), or PxrUNK (d), whereas (*) indicates statistical significant difference between the Rmax or EC50 for CLO and 4BAB responses via the same zfPxr variant.
Statistical Analysis of Luciferase Reporter Gene Responses
| A | Compared Responses | PxrAB/Tü | PxrTL | PxrSWT | PxrUNK |
|---|---|---|---|---|---|
| CLO | DMSO vs 4.5 μM | 0.0001 | 0.0001 | 0.0001 | 0.0001 |
| DMSO vs 3.0 μM | 0.0001 | 0.0001 | 0.0001 | 0.0001 | |
| DMSO vs 0.5 μM | 0.0001 | 0.0001 | 0.0001 | 0.0001 | |
| DMSO vs 83 nM | 0.0001 | 0.0001 | 0.0001 | 0.5961 | |
| DMSO vs 14 nM | 0.9231 | 0.8682 | 0.9316 | 0.9995 | |
| DMSO vs 0.2 nM | 0.9999 | 0.9998 | 0.9996 | 0.9971 | |
| DMSO vs 0.03 nM | 0.9999 | 0.9997 | 0.9998 | 0.9996 | |
| 4BAB | DMSO vs 50 μM | 0.0001 | 0.0001 | 0.0001 | 0.9996 |
| DMSO vs 33 μM | 0.0001 | 0.0001 | 0.0001 | 0.5488 | |
| DMSO vs 11 μM | 0.0001 | 0.0073 | 0.0001 | 0.9998 | |
| DMSO vs 3.7 μM | 0.7763 | 0.9997 | 0.953 | 0.6689 | |
| DMSO vs 1.2 μM | 0.9958 | 0.9995 | 0.9995 | 0.8995 | |
| DMSO vs 0.4 μM | 0.9999 | 0.8796 | 0.9929 | 0.9999 | |
| DMSO vs 0.1 μM | 0.9994 | 0.9979 | 0.9996 | 0.993 |
| B | Compared Responses | 0.4 nM | 2.3 nM | 14 nM | 83 nM | 0.5 μM | 3.0 μM | 4.5 μM |
|---|---|---|---|---|---|---|---|---|
| CLO | PxrAB/Tü vs PxrTL | 0.0167 | 0.2374 | <0.0001 | <0.0001 | <0.0001 | <0.0001 | 0.0018 |
| PxrAB/Tü vs PxrSWT | 0.7707 | 0.0511 | 0.6888 | 0.0496 | 0.0294 | 0.8725 | 0.0393 | |
| PxrAB/Tü vs PxrUNK | 0.8965 | 0.9998 | 0.0002 | <0.0001 | <0.0001 | <0.0001 | <0.0001 | |
| PxrTL vs PxrSWT | 0.1551 | 0.8774 | 0.0017 | 0.0281 | 0.0002 | 0.0007 | 0.6801 | |
| PxrTL vs PxrUNK | 0.0023 | 0.2755 | <0.0001 | <0.0001 | <0.0001 | <0.0001 | <0.0001 | |
| PxrSWT vs PxrUNK | 0.3548 | 0.0627 | <0.0001 | <0.0001 | <0.0001 | <0.0001 | <0.0001 |
| Compared Responses | 0.1 μM | 0.4 μM | 1.2 μM | 3.7 μM | 11 μM | 33 μM | 50 μM | |
|---|---|---|---|---|---|---|---|---|
| 4BAB | PxrAB/Tü vs PxrTL | 0.1840 | 0.0013 | 0.9996 | 0.4299 | 0.9637 | 0.0751 | 0.4159 |
| PxrAB/Tü vs PxrSWT | 0.3229 | 0.0542 | 0.9938 | 0.9556 | 0.0175 | 0.0040 | 0.0083 | |
| PxrAB/Tü vs PxrUNK | 0.9071 | 0.9983 | 0.7314 | 0.1045 | 0.0011 | 0.0038 | 0.0123 | |
| PxrTL vs PxrSWT | 0.9875 | 0.5249 | 0.9985 | 0.1888 | 0.0570 | 0.6704 | 0.2806 | |
| PxrTL vs PxrUNK | 0.5165 | 0.0022 | 0.6710 | 0.8485 | 0.0002 | <0.0001 | 0.0001 | |
| PxrSWT vs PxrUNK | 0.7190 | 0.0793 | 0.5724 | 0.0322 | <0.0001 | <0.0001 | <0.0001 | |
One-way ANOVA and Dunnett’s test were used to determine the probability that the means of responses in exposed cells were different from exposures in nonexposed/DMSO treated cells (A). One-way ANOVA and Tukey-Kramer test were used to test for statistical differences between means of responses produced by the same exposure via different zfPxr variants (B). GraphPad Prism7.0 was used for statistical analyses. Tests that returned a greater than 5% probability for equal means (p value > .05) were shaded in gray in the tables.
![Variant dependent activation of zebrafish Pxrs. In vitro activation of the zebrafish Pxr variants was measured in a luciferase reporter gene assay. Cells were exposed to CLO (A, up to 4.5 μM) and butyl 4BAB (B, up to 50 μM), and responses (ΔRLU) were reported as normalized relative luminescence units in test cell lysates subtracted normalized RLUs in lysates from unexposed control cells. Four-parameter dose-response curves were fitted by nonlinear regression utilizing least square method in the variable slope model (GraphPad Prism 7.0). Fitted response curves were constrained to a bottom level of 0. For each of the zfPxr variants, One-way ANOVA and Dunnett’s test were used to test if the mean of responses in treated cells were different from responses in nonexposed/DMSO-exposed cells (Table 4[A]). One-way ANOVA and Tukey-Kramer was used to test for statistical differences between means of responses produced by the same exposure via different zfPxr variants (Table 4[B]).](https://oup.silverchair-cdn.com/oup/backfile/Content_public/Journal/toxsci/168/1/10.1093_toxsci_kfy269/2/m_kfy269f2.jpeg?Expires=1750029883&Signature=qFWUr~-W~3PVqsnBAoHnM5GSo1LwB69cBcqBAqopvthMDBPxWjKLf7SznH9D0A2aH-GojvjVpx8lO7NvTvqb3J3-mJuXqHRlE~LALoLCqIYZWY-4zht6gGYLF~E5CGvNzwwhqD3axw-OS5ysyBK3n0EbWCj2sQx6ivNedHaig7HoJfqRl~j54HS~I6jVkh2X2TI~HxX-JLmqDi16S--~zFZfMbVxAazW4yekBq~imDrbkroH3tdoWmYfC-5V6WK72fLuFQMC-JZLqouvEaY8~bJrsSANKWbSjuaTZbxP5nHcuis4OuSy95NIiFldhK8FWGkdxJirMviEUNDGINZxGw__&Key-Pair-Id=APKAIE5G5CRDK6RD3PGA)
Variant dependent activation of zebrafish Pxrs. In vitro activation of the zebrafish Pxr variants was measured in a luciferase reporter gene assay. Cells were exposed to CLO (A, up to 4.5 μM) and butyl 4BAB (B, up to 50 μM), and responses (ΔRLU) were reported as normalized relative luminescence units in test cell lysates subtracted normalized RLUs in lysates from unexposed control cells. Four-parameter dose-response curves were fitted by nonlinear regression utilizing least square method in the variable slope model (GraphPad Prism 7.0). Fitted response curves were constrained to a bottom level of 0. For each of the zfPxr variants, One-way ANOVA and Dunnett’s test were used to test if the mean of responses in treated cells were different from responses in nonexposed/DMSO-exposed cells (Table 4[A]). One-way ANOVA and Tukey-Kramer was used to test for statistical differences between means of responses produced by the same exposure via different zfPxr variants (Table 4[B]).
For CLO-induced responses, EC50s were lowest for PxrAB/Tü, PxrSWT, and PxrTL (0.11–0.14 μM), and highest for PxrUNK (0.35 μM; Table 3). Typically, EC50s of CLO-induced responses were two orders of magnitude lower than for responses induced by 4BAB.
Receptor-Ligand Interactions
Surface plasmon resonance was used to investigate if the sequence variations influenced the receptor-ligand interactions. Purified fusion proteins of the four different variants of zebrafish Pxr LBD (AA111-432) and maltose binding protein was used (Supplementary Figure 3). The dissociation constants (Kds) of the interactions between CLO and the zebrafish Pxr variants ranged from 0.04 to 260 μM. The CLO-PxrAB/Tü interaction was the strongest (40 nM), whereas the CLO-PxrSWT interaction was the weakest (260 μM) (Table 3). Based on the Kds, CLO interacts with PxrSWT and PxrUNK with lower affinity (Table 3, Figure 3 and Supplementary Figure 3). Kds for interaction between 4BAB and the zebrafish Pxr variants could not be determined by SPR.
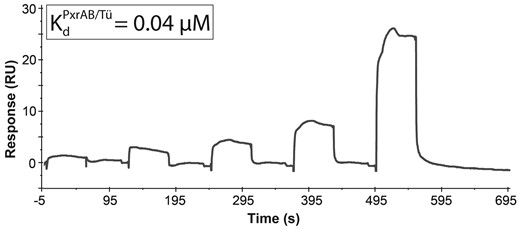
Surface plasmon resonance dissociation curves for the interaction of clotrimazole and the PxrAB/Tü variant. The interaction analysis between the MBP-Pxr LBD and ligand was performed with both multi and single cycle kinetics at the same conditions (25°C). Surface plasmon resonance sensorgram for the receptor-ligand interaction was fitted globally using a 1:1 Langmuir interaction model. Surface plasmon resonance dissociation curves for the interaction between CLO and PxrTL, PxrSWT, and PxrUNK are shown in Supplementary Figure 3.
Predicting Functional Effects of Amino Acid Variation
To further investigate the observed differences in dose-response dynamics and receptor-ligand interactions, we performed a detailed comparison of the amino acid sequence of the variant least responsive to CLO, PxrUNK, to the sequences of the other variants. Our phylogenetic analysis demonstrated that PxrUNK is closest related to Pxr2* and PxrTL, and more distantly related to PxrAB/Tü and PxrSWT (Supplementary Figure 1). In the hinge and ligand-binding regions (AA111-431), 98.6% of the positions of PxrUNK and PxrTL share the same amino acids, whereas the amino acids differ in five positions (Figure 1, Table 2). In comparison, PxrSWT and PxrAB/Tü have the same amino acid as PxrUNK in 96.7% and 97.0% of the positions, whereas the amino acids differ in 16 and 14 positions, respectively. Five positions in PxrUNK hold an amino acid not found in any of the three other zfPxr variants in this study. These positions are 184 (Ser>Ile), 218 (Tyr/Phe>Cys), 305 (Met>Lys), 385 (His>Asn), and 428 (insertion of Ile) (PxrTL/-AB/-Tü/-SWT>PxrUNK). The SIFT tool (Kumar et al., 2009; Sim et al., 2012) defined M305K and H385N as deleterious substitutions based on the assumption that highly conserved positions are intolerable to substitutions. PolyPhen2 defined H385N as possibly damaging and M305K as benign based on sequence, phylogenetic, and structural features characterizing the substitution (Adzhubei et al., 2010, 2013). However, some caution should be taken, as these in silico prediction methods may not adequately be able to predict secondary effects of amino acid substitution.
Predicting Structural Effects of Variation of Pxr Sequence
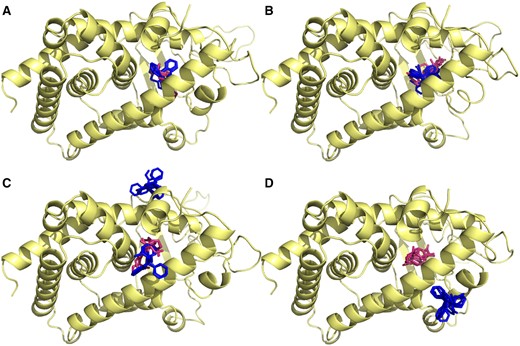
Homology modeling demonstrated that few of the differing residues occurred directly in the ligand-binding pocket (LBP, Figure 4). However, two of the residues are immediately adjacent to the LBP, V202M, where M202 is found in PxrAB/Tü and PxrTL, and the N223 indel found in PxrAB/Tü. Residue 202 is adjacent to the S208 position in human PXR found to be an exterior antagonist binding site for ketoconazole (Li et al., 2013). The 184(S/I), 218(Y/C/F), and 385(H/N) differences found in Pxr*1/Pxr*2 respectively, and in the PxrAB/Tü and -TL versus -UNK and -SWT, are located in less obviously significant locations on the exterior of the protein. Notably however, positions 184 and 218 are located on an exterior loop, and on a sheet adjacent to, but not in, the interior binding pocket. Residue 385(H/N) is located on the end of the LBD opposite to the LBP. It might play a role in dimerization of the DNA binding domains necessary for transactivation, but does not appear to interact with the RXR ligand binding domain dimerization with the PXR LBD.
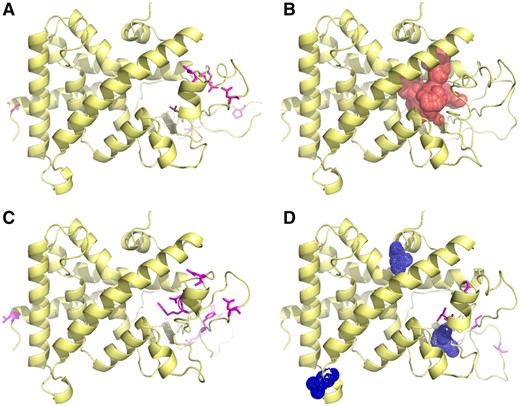
Structural models of Pxr from different strains of zebrafish. Models of zebrafish Pxr were predicted based on human ligand-bound PXR structures (see Materials and Methods section). The location of the ligand binding domain of RXR, the dimerization partner of PXR required for transactivation, was inferred based on overlay of the zebrafish homology model with the crystal structure of the RXR-PPARG dimer (Chandra et al., 2008). Amino acid differences from the reference TL structure are shown for AB/Tu (A), SWT (C), and UNK (D). Unique differences for the UNK structure are highlighted in (D). The canonical ligand binding pocket is shown in the TL reference structure (B). For interpretation of the references to colour in this figure legend, the reader is referred to the web version of this article.
Computational solvent mapping of the interior of the LBD, as has been done for human and polar bear PXRs (Lille-Langøy et al., 2015; Ngan et al., 2009) suggested that V202M does shift some of the small molecule fragment binding away from the substitution site, and may constrain the binding of certain chemical substituent groups (Figure 5). However, no major differences were evident for the zebrafish alleles. Interestingly, all of the solvent mapping results for the different variants revealed a number of allosteric binding sites external to the pocket of the ligand binding domain, including two adjacent to the short helix (H12) composing part of AF2. The UNK allele has an additional isoleucine residue in this helix, which may perturb ligand binding in this region as indicated by a truncated and less diverse solvent fragment mapping in this area.
Solvent mapping of zebrafish Pxr models. Computational solvent mapping of small molecules binding to zebrafish Pxr model reveals different allosteric binding sites for the variant PxrAB/Tu (A), PxrTL (B), PxrSWT (C), and PxrUNK (D). Details about how solvent mapping was performed can be found in Materials and Methods section. For interpretation of the references to colour in this figure legend, the reader is referred to the web version of this article.
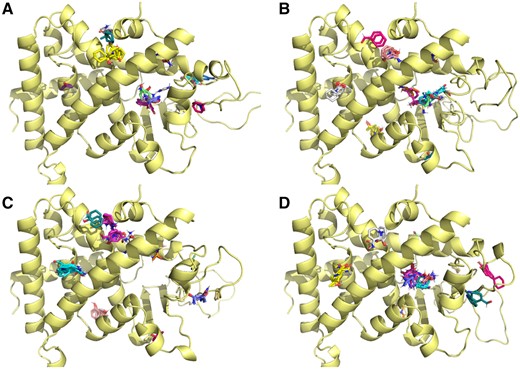
Docking of the different substrates to each of the zebrafish alleles revealed that both CLO and 4BAB had significant binding density not only in the presumed ligand binding site, but also in several allosteric sites (Figure 6). Notably, a presumed allosteric site adjacent to AF2 (helix 12) shows significant ligand density in several of the allelic forms. PxrSWT had CLO binding only at this presumed allosteric site adjacent to AF2, PxrTL had CLO binding only inside the LBD, yet PxrUNK displayed binding to neither of these sites. Calculated ligand affinities from the best binding mode are either nearly identical to or less than an order of magnitude different from the observed SPR values: 0.04 μM (PxrAB/Tü), 0.3 μM (PxrTL), 32 μM (PxrSWT), and 73 μM (PxrUNK). In some contrast all alleles displayed 4BAB binding inside the LBD, yet PxrUNK was the only allele to not present any 4BAB binding to the AF2 adjacent site.
Docking of substrates to allelic variants of zebrafish Pxr reveals different allosteric sites. The top 5 poses for 4BAB (orange/grey) and CLO (green/dark grey) for each allele (A: PxrAB/Tü, B: PxrTL, C: SWT, D: UNK) are presented together. Note that in addition to the main ligand binding pocket there are three allosteric sites, including one adjacent to the AF-2 site on helix 12. Different alleles exhibit different patterns of allosteric occupancy with different substrates. For interpretation of the references to colour in this figure legend, the reader is referred to the web version of this article.
DISCUSSION
We have described allelic variation of Pxr from several different strains of zebrafish, and demonstrated differences between these Pxr variants in their interaction with ligands and in their ability to transactivate a luciferase reporter gene in vitro.
The genetic variation of commonly used laboratory strains of zebrafish is generally lower than in wild zebrafish (Coe et al., 2009). However, compared with other model organisms, such as mice, zebrafish have a more diverse genetic background, likely due to the methods used to generate the major lines (Guryev et al., 2006). Recently, differences in behavior, as well as in transcript levels of genes involved in the hypothalamic-pituitary-interrenal axis, neural development and the innate immune system, were described between zebrafish of the AB and TL strains (Gorissen et al., 2015; van den Bos et al., 2017). In light of this it is not surprising to find considerable variation in the pxr of zebrafish. The discovery of intraspecies variation in pxr is not unique to zebrafish. Numerous polymorphisms in human pxr have been reported. The majority of these are noncoding region SNPs (approximately 2300), while 310 coding region SNPs have been reported in human PXR (NCBI_dsSNP, 2017). In the 91st release of the Ensembl genome database there are 152 exonic variants of zebrafish pxr; more than 7600 total variants have been identified (Ensembl.org/Danio_rerio/nr1i2/Genetic_variation, 2017). Polymorphisms in coding and noncoding regions of human pxr affect levels of PXR, and its target gene CYP3A4, as well as rates of drug clearance (Lamba et al., 2008; Siccardi et al., 2008; Swart et al., 2012; Zhang et al., 2001).
Strain Differences in Activation of Zebrafish Pxr
A number of reports have described activation of zebrafish Pxr with the same test compounds (Bainy et al., 2013; Ekins et al., 2007; Milnes et al., 2008; Moore et al., 2000), but the extent of the activation differs substantially between the studies. The inconsistency may be the result of different alleles in the Pxr gene of the strains used in those studies. In vitro and in vivo effects of CLO and 4BAB on zebrafish Pxr have been studied by a number of different laboratories. We found that PxrUNK was less sensitive to activation by CLO (higher EC50) than PxrTL and PxrAB/Tü, and that CLO induced a response of greater magnitude (higher ΔRLU) via PxrAB/Tü, PxrTL and PxrSWT, than via PxrUNK (Table 3). Other in vitro studies using GAL4 constructs have observed variable agonist activity for CLO (Bainy et al., 2013; Milnes et al., 2008; Moore et al., 2002), whereas others did not (Ekins et al., 2008). Similarly, 4BAB had variable potency as agonist for zebrafish Pxr in different studies (Ekins et al., 2008; Krasowski et al., 2005; Moore et al., 2002). We found that 4BAB was a moderate agonist for three of four variants of the zebrafish Pxr, but essentially did not activate PxrUNK (Table 3, Figure 2B). 4BAB was a more potent agonist for PxrAB/Tü, however the response induced was greatest via PxrSWT. Broadly, difference in reported activation of zebrafish Pxr, or indeed the PXR of many test organisms (Krasowski et al., 2005; Milnes et al., 2008), may be the result of allelic differences in the receptor sequences employed, as noted above.
PxrAB/Tü Has Higher Affinity for Clotrimazole Than Other Variants
The strongest nuclear receptor-ligand interactions, as measured by Kd, are those between hormone receptors and their endogenous ligands (reviewed in [Escriva et al., 2000]). In contrast to hormone receptors, PXRs interact with a variety of different ligands, and each interaction has unique properties and dose-response dynamics. Interestingly, the dissociation constants for the interactions between human PXR and SR12813, a cholesterol lowering drug (Jones et al., 2000), and PxrAB/Tü and CLO are comparable (Table 5). It has been shown that binding of ligand stabilizes the nuclear receptors by increasing dimerization with partner receptors (Forman et al., 1997), which in turn increases the affinity for DNA response elements (Kuntz and Shapiro, 1997). In addition, ligand binding increases the recruitment of coactivators (Delfosse et al., 2015). It is therefore reasonable to assume that at any concentration of ligand, the fraction of ligand-bound receptors is greater for a high affinity interaction than for a low affinity interaction. This in turn could result in more activated receptors available to heterodimerize and bind response elements, and thus induce transactivation. From our results, it appears that low EC50 results in greater response (ΔRLU) (Table 3). However, the relationship between strength of interaction (Kd) and response (ΔRLU) seems to be less clear. We found that the Kd of the CLO-PxrAB/Tü interaction was much lower than for the PxrTL-CLO interaction that produced the greatest response. In addition, the CLO-induced response via PxrSWT was greater than via PxrAB/Tü, even if the CLO-PxrAB/Tü interaction was much stronger than the CLO-PxrSWT interaction (Kds = 0.04 vs 260 μM, respectively). Thus, our findings indicate that there is not a direct relationship between strength of interaction between zebrafish Pxr variants and their agonists and agonist efficacy.
Overview of Dose-Response and Receptor-Ligand Interaction Properties for the Interaction Between Human and Zebrafish PXR/Pxr and Their Respective Ligands SR12813 and Clotrimazole
| Interaction | hPXR-SR12813 | PxrAB/Tü-CLO |
|---|---|---|
| Kd (μM) | 0.04 | 0.04 |
| EC50 (μM) | 0.2 | 0.11–0.35 |
| Reference | Jones et al. (2000) | This study |
| Interaction | hPXR-SR12813 | PxrAB/Tü-CLO |
|---|---|---|
| Kd (μM) | 0.04 | 0.04 |
| EC50 (μM) | 0.2 | 0.11–0.35 |
| Reference | Jones et al. (2000) | This study |
According to EC50s, 4BAB was a less potent agonist than CLO and Kds for the Pxr-4BAB interactions could not be determined by SPR, possibly due to the sensitivity of the SPR method when using small analytes such as CLO and 4BAB. Whereas 4BAB was a moderate agonist for three of the zebrafish Pxr variants, 4BAB could not activate PxrUNK at any concentration used, indicating differences in the interaction between 4BAB and the zebrafish Pxr variants.
Explaining Differences in Receptor Function by Variation in Amino Acid Sequence
CLO and 4BAB have both lower efficacy (lower ΔRLU) and potency (lowest EC50) via PxrUNK than via the other three variants. PxrUNK differed from all other variants by having unique amino acid substitutions in four positions, one in the hinge region (S184I) and three in the ligand-binding domain (F/Y218C, M305K, and H385N). In addition, the PxrUNK has isoleucine in position 428 that does not occur in the other three variants. Of these, only the H385N substitution was predicted by alignment algorithms to cause functional effects on the receptor. Because H385N is positioned far from the LBP, from putative interaction sites predicted by solvent mapping, or docked ligand positions, caution should be taken in when applying the results of these predictions. However, H385 causes a change of charge when His is replaced with Asn (positive to negative) and this may explain the impaired ability of PxrUNK to be activated by CLO and 4BAB in vitro, perhaps by perturbing the binding of primary cofactors. Nuclear receptor coactivators 1 and 2 (NCOA1 and NCOA2) interact with Pxr and induce assembly of the transcriptional machinery (Oladimeji et al., 2016). Moreover, nuclear receptor coactivator action has been suggested to be essential for full NR transcriptional activity (Tetel, 2009). The LXXLL motif is necessary for the interaction between NR and coactivators (Heery et al., 1997). The sequence and spacing of LXXLL motifs in nuclear receptor coactivators 1 and 2 (NCOA1 and NCOA2), that enhances PXR activity, are well conserved between simians and zebrafish (results not shown), and it is likely that simian NCOA1 and -2 may interact with zebrafish Pxr in COS7 cells. Because CLO and 4BAB differ both in size and structure ( Supplementary Figure 5), it is possible that different amino acids could be involved in docking and coordinating these compounds either in the LBP or in allosteric binding sites. The allosteric binding predicted in the cleft formed by helix 10 and helix 9 (Figure 6) could be affected by the insertion of isoleucine at position 428. Notably, allosteric binding sites have been identified in human PXR, including a site for ketoconazole binding between helix 6 and helix 5. S208 in the human sequence was identified as important for ketoconazole binding at this allosteric site (Li et al., 2013). This position is orthologous to the S184I substitution in PxrUNK, and the lack of CLO binding to these allosteric sites may significantly contribute to low activation and poor overall binding of CLO by this allelic variant. Binding and activation of PXR by different substrates may involve several different ligand binding sites including both the canonical LBP and allosteric surface sites (Mani et al., 2013), resulting in the observed allelic differences caused by amino acid substitutions at these sites. Molecular dynamics simulations support the idea of conformational shifts caused by ligand binding at an allosteric site adjacent to helix 5 (Chandran and Vishveshwara, 2016). Different binding positions might even result in small differences in gene sets regulated by activated PXR (Biswas et al., 2009; Ngan et al., 2009).
Implications of Sequence Variation for the Use of Zebrafish as Model
Not all of the approximately 30 available zebrafish lines are widely used (The-Zebrafish-Information-Network-[ZFIN], 2018), although many laboratories currently use several different strains of zebrafish. More SNPs occur in public available ESTs and mRNA sequences from zebrafish compared with rodents (Guryev et al., 2006). Moreover, the diversity in genetic background varies between zebrafish strains. In a study by Coe and co-workers, the SWT strain was found to have the most diverse genetic background, whereas the variation in genetic background was the least in the TL and AB/Tü strains (SWT>AB>WIK=TL=AB/Tü) (Coe et al., 2009). Thus, the number of SNPs in zebrafish pxr could well be higher than the 1484 SNPs currently reported for the PXR of mice (NCBI_dsSNP, 2017). In addition, studies of SNPs in noncoding regions may add insight to potential expression differences between strains. As laboratory strains of zebrafish are much less genetically variable than wild zebrafish (Coe et al., 2009), variation in pxr could be more prevalent in wild zebrafish.
To assess how intraspecies variation in pxr sequences affects the results with zebrafish as a model species, more information is needed. The prevalence of different pxr variants in zebrafish both within and between strains, and the link between variation and phenotypic outcomes in vivo, should be explored further. This information could be obtained by a large-scale screening of commonly used strains of zebrafish to link pxr genotype to functions in gene expression and xenobiotic biotransformation.
CONCLUSION
Here, we describe sequence variation in pxr obtained from three commonly used laboratory strains of zebrafish and one unknown (pet store) strain, and demonstrate with a luciferase reporter gene assay that the sequence variation is associated with the ability of the zebrafish Pxrs to be activated by clotrimazole and butyl-4-aminobenzoate. Furthermore, SPR analyses of the purified zebrafish Pxr variants and clotrimazole revealed significant differences in the strength of the receptor-ligand interactions. Our findings indicate that intraspecies differences in the ability of zebrafish to sense foreign compounds, and to initiate the biotransformation of xenobiotics, may arise from sequence variation in the Pxr gene. Consequently, the choice of zebrafish strain has the potential to significantly influence the outcome of toxicological studies involving putative PXR agonists. This could also be the case with other species used in toxicological testing.
SUPPLEMENTARY DATA
Supplementary data are available at Toxicological Sciences online.
FUNDING
This study was supported by the Research Council of Norway Programs Environment 2015 Project 181888 (AG) and BIOTEK2021 Project 248840 (AG), The Bergen Research Foundation (LMM), and the Boston University Superfund Research Program NIH 5P42ES007381 (JJS and JVG) and NIH 5U41HG003345 (JVG).
REFERENCES
Ensembl.org/Danio_rerio/nr1i2/Genetic_variation. (
NCBI_dsSNP. (
The-Zebrafish-Information-Network-(ZFIN). (
ZFIN-Community. (

Comments