


ABSTRACT
Lay Summary
Juvenile Chinook Salmon freshwater residence and survival were strongly influenced by hatchery release strategies in the Toquaht River. Understanding and optimizing release strategies at the individual hatchery scale are key to effectively supporting the recovery of salmon populations.
Objective
This study investigated the effects of release size, location, and timing on freshwater residence and survival probability of hatchery-reared Chinook Salmon Oncorhynchus tshawytscha in the Toquaht River, British Columbia.
Methods
A total of 4,845 passive integrated transponder (PIT)-tagged juvenile Chinook Salmon were released at three locations on the river (lower river [below lake], lake, and upper river [above lake]) and on three dates between May 23 and June 19, 2021. Freshwater residence and survival were assessed using a PIT tag array located near the river mouth. The detection data were analyzed using an integrated model of freshwater residence and capture–recapture using Bayesian inference. This approach allowed us to account for the uncertainty in environmental conditions experienced by migrating fish that went undetected.
Results
The median freshwater residence of the PIT-tagged fish was 13.8 d and was longer for fish released in the lake or upper-river locations and for juveniles released earlier in the study period. The median freshwater survival of the PIT-tagged fish was 0.35, and it was greater for fish released in the lake or upper river and for release dates later in study period. Both freshwater residence time and survival decreased with increasing fish size at release.
Conclusion
The results highlight that hatchery release strategies can substantially influence freshwater residence and survival. Current release strategies should be experimentally evaluated on a program-by-program basis and reconsidered depending on findings and hatchery objectives.
INTRODUCTION
It is broadly accepted that the rates at which Pacific salmon Oncorhynchus spp. survive and return to spawn are determined by a complex web of factors over a wide range of spatial and temporal scales (Beamish et al., 2003; Dorner et al., 2018; Ruff et al., 2017). A core challenge in understanding how salmonids respond to environmental changes is separating the influences of local, regional, and global factors shared among populations (Beamish & Mahnken, 2001; Dorner et al., 2018; Rogers & Schindler, 2011). Historically, it has been difficult to determine rates of early marine mortality independently from mortality experienced during the juvenile freshwater rearing and out-migration phases (Michel, 2019). However, the proliferation of small acoustic telemetry and passive integrated transponder (PIT) tags has allowed investigations into the survival and behavior of salmonids during discrete life stages (e.g., smolt out-migration) at a much finer scale than previously possible (Cooke et al., 2013).
Recent studies using electronic tags on juvenile salmonids have revealed out-migration survival probabilities ranging from very low (0.01) to moderate (0.50), with a large degree of variation across years (Aarestrup et al., 2014; Chittenden et al., 2010; Clark et al., 2016; Notch et al., 2020; Rechisky et al., 2019). Although it is generally accepted that marine survival primarily determines adult returns (Beamish & Mahnken, 2001; Chasco et al., 2021; Duffy & Beauchamp, 2011), the low out-migration survival estimates revealed by some studies suggest that out-migration success may have a larger impact on the abundance of Pacific salmon populations than previously thought (Chittenden et al., 2010; Michel, 2019). Therefore, increasing our understanding of the freshwater out-migration period is an important step in making effective management decisions, and investing in out-migration studies across a wider array of salmonid populations and river systems should be a higher priority (James et al., 2023).
Of the six Pacific salmon species, Chinook Salmon Oncorhynchus tshawytscha are the least abundant but attain the largest size as adults (Ohlberger et al., 2016). Their life history diversity and range size are second only to those of steelhead Oncorhynchus mykiss (anadromous Rainbow Trout) (Quinn, 2005; Riddell et al., 2018). On the west coast of Vancouver Island in British Columbia, Canada, Chinook Salmon are known to be predominantly subyearlings and occur in over 100 rivers (Fisheries and Oceans Canada, 2014). However, total adult returns in this region have declined with little evidence of recovery (Brown et al., 2019), a trend observed in Chinook Salmon populations throughout their range (Atlas et al., 2023). In 2020, the Committee on the Status of Endangered Wildlife in Canada (COSEWIC) recommended that Chinook Salmon from the west coast of Vancouver Island (designatable units 24, 25, and 26) be listed as “threatened” under the Species at Risk Act (COSEWIC, 2020). The COSEWIC assessment identified issues related to hatchery releases, ecosystem modification, agriculture and forestry effluents, harvest, and marine survival as the leading factors causing their decline.
In British Columbia, hatcheries have been used to augment Pacific salmon populations on a large scale since the late 1970s and remain a core component of salmonid management (Anderson et al., 2020; James et al., 2023). Although hatchery programs have generally succeeded in compensating for the high mortality experienced by wild Pacific salmon during the egg-to-fry or smolt stages, the efficacy of hatcheries as a rebuilding tool and their impact on wild populations remain poorly studied and controversial (Anderson et al., 2020; Mobrand et al., 2005; Riddell et al., 2024). A recent global review of research on hatchery effects on wild populations concluded that 83% of the studies on hatchery–wild interactions reported adverse effects on wild populations (McMillan et al., 2023). Other recent reviews have highlighted significant data gaps in the understanding of the effectiveness and risks of hatchery programs (Irvine et al., 2024; James et al., 2023; Riddell et al., 2024).
Fish hatcheries employ diverse techniques aimed at maximizing survival rates to achieve management objectives and reduce the risks to wild populations (Beckman et al., 2017; James et al., 2023; Nelson et al., 2019). For example, hatchery managers can control rearing conditions, such as water source, rearing containers, density, and feeding schedules, as well as release strategies, which include fish size at release and the location and timing of release. However, their effectiveness can vary greatly among hatcheries and years, necessitating the study of rearing and release strategies on a program-by-program basis (Anderson et al., 2020; James et al., 2023).
To examine how the size at release, release location, and timing of release affect freshwater residence and survival of a hatchery-origin Chinook Salmon population in the Toquaht River on the west coast of Vancouver Island, we used PIT tag telemetry and integrated statistical models. We were interested in testing the following hypotheses: (1) residence time would be short (0.5–5 d) and survival moderate to high (>0.5) due to the short migration distance (between 4.1 km and 11.9 km) and limited number of predators in the Toquaht River, (2) fish released later in the study would have shorter freshwater residence (as their release timing moves farther from the natural out-migration period) and lower survival (due to low water levels that could increase predation risk), (3) fish released closer to the estuary would have shorter freshwater residence and higher survival due to the shorter out-migration distance, and (4) smaller fish would reside longer in freshwater (due to slower migration rates and/or to continue growing) and have lower survival (due to higher vulnerability to predation) than larger fish.
METHODS
Study site
The study was conducted in the Toquaht River, a fourth-order stream located in the northeastern Barkley Sound on the west coast of Vancouver Island (49°2′15.31″N, 125°21′27.84″W) (Figure 1A). The Toquaht River is the most valued salmon river within the territory of the Toquaht Nation and historically supported populations of Chum Salmon O. keta, Chinook Salmon, Coho Salmon O. kisutch, Sockeye Salmon O. nerka, steelhead and Rainbow Trout, Coastal Cutthroat Trout O. clarkii, and Dolly Varden Salvelinus malma (Duncan & Grant, 1990). The Toquaht River watershed has seen a sharp decline in all Pacific salmon populations since the mid-1980s (Fisheries and Oceans Canada, 2024). In response to this decline, a community hatchery run by the Thornton Creek Salmon Enhancement Society implemented a Chinook Salmon enhancement program designed to stabilize and rebuild the population. Despite the high level of hatchery input, current adult returns remain well below historic levels (Fisheries and Oceans Canada, 2024).
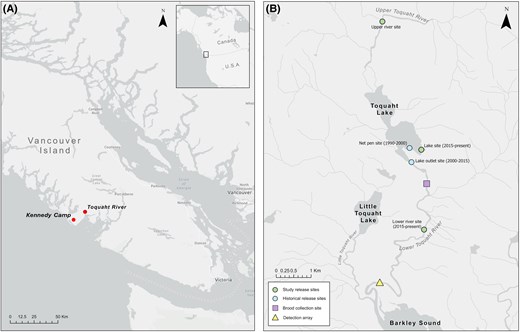
Maps showing (A) the location of the Toquaht River and Kennedy Camp weather station on Vancouver Island, with an inset showing the study site location in Canada, and (B) the location of brood collection, release sites (historic and used in the study), and the PIT array on the Toquaht River.
Brood collection and husbandry
On September 22 and October 6, 2020, Thornton Creek Hatchery staff collected Chinook Salmon broodstock by beach-seining and gillnetting from two locations in the midsection of the Toquaht River: Lucky Pool (49°4′7.78″N, 125°20′27.12″W) and Canyon Pool (49°4′14.13″N, 125°20′29.96″W) (Figure 1B). Broodstock fish were stripped of eggs or milt, then sampled streamside for tissue samples, scales, otoliths, and fork lengths. It is Thornton Creek Hatchery’s practice to use milt from more than one male to fertilize each female. This is done to mitigate the possibility of an infertile male and to maximize the genetic diversity in each batch (i.e., cohorts spawned on the same day that are comprised of fertilized eggs from one pair or several pairs of males and females). All fish in a batch have the same accumulated thermal units and are shocked at the eyed stage to separate viable from nonviable eggs. After hatching, the fish were ponded in covered metal troughs with a freshwater flow-through system. Each batch was reared in its own troughs, but all were reared under the same conditions. Study fish were fed BioVita feed (Bio-Oregon, Longview, Washington) once daily, withholding food for 1 d every 7–10 d and increasing the size of food to match the growth rates of fish. Daily feed quantities were based on BioVita guidelines, using rates between 0.016% and 0.025% of body weight per day throughout the rearing cycle, based on water temperature and average body mass.
Tagging and releases
A total of 5,000 fish were tagged once they surpassed the minimum tagging size threshold. The length threshold for tagging was initially 65 mm fork length, according to the PIT tag manufacturer’s (Biomark, Boise, Idaho) guidelines based on Prentice et al. (1990). However, after approximately the first 1,000 fish, the threshold was increased to 69 mm fork length based on the recommendation by Vollset et al. (2020). During the monitoring period (see below), the two groups of fish tagged under different minimum size thresholds had negligible differences in mortality (2.9% and 3.4% for the 65- and 69-mm thresholds, respectively). Prior to tagging, the fish were starved for 24 h and anesthetized using 0.1 g/L of MS222 (tricaine methanesulfonate). Anesthetized fish were implanted with a PIT tag (APT12 PIT 12.5 mm 134.2 kHz ISO FDX-B; Biomark) into their abdominal cavity using MK25 PIT tag implanters (Biomark) with preloaded needles. Tag implantation took place in a dedicated tagging trailer containing a custom-designed flow-through table connected to the hatchery holding troughs so that tagged fish were immediately returned to their trough after receiving a tag. The number of fish selected for PIT tagging from each of the five batches was proportional to the number of fish in each batch, and the fish were collected randomly.
Tagged fish were monitored for 14–40 d after tagging. During this monitoring period, hatchery-rearing troughs were checked twice daily for mortalities. Rejected tags were collected from the bottom using a 2.5-cm magnet screwed to the end of a 1-m-long PVC pipe. A total of 165 (3.3%) mortalities and 116 (2.3%) rejected tags were found. Hatchery staff tagged 242 additional fish to compensate for tag loss and mortality during the holding period. Two to four days prior to release, each fish was anesthetized, PIT ID recorded, weighed, measured for fork length, and divided evenly and randomly in one of three holding troughs. Tagged fish were released on May 23, June 9, and June 19, 2021, at all three release sites: the lower Toquaht River at the bridge (4.1 km upstream of the PIT array, see below), Toquaht Lake (7.9 km from the array), and the upper Toquaht River (11.9 km from the array) (Figure 1B). Compared with the standard release strategies utilized by Thornton Creek Hatchery, the May 23 release date was earlier than the standard release timing, whereas the June 9 and 19 dates were within the typical release window. Although the lower river and lake are frequently used as release sites, the upper river had not been utilized in previous releases. Juveniles were transported to the release sites in two trucks equipped with 900-L aerated aluminum transfer tanks (no mortality was observed after transport). Water temperatures in the transfer tanks were slowly lowered (∼1°C/h) to match the temperatures at the release sites and to avoid thermal shock. A total of 4,845 fish with operational tags were released.
Placement of PIT array and monitoring
The out-migration of PIT-tagged Chinook Salmon was monitored using a PIT array made of two independent and identical detection antennas placed 100 m apart within the same shallow run in the lower Toquaht River (Figure 1B). The antennas were installed on April 8, 2021, and removed on August 29 of the same year (30 d after the last detection). The array position was chosen to be as close to tidewater as possible while being broad and shallow to ensure adequate coverage of the stream channel. Similar to most rivers on the west coast of Vancouver Island, the Toquaht River receives a high volume of annual rainfall and in pulses that cause water levels to rise and drop quickly (Porter et al., 2019). The rapid rise and fall of water levels meant that each fish or group of fish would not always experience the same probability of detection when passing the PIT array. Read-range tests revealed that the distance of a tag to the antenna, which increases with rising water levels, would be an important factor influencing detection. A HOBO U20L logger (Onset, Bourne, Massachusetts) was used to record water levels during the out-migration period. However, the logger was unavailable before June 7 and failed on June 30, leaving missing records for most of the study period (May 23 to August 29, 2021). Therefore, we used rainfall data collected at a weather station located ∼16 km southwest of the study site (Kennedy Camp, 48°56′43.020″N 125°31′38.050″W; Figure 1A) as a proxy for water level. We compared this rainfall data at various day lags to the available water level data collected for the 3 weeks in June to test for correlation and usability of rainfall as a proxy for water level.
Data analysis
The detection data were analyzed by integrating a model for freshwater residence (i.e., a general linear model) with a Cormack–Jolly–Seber (CJS) model implemented using a state–space approach (Gimenez et al., 2007; Kéry & Schaub, 2012). The freshwater residence model enabled us to predict the date on which undetected fish would migrate past the PIT array had they survived. This prediction was linked to lagged rainfall data to estimate their probability of detection, yielding more accurate estimates of freshwater survival. The integrated model was fitted to the data using Bayesian inference, enabling full propagation of uncertainty from predictions of the out-migration date to the estimates of detection and survival probability.
Freshwater residence time model
We determined patterns in freshwater residence—the time elapsed between a fish’s release and first detection at the PIT array—using a general linear model with a generalized gamma distribution. Specifically, the freshwater residence time for each individual fish was modeled as follows:
where ri is the freshwater residence time of fish i, is the scale parameter for fish , and is one of the two shape parameters of the distribution, which we allowed to vary by release group (a combination of release site and date for a total of nine groups). The other shape parameter was set to 1 so that the distribution was reduced to the Weibull distribution (Plummer, 2017). This approach implements the accelerated failure time parameterization of the Weibull distribution, which substantially improves the mixing of chains compared with the use of the Weibull distribution proper implemented in JAGS (Plummer, 2017; see “Model fitting and assessment” below). Using a log-link function, we modeled the scale parameter for an individual as
where is the intercept, is the coefficient for the effect of an individual’s fork length () at release, is a vector of coefficients describing the main effects and two-way interactions between release site and date, and is a design matrix with factor variables indicating the release site and date for an individual.
Survival and detection model
To estimate out-migration survival, we used a state–space version of a CJS-type capture–recapture model (Gimenez et al., 2007; see Kéry & Schaub, 2012 for a detailed description of the model assumptions), where survival and detection probabilities were constrained to be a function of covariates. The state–space formulation of the model is defined by two submodels: an ecological state (alive or dead) submodel describing the survival process and an observation (detected or undetected) submodel describing the detection process of tagged individuals given their ecological state. The ecological state process is defined as
where is the state of individual at its release site, which is set to 1 as the individual was alive when released; and are the states (0 = dead; 1 = alive) of individual at site and site (release site: = 1; upper antenna site: = 2; and lower antenna site: = 3); and is the apparent survival probability between sites and + 1 for individual i. The model assumes that all tagged animals are available to be detected so that mortality is not confounded with permanent emigration from the sampling area. When this assumption is violated, the estimates of survival are lower than true survival (Kéry & Schaub, 2012). In our study, this assumption could be violated if tagged fish migrated beyond the detection range of the antenna, which was a possibility during brief periods of high water levels. Given that it is not usually possible to determine the fraction of tagged animals that permanently emigrate from sampling areas, survival estimates from CJS-type models are more appropriately termed “apparent” survival (Kéry & Schaub, 2012). However, for simplicity, we dropped the term “apparent” from our presentation of the survival model and the results below.
We modeled individual survival probability from release site to the upper antenna site (i.e., ) as
where is the intercept, is the coefficient for the effect of an individual’s fork length () at release, is a vector of coefficients describing the main effects and two-way interactions between release site and date, and is a design matrix with factor variables indicating the release site and date for an individual.
During the initial model development, we assumed that survival probability for all fish sizes and release groups was 1 from the upper to the lower antenna site (i.e., ) because of the short distance (100 m) between them. However, assessments of the model fit using posterior predictive checks (see “Model fitting and assessment”) were not satisfactory but improved substantially after we removed the constraint and allowed the model to estimate survival probability between antennas.
The observation process is conditional on the state of individual at a site and is defined as
where is a variable indicating whether an individual was detected (0 = undetected; 1 = detected) at a PIT antenna site = {2, 3}), given that it was alive and migrating past the detection range of the antenna at the site. We modeled individual detection probability at a PIT antenna site as
where is the intercept and is the coefficient for the effect of rainfall 2 d before (see Results) an individual migrated past the PIT array () on detection probability, which is only known for individuals that were detected while migrating past the array. To assign a rainfall value to individuals that were not detected, we used the predicted date that they would have migrated past the array had they survived. This date was calculated as the sum of their release date and the predicted number of days they would have resided in freshwater, according to the model described in Equation 2. Failure of the reader board linked to the antenna at the lower site prevented detection of fish at that site between May 25 and June 8 (fish could still be detected at the upper antenna site during this period). To account for this failure in the model likelihood, we fixed the detection probability of the lower antenna site at for fish that migrated past the array during that period (but were detected at the upper antenna) or for undetected fish whose migration date past the array was predicted to have occurred within the same period.
Model fitting and assessment
The general linear model of freshwater residence time and the state–space CJS-type model were fitted in an integrated framework using Bayesian inference (Kéry & Schaub, 2012), which allowed full propagation of uncertainty in the parameters across the models (e.g., uncertainty in predictions of the day an undetected fish migrated past the PIT array and, therefore, the rainfall value that would influence its detection probability were automatically propagated within this integrated model fitting framework). We used Normal(0, 3.2) priors for the intercept and coefficients of all models described by Equations 2, 5, and 7; Gamma(0.1, 0.1) hyperpriors for the shape and rate parameters of the prior Gamma distribution for the release-group-specific shape parameters in Equation 2; and a Beta(1, 1) prior for the survival probability between antennas (i.e., ).
The posterior distributions of model parameters were approximated with samples obtained with Markov chain– Monte Carlo (MCMC) algorithms implemented in JAGS 4.3.1 (Plummer, 2017) via the package jagsUI 1.5.2 (Kellner, 2021) in R 4.1.2 (R Core Team, 2021). We ran four MCMC chains for 2,000,000 iterations, discarding the first 1,000,000 as burn-in and keeping every 1,000th sample out of the remaining 1,000,000 samples, thus obtaining 1,000 samples per chain– (a total of 4,000 samples). The MCMC chains exhibited satisfactory convergence based on assessments using trace plots and their statistic being <1.1 (Gelman & Rubin, 1992). The samples were used to summarize the posterior distributions of the model parameters and predictions with their medians and 95% highest posterior density intervals (HPDI) (McElreath, 2020). For each coefficient in Equations 2, 5 and 7, we also present the proportion of their posterior samples that had the same sign as their median (f-value; Plummer, 2003). We considered f >0.95 as indicative of strong evidence of an effect. Data summaries are presented as medians, median absolute deviations (MAD), and ranges. Model predictions by release site and date were generated assuming an average-sized fish (i.e., 82.7 mm) in the data set to control for the effects of size when comparing the release strategies.
We assessed the fit of the freshwater residence model using posterior predictive check plots (Gabry et al., 2019), which indicated an adequate fit (Figure S1 available in Supplement S1 [see online Supplementary Material]). To assess the fit of the state–space CJS-type model, we compared the observed and expected frequencies of detection histories using a χ2 test. Detection histories were denoted by three digits (e.g., 101) referring to release (first digit) and detection at the two antennas (second and third digits for the upper and lower antenna, respectively), where 1 indicates release/detection and 0 indicates no detection. To generate the expected frequencies, we first simulated the detection histories for each individual using the parameter values sampled from their posterior distributions. Next, we computed the frequency of each detection history in a simulation. Finally, we computed the median frequency of each detection history across 4,000 simulations and used the median frequency of the detection histories as the expected frequency in the χ2 test. The observed (100 = 3,824; 110 = 432; 101 = 347; 111 = 242) and median expected (100 = 3,811; 110 = 439; 101 = 364; 111 = 229) detection histories were similar, and the test results did not indicate lack of fit (χ2 = 12, df = 9, P = 0.21; see also Figure S2 available in Supplement S1).
RESULTS
A total of 1,263 detections occurred during the monitoring period from May 23 to August 29, 1,021 of which were unique fish (21.1% of 4,845). Of the unique fish detected, 228 (22.3%), 398 (39%), and 395 (38.7%) were released in the lower river, lake, and upper river, respectively, whereas 179 (17.5%), 274 (26.8%), and 568 (55.6%) were released, respectively, on May 23, June 9, and June 19 (Table 1).
Summary of the number of fish released and detected as well as their mean length at release. Each release group was defined by a combination of release site and date.
| Release date | Length at release (mm; mean ± 1 SD) | Release site | Number of fish released | Number of fish detected |
|---|---|---|---|---|
| May 23 | 77.1 ± 4.9 | Lower river | 527 | 98 |
| Lake | 535 | 39 | ||
| Upper river | 532 | 42 | ||
| June 9 | 83.6 ± 4.7 | Lower river | 536 | 17 |
| Lake | 531 | 118 | ||
| Upper river | 534 | 139 | ||
| June 19 | 87.3 ± 4.7 | Lower river | 525 | 113 |
| Lake | 562 | 241 | ||
| Upper river | 563 | 214 | ||
| All dates and sites | 4,845 | 1,021 | ||
The median freshwater residence time observed across all release sites and dates was 13.8 d and varied substantially within and between release groups (MAD = 9.1 d; range = 0.5 to 61.4 d; Table 2). Assessment of the posterior distribution of the freshwater residence model coefficients showed strong evidence of a negative relationship between fish length and freshwater residence time (f = 1; Figure S1A available in Supplement S2 [see online Supplementary Material]; Figure 2), as well as an interactive effect of release site and date on the time fish resided in freshwater (all interactions with f = 1; Figure S1A available in Supplement S2). The shape parameters of each release group revealed that the smallest freshwater residence variation occurred among fish released in the lower river on May 23, followed by all fish released on June 19 (Figure S1B available in Supplement S2).
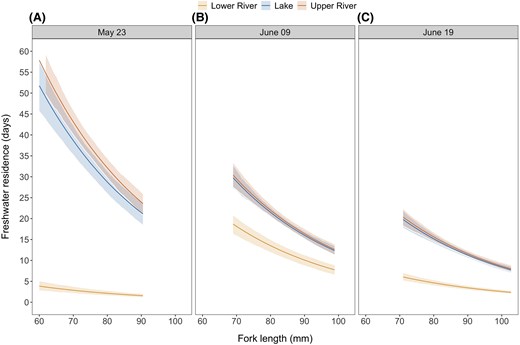
Predictions of freshwater residence time as a function of fish fork length (size) by release site and date: (A) May 23, (B) June 09, and (C) June 19. As the fish length at release increased, freshwater residence time decreased rapidly. The predictions are shown for the range of sizes released on each date. Solid lines represent the median of the posterior distribution of the predictions, and the ribbons represent the 95% highest posterior density intervals.
Summary of observed freshwater residence times (days) by release site and date for fish detected at the PIT array. Abbreviations are as follows: MAD = median absolute deviation.
| Release site and date | Median | MAD | Minimum residence time | Maximum residence time |
|---|---|---|---|---|
| Lower river | ||||
| May 23 | 0.7 | 0.1 | 0.5 | 34.6 |
| June 9 | 13.7 | 3.0 | 10.7 | 18.6 |
| June 19 | 2.6 | 2.9 | 0.7 | 17.6 |
| Lake | ||||
| May 23 | 35.5 | 3.2 | 2.6 | 59.9 |
| June 9 | 18.5 | 2.9 | 10.6 | 42.6 |
| June 19 | 10.6 | 5.2 | 1.6 | 40.5 |
| Upper river | ||||
| May 23 | 35.7 | 5.6 | 27.6 | 61.4 |
| June 9 | 18.7 | 3.2 | 10.7 | 48.6 |
| June 19 | 11.6 | 5.8 | 1.7 | 41.0 |
Model predictions of residence times showed that fish released in the upper river on May 23 had the longest residence times of nearly 30 d, followed closely by lake-released fish on the same day (Figure 3A). Median freshwater residence time of both upper-river- and lake-released fish decreased by ∼7 d with each subsequent release, ending at about 15 d for fish released on June 19 (Figure 3B, 3C). Fish released in the lower river exhibited a much lower and nonlinear pattern of freshwater residence across release dates, being only a few days for fish released on the first (May 23) and last (June 19) release dates and about 12 d for fish released in the intermediate (June 9) release date (Figure 3).
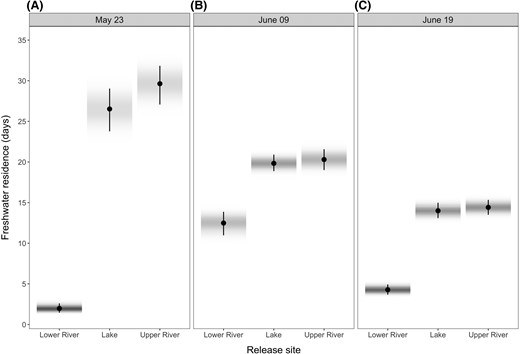
Predictions of freshwater residence time by release site and date: (A) May 23, (B) June 09, and (C) June 19. The farther the fish were released from the estuary, the longer was their residence time. Fish released in the lake and upper river showed a decrease in residence time with successive release dates. In contrast, fish released in the lower river exhibited shorter residence times on the early release date, followed by an increase on the middle date, before decreasing again with the final release. Predictions were made assuming a fish with fork length equal to the average in the data set (i.e., 82.7 mm). Circles represent the median of the posterior distribution of predictions, and the bar shows their 95% highest posterior density intervals. Shading represents the density of the posterior distributions of predictions (darker shades represent highest densities).
Total daily rainfall was positively correlated with mean daily water level (collected during the period when the logger was functional) 0 to 5 d later, but the strongest correlation coefficient was computed with a 2-d lag on total daily rainfall (, 0.01 versus 0.30 for all other lags) and was adopted as a predictor of detection probability in the survival analysis. Model estimates revealed that the PIT array had a baseline detection probability of 0.4 (95% HPDI = 0.36, 0.44) under no rainfall (low water levels), which decreased rapidly with increased rainfall (and therefore high river levels), nearing zero above 20-mm rainfall events (Figure 4).
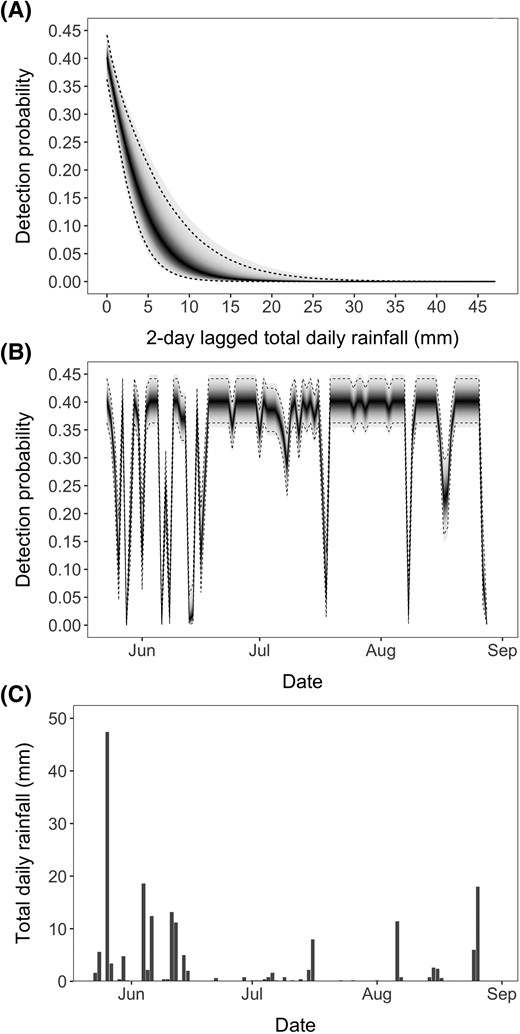
(A) Detection probability declined sharply with total rainfall, being virtually zero at about total daily rainfall of 20 mm. The medians (95% highest posterior density intervals) of the posterior distribution of the parameters in the linear predictor used to generate the curve (Equation 7) were and . Panels (B) and (C) show that high rainfall events were frequent during the first month of monitoring, resulting in several events with low detection probabilities. In panels (A) and (B), the solid line represents the median of the posterior distribution of detection probability for a given observed rainfall, whereas the dashed lines represent the 95% highest posterior density intervals. Shading denotes the density of the full posterior distribution of detection probability, with higher probability densities denoted by darker shades.
The median posterior prediction of survival probability across all release groups and fish sizes was 0.35 (95% HPDI = 0.02, 0.81). Similar to the freshwater residence model, summaries of the posterior distribution of survival model coefficients revealed strong evidence for an interactive effect of release site and date on the probability of surviving the out-migration (all interactions had f = 1; Figure S2 available in Supplement S2). Survival of upper-river- and lake-released fish was similar on all release dates and increased for both release groups with later release dates (Figure 5). Fish released in the lower river had similar survival between the earliest (May 23) and latest release dates (June 19) (Figure 5A, 5C) but exhibited low survival when released on June 9 (Figure 5B). Survival of lower-river-released fish was only higher than that of upper-river- and lake-released fish on the earliest release date (Figure 5A). Survival probability between antennas was estimated as 0.89 (95% HPDI = 0.81, 0.96) for all release groups.
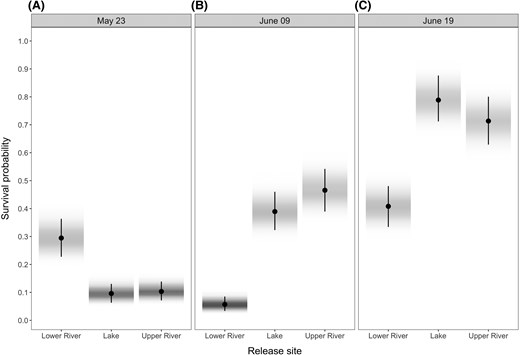
Predictions of survival probability by release site and date: (A) May 23, (B) June 09, and (C) June 19. Survival probabilities generally increased with later release for upper-river- and lake-released fish. For lower-river-released fish, survival probabilities were similar between the earlier and later releases and lowest for the intermediate (June 9) release. Predictions were made assuming a fish with fork length equal to the average in the data set (i.e., 82.7 mm). Circles represent the median of the posterior distribution of predictions, and the bar shows their 95% highest posterior density intervals. Shading represents the density of the posterior distributions of predictions (darker shades represent highest densities).
When examining the relationship between length at release and detection, we observed a slight shift towards smaller fish being detected more frequently than larger fish (Figure S3 available in Supplement S2). Accordingly, the model predictions showed a marked decline in survival probability with increasing fish size at release (Figure 6), and an f-value of 1 indicated strong evidence for this negative effect. This decline was more pronounced in release groups with higher overall survival (Figure 6).
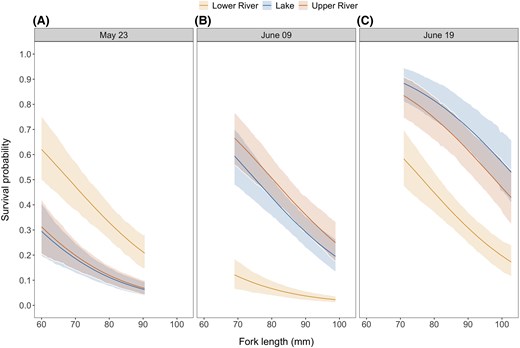
Predictions of survival probability as a function of fish fork length (size) by release site and date: (A) May 23, (B) June 09, and (C) June 19. Survival probability showed a marked decline with increasing size of fish at release. The predictions are shown for the range of sizes released on each date. Solid lines represent the median of the posterior distribution of the predictions, and the ribbons represent the 95% highest posterior density intervals.
DISCUSSION
Assessments of hatchery release strategies present valuable opportunities for managers to refine their programs in an effort to meet their production and/or conservation objectives. However, there is a notable lack of detailed information and experimental work regarding how different strategies influence freshwater residence and out-migration survival. Our research shows that both freshwater residence and out-migration survival can vary substantially with strategies based on site and timing of release. The length of the fish at release also influenced both freshwater residence time and survival, with smaller fish residing longer in freshwater and experiencing a higher probability of survival than larger fish.
Because of the short migration distance in the Toquaht River and the later release timing and larger size relative to what would be exhibited by wild fish in the region (e.g., Burns et al., 2019), we expected that tagged fish would out-migrate in a matter of hours to days. Although some fish released in the lower river did out-migrate immediately, others stayed for nearly 2 months, with smaller fish residing longer than larger fish. This large variation in residence time may partly reflect hatchery fish exhibiting variability in recovery from handling stress, as well as genetically predetermined or environmentally influenced freshwater residence strategies (Apgar, 2020; Groot & Margolis, 1991). Fish that resided in freshwater longer may have done so to capitalize on feeding opportunities that would enhance their survival in the marine environment (Johnson et al., 2015). However, late marine entry has been linked to reduced survival (Levings et al., 1986; Satterthwaite et al., 2014), lower adult returns (James et al., 2023), and an increase in age at return (Bosch et al., 2023). Thus, future experimental studies establishing links between release strategies and freshwater residence, marine survival, and adult returns will be essential for refining hatchery programs.
Despite the Toquaht River being a short, undammed river, the median survival probability across all the release groups was relatively low (0.35). This estimate is slightly higher than that for hatchery-origin Chinook Salmon migrating through California's San Joaquin and Sacramento rivers (0.026–0.17; Michel, 2019) and within the range (0.11–0.47) estimated in the nearby Cowichan River (Salish Sea Marine Survival Project, 2024) on Vancouver Island, despite their longer migration routes. High mortality over short migration distances is not without precedents. Chilko Lake Sockeye Salmon smolts, for example, exhibit very low survival (0.32) within 13.5 km of river at the start of their out-migration due to heavy Bull Trout Salvelinus confluentus predation (Furey et al., 2015; Rechisky et al., 2019). The Toquaht River may have similar bottlenecks, such as the lake outlet and canyon base, where predator concentrations are higher and could disproportionately impact juvenile survival (D. J. A. Hurwitz, personal observation). However, predator bottlenecks alone do not fully explain why fish released in the lower river sometimes had higher mortality than those released upstream, indicating a potential temporal factor affecting mortality.
Periods of high and low survival corresponded to the lowest and highest flow events, respectively. For instance, under low rainfall and water levels between May 23 and 27, lower-river-released fish out-migrated within 1–2 d, showing higher survival than upper-river- and lake-released fish. However, heavy rain starting May 27 raised water levels, possibly impacting the lake and upper-river fish released on May 23 as they navigated the tumultuous lower-river canyon. This possible link between low survival and high flows contrasts with other research indicating that increased flows enhance out-migration survival and adult returns (Buchanan et al., 2013; Cordoleani et al., 2018; Melnychuk et al., 2010; Michel, 2019; Michel et al., 2015). These studies, conducted on dam-regulated California rivers affected by drought and augmented flows, found that increased flows improve conditions for salmonids—higher velocity for faster migration, increased turbidity for protection from predators, and more accessible habitat (Sommer et al., 2005). Conversely, the unregulated Toquaht River often experiences extreme rain events and flooding during salmonid rearing and out-migration. Traditionally, Thornton Creek Hatchery’s releases have been timed with increased flows, assuming lower predation under these conditions. Our results suggest that this practice may need to be reevaluated as increased, turbulent flows in the lower Toquaht River canyon potentially result in physical trauma and/or disorientation, thus increasing mortality of out-migrating fish.
Our finding that larger fish exhibited lower survival than smaller fish contrasts with other studies that have found no relationship between the size and survival of out-migrating Chinook Salmon (Michel et al., 2015; Pellett et al., 2019) or higher survival for larger fish (Bosch et al., 2023). One potential explanation for our results is that larger fish were mismatched to forage in the habitats provided by the Toquaht River, leading to either faster seaward migration or lower survival of those remaining in freshwater. Alternatively, this finding may be a result of size-selective predation, wherein predators, such as harbor seals Phoca vitulina and birds, preferentially target larger fish (Nelson et al., 2019; Thomas et al., 2017). These contrasting freshwater survival-by-size results highlight the importance of investigating hatchery release strategies in relation to marine survival, adult return, and age at return on a program-by-program basis to fully address the complexities of effective population management.
Our modeling approach addresses broader challenges in telemetry-based studies of survival and has wider application potential. A key challenge in PIT systems and other telemetry approaches is the imperfect and variable detection efficiency due to environmental changes and tag collisions (Zentner et al., 2021). The CJS-type models have long been used to address imperfect and variable detection efficiencies when estimating survival probabilities (Nichols, 2006). The state–space form of the CJS-type model that we used is flexible and facilitates the incorporation of time-varying individual-level covariates (Gimenez et al., 2007; Royle, 2008), including the changing environmental conditions experienced during migration. Importantly, by integrating the state–space CJS-type model with a freshwater residence model, we were able to account for the uncertainty in the environmental conditions experienced by undetected fish when estimating their probability of detection as they passed the PIT array. However, the approach can also be used to model survival probability as a function of uncertain environmental conditions experienced by undetected fish (see also Perry et al., 2018). We recommend that future PIT-based and other telemetry-based migration survival studies apply these integrated models to account for the known and uncertain time-changing environmental conditions experienced by tagged individuals.
Modern PIT tag detection systems with 12-mm FDX tags typically achieve read ranges of 35–41 cm (Beeman et al., 2012; Connolly et al., 2008), making them effective in shallow water and flow-controlled rivers but limiting their use in medium to large rivers with varying water levels. The antennas in this study achieved a vertical read range of 20–25 cm over a 14-m river span. Under base flow conditions, the array effectively covered the stream channel both horizontally and vertically. However, the increased rainfall and water levels expanded the stream area beyond the detection range. Fish moving outside this range would have had no chance of being detected, violating the critical assumption of CJS-type models that live tagged animals remain in the sampling area (i.e., are available to be detected), which leads to a negative bias in survival estimates (Kéry & Schaub, 2012; see Methods). The survival probability of 0.89, estimated for the 100-m distance between antennas, likely reflects incomplete river coverage during high flows, suggesting that approximately 11% of fish migrating through the PIT array were not at risk of being detected under conditions of expected 100% survival. This level of bias may also partially explain the low survival probabilities estimated for fish out-migrating under incomplete river coverage by the PIT array at high water levels.
Optimizing release strategies to increase out-migration survival and ensure that fish reach the marine environment at the optimal timing and size remains a crucial aspect of hatchery programs. In the Toquaht River, our findings suggest that releasing small fish later in the season and in the lake and upper river maximizes the number of fish that survive to reach the estuary. In contrast, it has been shown that salmonid smolts entering the estuary earlier and at a larger size have higher survival in the marine environment, resulting in more returning adults (Beamish & Mahnken, 2001; Chasco et al., 2021; Duffy & Beauchamp, 2011; James et al., 2023). Therefore, future assessments of release strategies should evaluate whether increases in out-migration survival afforded by a given release strategy are carried over to early marine life or are offset by a potential mismatch with marine conditions. However, maximizing marine survival and adult returns may not be the only hatchery goal, and it is important to assess how factors beyond survival (e.g., age and size at return) are influenced by release strategies. For example, increasing evidence suggests that age at return decreases with greater juvenile size at release, a pattern with significant ecological and economic implications (Bosch et al., 2023; Gallinat et al., 2023). Finally, streamflow may be more important than the site or date of release in influencing out-migration survival in streams similar to the Toquaht River. Given that our study was limited to a single year, additional release experiments across multiple years are required to evaluate interannual variability and the impacts of release strategies on adult return outcomes (i.e., abundance, age and size distributions).
The complex dynamics involved in each population, river, and enhancement program require research focused on specific facilities and objectives, whereas a changing climate requires continual reevaluation of hatchery practices and an informed and adaptive approach to future salmonid management (James et al., 2023). Recognizing the immense diversity of rivers and salmonid populations and that there is no one-size-fits-all approach, carrying out projects in understudied regions is an important step in the future of salmonid enhancement and recovery planning.
SUPPLEMENTARY MATERIAL
Supplementary material is available at Transactions of the American Fisheries Society online.
DATA AVAILABILITY
Data collected in this study as well as code used to process and analyze the data and model output are available at https://github.com/eogmartins/balfour-et-al-2025-tafs and https://doi.org/10.5281/zenodo.14984681.
ETHICS STATEMENT
This research met the ethical guidelines and legal requirements of Canada and followed the guidelines of the Canadian Council on Animal Care. Fish handling and tagging procedures were approved by the University of Northern British Columbia Animal Care and Use Committee (protocol 2021-04) and were carried out under a Fisheries and Oceans Canada Aquaculture license AQSEP 129556.
FUNDING
This project was funded by the Toquaht Nation Government, Mitacs, Clayoquot Biosphere Trust, Pacific Salmon Foundation, and Natural Sciences and Engineering Research Council of Canada (through a Discovery Grant to E.G.M.). In-kind support was provided by Fisheries and Oceans Canada, British Columbia Conservation Foundation, Thornton Creek Enhancement Society, and Redd Fish Restoration Society. Our research was enabled in part by the support provided by the University of Waterloo’s Graham computing system and the Digital Research Alliance of Canada (alliancecan.ca).
ACKNOWLEDGMENTS
We thank the Toquaht Nation for welcoming us into their territory and trusting us to conduct this research. We would also like to thank our field team of Emily Fulton, James Costello, Miles Downsbrough, Collin Middleton, Christian Carson, and Kaylyn Kwasnecha, who were instrumental in executing this project. We want to thank Drs. Mark Shrimpton, Erin Rechisky, and Cameron Freshwater for their suggestions during the study and the review of this work. Dr. Scott Hinch and two anonymous reviewers provided helpful comments on our manuscript.
REFERENCES
Author notes
CONFLICTS OF INTEREST: None declared.
