


Abstract
A prominent question in animal research is how the evolution of morphology and ecology interacts in the generation of phenotypic diversity. Spiders are some of the most abundant arthropod predators in terrestrial ecosystems and exhibit a diversity of foraging styles. It remains unclear how spider body size and proportions relate to foraging style, and if the use of webs as prey capture devices correlates with changes in body characteristics. Here, we present the most extensive data set to date of morphometric and ecological traits in spiders. We used this data set to estimate the change in spider body sizes and shapes over deep time and to test if and how spider phenotypes are correlated with their behavioral ecology. We found that phylogenetic variation of most traits best fitted an Ornstein–Uhlenbeck model, which is a model of stabilizing selection. A prominent exception was body length, whose evolutionary dynamics were best explained with a Brownian Motion (free trait diffusion) model. This was most expressed in the araneoid clade (ecribellate orb-weaving spiders and allies) that showed bimodal trends toward either miniaturization or gigantism. Only few traits differed significantly between ecological guilds, most prominently leg length and thickness, and although a multivariate framework found general differences in traits among ecological guilds, it was not possible to unequivocally associate a set of morphometric traits with the relative ecological mode. Long, thin legs have often evolved with aerial webs and a hanging (suspended) locomotion style, but this trend is not general. Eye size and fang length did not differ between ecological guilds, rejecting the hypothesis that webs reduce the need for visual cue recognition and prey immobilization. For the inference of the ecology of species with unknown behaviors, we propose not to use morphometric traits, but rather consult (micro-)morphological characters, such as the presence of certain podal structures. These results suggest that, in contrast to insects, the evolution of body proportions in spiders is unusually stabilized and ecological adaptations are dominantly realized by behavioral traits and extended phenotypes in this group of predators. This work demonstrates the power of combining recent advances in phylogenomics with trait-based approaches to better understand global functional diversity patterns through space and time. [Animal architecture; Arachnida; Araneae; extended phenotype; functional traits; macroevolution; stabilizing selection.]
An important goal in macroevolution is to disentangle the relative effects of ecological adaptation and phylogenetic history on the shapes and functions of organisms. Adaptations to ecological niches can be reflected in morphological or behavioral traits, and it is highly debated, which of these governs phenotypic diversification processes. On the one hand, if adaptation is primarily reflected in behavioral traits, it could relax selection pressures that stabilize body morphologies or physiologies (Huey et al. 2003; Odling-Smee et al. 2003). On the other hand, behavioral evolution may be highly constrained by body morphology, leading to strong correlations between both (Wolff et al. 2019).
Few general macro-evolutionary patterns in morphometric evolution have been established, and most of this work has been performed on vertebrate lineages. For instance, based on the comparison of vertebrate fossil series, it was suggested that body size tends to increase along lineages over time (Cope’s rule) (Stanley 1973; Alroy 1998; Benson et al. 2018). On the other hand, trends toward body miniaturization are not uncommon and often correlated with specific niches and foraging styles (Hanken and Wake 1993). However, it is unclear how general such trends are, and under which circumstances they might be reversed. Therefore, perspectives from different invertebrate lineages are needed.
Uncovering the relationship between (easy to measure) morphometric and ecological traits is not only of central importance to understand mechanisms of adaptations. It also plays a key role in current biodiversity research with the building of large-scale databases of species traits and trait-based approaches to understand biosystem functions (Gallagher et al. 2020; Lowe et al. 2020). Here, often morphological traits are included as ‘functional’ traits, that is, traits that indicate a specific ecological function of the species. This is done as morphological data are usually more accessible and available than behavioral or species interaction data. Morphological traits are also used in palaeontology to infer information on the ecology of extinct species. All these approaches have underlying assumptions, which are rarely rigorously tested.
Here, we tested if and how ecological guilds are reflected by morphometric data in spiders. Spiders are a hyper-diverse order of arthropods with a world-wide dominance in many ecological communities (Nyffeler and Birkhofer 2017). Spiders—in contrast to insects, or other arachnids such as mites—are almost exclusively predators and thus play a designated role within communities. However, they are remarkably diverse in their prey capture strategies and trophic niches (Pekár et al. 2017). Many spiders are tiny and feed on small insects while others belong to the largest terrestrial arthropods and regularly feed on small vertebrates (Nentwig 1987; Valdez 2020). Approximately half of all spider species capture prey with the help of webs, traps, and snares (i.e., extended prey capture devices), while the other half barely relies on silk for prey capture, using primarily fine-tuned senses, powerful legs, adhesive pads, and spines to capture prey (Barth 2002; Blackledge et al. 2009b; Wolff et al. 2013; Eggs et al. 2015). This makes spiders a perfect model system to study the relationship between morphology and behavior in evolution.
Webs are a physical product of the innate construction behavior of spiders and are thus easy to observe. The webs are also part of the spiders’ environment to which each species is adapted. For instance, requirements to the locomotor apparatus differ fundamentally between movements in webs and on hard substrates (Moya-Laraño et al. 2008). Depending on the foraging style, the investment into different body parts may also differ significantly (Blackledge et al. 2009a). Although some studies have tested the correlation between single morphometric and behavioral traits, it is poorly understood how strongly body shape and body size evolution are linked with the evolution of ecological niches and foraging behavior in spiders.
To describe the role of spider species in ecological communities, they are usually separated into guilds. Guild definitions are typically based on behavioral traits, such as the presence and shape of the constructed webs or the locomotor activity and microhabitat use (Uetz et al. 1999; Cardoso et al. 2011). As species-specific information on behavioral traits is often limited, species are often assigned to guilds based on information of their closest known relatives, which may be inaccurate due to interspecific variation of niches. Morphometric data are available for a much higher number of species, including rare and fossil species, for which no behavioral observations can usually be made. However, it is unclear if and how guilds correlate with distinct morphospaces.
Here, we compiled a database of morphometric and ecological traits for 828 species of spiders, including 114 families and 690 genera, to disentangle the effects of phylogenetic history and foraging mode on the evolution of diverse morphometric traits, such as body size, carapace shape, leg length, and eye size. We used this database to address the following questions:
How strongly is the evolution of morphometric traits constrained by phylogenetic history? Was there a disparate evolution of morphometric traits in different lineages of spiders?
Are there distinct morphospaces that correlate with foraging ecology (i.e., ecological guilds)?
Which morphometric traits (or combinations of morphometric traits) are adaptations to foraging styles?
Which clades show extreme expressions of morphometric traits and do they relate to different ecologies?
Does the use of webs as extended prey capture devices correlate with a distinct evolution of body morphologies?
1. Methods
Trait Database
Taxon sample
We built a database of morphometric and ecological data on a representative taxon sample of the order Araneae. We followed the taxon sample of the Araneae Tree of Life project (AToL) (Wheeler et al. 2017), which was designed to cover all of, at that time, accepted spider families (except Synaphridae), as well as a representation of intrafamilial diversity (932 terminals in total) with wide geographic coverage. Historically, arachnologists often have erected families based on overall morphology and life-history traits. More recently, the monophyly criterion has provided a requirement, but monophyly is often used in classifications in combination with some idea of the phenotypic gap needed to “deserve” family status. For these reasons, we argue that, by design, the AToL taxon sample provides an excellent pragmatic compromise to address spider morphological and ecological variability.
AToL terminals that were not identified to species level and on which no image material was available were replaced with described congeneric species with a type locality close to the collection site (26.3|$\%$| of the used sample; details in S1 of the Supplementary material available on Zenodo at https://doi.org/10.5281/zenodo.5772110). Eleven percentage of the AToL terminals were omitted as there was not enough information to determine a suitable replacement. Our final database included a total of 828 species.
Character assembly
The morphological data were assembled by data extraction from taxonomic descriptions using the literature database of the World Spider Catalog (Nentwig et al. 2015) and from measurements of images published in articles, online repositories, or captured de novo, with one to seven sources combined per species (for details see S1 of the Supplementary material available on Zenodo). Only the data of adult females were used, as many spiders exhibit a significant sexual dimorphism. Adult male spiders often have smaller body sizes, relatively longer legs, and a broader carapace than females. However, these differences are fully expressed only with the final moult, and no major differences in body part proportions between sexes exist until the subadult stage, suggesting that with the exception of total body length, our results largely hold for most instars in females and in males, too.
The following characters were recorded (Fig. 1; all measurements in mm): 1) body length (total body length from carapace frontal excl. chelicerae to opisthosoma posterior excl. spinnerets); 2) carapace length (carapace length from frontal to posterior excl. chelicerae); 3) carapace width (carapace width at widest point); 4) prosoma (cephalothorax) height (prosoma height between sternum and highest point of carapace); 5) paturon length (length of cheliceral basal segment between condyles); 6) fang length (length of cheliceral fang following an arc along the center from condyle to tip); 7) AME diameter (diameter of one anterior median eye; if eye is oval, the mean of long and short diameter); 8) ALE diameter (diameter of one anterior lateral eye, as char.7); 9) PME diameter (diameter of one posterior median eye, as char.7); 10) PLE diameter (diameter of one posterior lateral eye, as char.7); 11) L1 length (total length of leg I (front leg) excluding coxa, trochanter and pretarsus); 12) femur 1 length (femur length between condyles of leg I); 13) patella 1 length (patella length of leg I between condyles); 14) tibia 1 length (tibia length of leg I between condyles); 15) metatarsus 1 length (metatarsus length of leg I between basal condyle and distal articulation); 16) tarsus 1 length (tarsus length of leg I between basal articulation and distal condyles); 17–35) lengths of legs II-IV and their segments, as chars.11–16; 36) femur 1 width (width of leg I femur at widest point in lateral view); 37) tibia 1 width (width of leg I tibia at middle point in lateral or dorsal view); 38) femur 4 width (as char.36 for leg IV); 39) tibia 1 width (as char.37 for leg IV); 40) opisthosoma length (length of opisthosoma from anterior to posterior excl. petiolus and spinnerets); 41) opisthosoma width (width of opisthosoma at widest point); 42) opisthosoma height (height of opisthosoma at highest point); and 43) PLS length (length of posterior lateral spinnerets from proximal base to tip).
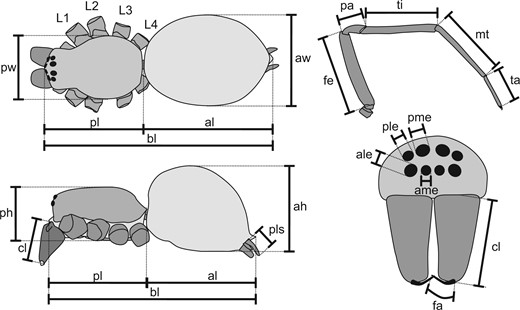
Schematic illustration of recorded morphometric variables. ah, height of abdomen (opisthosoma); al, length of abdomen (opisthosoma); ale, diameter of anterior lateral eye; ame, diameter of anterior median eye; aw, width of abdomen (opisthosoma); bl, body length; cl, length of cheliceral base segment (paturon); fa, length of fang (distal cheliceral segment); fe, femur; L1, leg I (anterior walking leg); L2, leg II; L3, leg III; L4, leg IV (posterior walking leg); mt, metatarsus; pa, patella; ph, height of prosoma (cephalothorax); pl, length of prosoma (cephalothorax); ple, diameter of posterior lateral eye; pls, length of posterior lateral spinneret; pme, diameter of posterior median eye; pw, width of prosoma (cephalothorax); ta, tarsus; ti, tibia.
Generation of morphometric trait matrix
From these metric characters, the following 20 traits were calculated: (|$\#$| 1) body length; (|$\#$| 2) carapace shape (carapace width/carapace length); (|$\#$| 3) relative prosoma height (prosoma height/[carapace length |$+$| width]); (|$\#$| 4) relative paturon length (paturon length/prosoma height); (|$\#$| 5) relative fang length (fang length/paturon length); (|$\#$| 6) eye size (sum of diameters of all eye types/carapace width); (|$\#$| 7) anterior lateral eye enlargement (ALE diameter/AME diameter); (|$\#$| 8) anterior/posterior eyes ([AME diameter |$+$| ALE diameter]/[PME diameter |$+$| PLE diameter]); (|$\#$| 9) relative leg length (L1 length/carapace width); (|$\#$| 10) front leg difference (L1 length/L2 length); (|$\#$| 11) tibia/femur (tibia 1 length/femur 1 length); (|$\#$| 12) leg width (tibia 1 width/tibia 1 length); (|$\#$| 13) femur thickening (femur 1 width/tibia 1 width); (|$\#$| 14) front leg elongation (L1 length/L4 length); (|$\#$| 15) hind leg difference (L3 length/L4 length); (|$\#$| 16) metatarsus elongation (metatarsus 4 length/tibia 4 length); (|$\#$| 17) tarsus elongation (tarsus 4 length/metatarsus 4 length); (|$\#$| 18) opisthosoma shape (opisthosoma length/opisthosoma width); (|$\#$| 19) relative opisthosoma height (opisthosoma height/prosoma height); and (|$\#$| 20) spinneret length (PLS length/[carapace length |$+$| width]). From each trait the species mean was calculated and log-transformed, to build the species matrix for further analysis (S4 of the Supplementary material available on Dryad at https://doi.org/10.5061/dryad.2280gb5rz).
Generation of ecological trait matrix
The ecological data matrix was built by assessing the literature on the same or closely related species, in a few cases complemented by personal observations (for details, see S3 of the Supplementary material available on Dryad). We used six categories of guilds (G1–6), that represent different exposure to environmental factors and physiological requirements.
G1, burrow or tube web: a species that spends most of its life in a self-constructed burrow or silken tube, from which it hunts and in which it mates. Such tubes may be equipped with radial signal lines or have a short silken extension around the entrance, but the tube makes the main fraction of the web. Examples of spiders belonging to this category are species belonging to Liphistiidae, Nemesiidae (Fig. 2b), and Segestriidae (Fig. 2c).
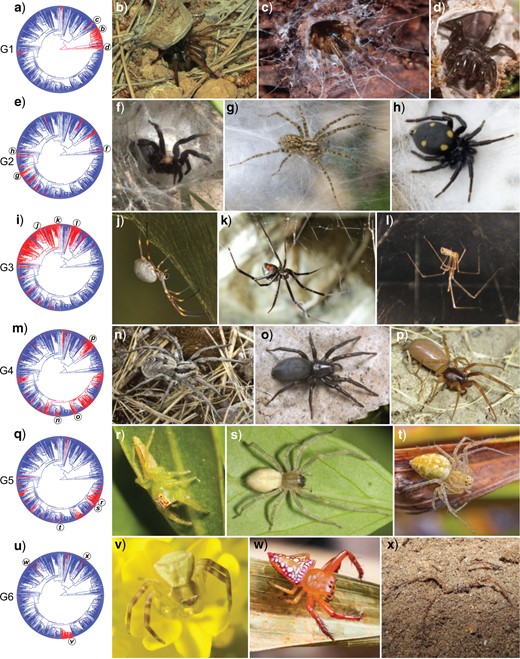
Ecological guilds of spiders. a, e, i, m, q, u) Phylogeny of Araneae with ecological guild state mapped in red. Please note that these character maps do not necessarily reflect guild evolution, as some states—even in sister taxa—may not be homologous, and as deep time inference of character states is subject to a high degree of uncertainty. Photos to the right show exemplary species representing analogous guild states. Letters in the phylogenetic tree indicate the phylogenetic position of the displayed species. a–d) G1 (Guild 1) – burrow or tube web: b) Iberesia sp. (Nemesiidae), a spider building a silk lined burrow closed with a cork-lid trap door; and c) Segestria senoculata (Segestriidae), a spider building a silken tube in empty insect holes or under loose bark, with radial signal lines; d) Atypus piceus (Atypidae), a spider building a silk lined burrow that extends into a silken tube above the ground. e–h) G2 (Guild 2)—substrate bound web: f) Ischnothele annulata (Dipluridae), a spider that builds a dense funnel web in vegetation; g) Tegenaria sp. (Agelenidae), a spider that builds a dense funnel web amongst stones; and h) Uroctea durandi (Oecobiidae), a spider that builds a tent-like sheet web with radial signal lines under stones. i–l) G3 (Guild 3)—aerial web: j) Trichonephila plumipes (Araneidae), an orb web spider; k) Latrodectus hasselti (Theridiidae), a spider building a cob web with gumfoot threads; and l) Pholcus phalangioides (Pholcidae), a spider building a cob web with gumfoot threads. m–p) G4 (Guild 4)—ground runner: n) Lycosa praegrandis (Lycosidae), a wolf spider; o) Gnaphosa montana (Gnaphosidae); and p) Harpactea rubicunda (Dysderidae). q–t) G5 (Guild 5)—foliage runner: r) Mopsus mormon (Salticidae), a tree dwelling jumping spider; s) Cheiracanthium mildei (Cheiracanthiidae); t) Oxyopes sp. (Oxyopidae), a lynx spider. u–x) G6 (Guild 6)—web-less ambusher: v) Thomisus onustus (Thomisidae), a crab spider that ambushes on flowers; w) Arkys lancearius (Arkyidae), a nocturnal ambusher on trees; and x) Sicarius ornatus (Sicariidae), an ambusher in sand. Photos (d), (g), (h), (n), (o), (p), (v), and (w) by Arno Grabolle, (f) and (x) by Ivan Magalhães, (j), (k), and (r) by Jim McLean, (b) by Siegfried Huber, and (c) by Jörg Pageler, used with kind permissions (color version online only).
G2, substrate-bound web: a species that dwells in a self-constructed substrate-bound web. Such webs may consist of a planar sheet or a more three-dimensional structure but are distinguished from aerial webs by being closely connected to substrate surfaces and their overall shape and structure being highly determined by the surface topography. Substrate-bound webs may be connected to a tubular or funnel-like retreat in the substrate, but in contrast to the tube web, the sheet comprises the majority of the web surface area. The spiders usually walk on top of the sheet when moving through the web, but some hang. Examples of spiders belonging to this category are species belonging to Dipluridae (Fig. 2f), Agelenidae (Fig. 2g), or the web building wolf spider genus Aglaoctenus.
G3, aerial web: a species that dwells in a web that is suspended between habitat structures. Aerial webs may be planar or three-dimensional, but in contrast to substrate bound webs, they are anchored to the substrate only by few lines and their overall architecture is more stereotypic and less determined by the substrate structure. Spiders of this category typically move in a suspended (hanging) position (upside-down or vertically). Typical examples of spiders belonging to this category are orb-weaving species of Araneidae (Fig. 2j) or Uloboridae, the cobweb building species of Theridiidae (Fig. 2k) and Pholcidae (Fig. 2l), and the suspended sheet web-building species of Linyphiidae. Obligatory web invaders and kleptoparasites (i.e., that exploit foreign webs) were included in this category, as such spiders primarily rest and move in aerial webs and hence likely are subject to the same biomechanical rules as the aerial web builders.
G4, ground runner: a species that spends most of its time on the ground, outside of a self-constructed structure. Such species may hunt on a variety of microhabitats or be specialized to a particular microhabitat niche. They actively search and pursue their prey and rarely do climb on elevated structures. Typical examples of spiders belonging to this category are most species of wolf spiders (Lycosidae, Fig. 2n; Gnaphosidae, Fig. 2o; and Dysderidae, Fig. 2p).
G5, foliage runner: a species that spends most of its time on elevated structures such as grasses, trees and bushes, outside of a self-constructed structure. Such species may hunt on a variety of microhabitats or be specialized to a particular microhabitat niche. They actively search and pursue their prey and are rarely found on the ground. Typical examples of spiders belonging to this category are most species of jumping spiders (Salticidae, Fig. 2r), sac spiders (Cheiracanthiidae, Fig. 2s), and lynx spiders (Oxyopidae, Fig. 2t).
G6, ambusher: a species that spends most of its time outside a self-constructed structure, and does not actively search for prey (i.e., that show little locomotory activity). Such species often are (although not exclusively) specialized to forage on a particular microhabitat structure (such as flowers) to which they are visually adapted by camouflage. This may be a structure on the ground or in the vegetation. Typical examples of spiders belonging to this category are many species of crab spiders (Thomisidae, Fig. 2v).
Phylogenetic Inference
We used the same sequences of six markers (12S, 16S, COI, histone H3, 18S, and 28S) from the AToL study (Wheeler et al. 2017). Each marker was aligned with MAFFT (Katoh et al. 2019) with default parameters. We made a list of topological constraints for clades supported in the most recent phylogenomic studies of spiders (Kulkarni et al. 2021; Maddison et al. 2017; Opatova et al. 2020; Ramírez et al. 2020) (see S5 of the Supplementary material available on Zenodo for details). The sequence data were analyzed with IQ-TREE 2.1.2 (Minh et al. 2020), allowing each partition to have its own substitution rate (Chernomor et al. 2016). We used the models GTR |$+$| F |$+$| R8 (12S), GTR |$+$| F |$+$| R10 (16S), TIM2e |$+$| R9 (18S), GTR |$+$| F |$+$| R10 (28S), GTR |$+$| F |$+$| R10 (COI), TVM |$+$| F |$+$| R10 (H3), as selected by ModelFinder (Kalyaanamoorthy et al. 2017), and calculated the maximum likelihood tree enforcing the above-mentioned topological constraints. To account for phylogenetic uncertainty, we saved 1000 ultrafast bootstrap trees (Hoang et al. 2018) for subsequent analyses.
We randomly selected 100 trees from the 1000 bootstrap samples and transformed each to an ultrametric chronogram with treePL (Smith and O’Meara 2012) using secondary calibrations, taken from the minimum and maximum ages of the 95|$\%$| highest posterior density interval of 40 dating points from the fossil-based chronogram of spiders of Magalhaes et al. (2020), as corresponding to our tree (see S6 of the Supplementary material available on Zenodo for details), plus an age for the root taken for Arachnida (432.6–636.1 Ma) from Wolfe et al. (2016). We used a smoothing parameter of 0.001, selected by cross-validation in treePL between 1000 and 1e-10.
Comparative Analysis
Before each analysis, all terminals with missing data were dropped.
Test of the global evolutionary dynamics of traits
To determine, if morphometric traits in spiders globally evolve by random drift, stabilized, with decelerating rates or with a trend, we compared the fit of the following basic models: the Brownian Motion model (BM; “random drift” model of unconstrained evolution at a global rate; Felsenstein 1973), the Ornstein–Uhlenbeck model (OU; extension of BM model assuming that evolution is stabilized around an optimal trait value; Butler and King 2004), the Early Burst model (EB; BM with a deceleration of the evolutionary rate; Harmon et al. 2010), a model assuming a linear change of evolutionary rates through time (trend), and the white noise model (white; a null-model where trait distribution is independent of phylogenetic history). As we were interested in the global dynamics or trait evolution in spiders, we excluded more complex models such as multi-regime Ornstein–Uhlenbeck models or Lévy processes that are generally harder to interpret and may tend to overfit (Ingram and Mahler 2013; Landis and Schraiber 2017). We compared the fit of different alternative models of trait evolution for each continuous trait globally for the entire tree, by calculating the corrected Akaike Information Criterion weights (AICcW) of model fits with geiger 2.0.7 (Pennell et al. 2014).
Macroevolutionary landscape in Araneoidea
To test the hypothesis that body size evolved around two adaptive peaks (miniaturization and female gigantism) in the Araneoidea, the FPK model of Boucher et al. (2018) was used with the maximum likelihood approach implemented in the |$R$| package BBMV (Boucher 2019). In contrast to BM and OU, the FPK (Fokker–Planck–Kolmogorov) model allows for the fitting of adaptive landscapes with two peaks using polynomial functions. We used the BBMV model (FPK model with bounds) and specified the phenotypic bounds at |$-$|0.5 and 2.0 (i.e., representing the lower and upper limits of body size evolution). Model fit was compared with BM and OU models by calculating the AICcW as described above. For comparison, we ran a similar analysis for the RTA clade, for which no such divergent trends in body size evolution are hypothesized.
Ancestral character estimation (ACE)
ACE was performed using the ace function in ape (Paradis et al. 2004). In the case of traits for which the OU model was the best fit, the phylogeny was first alpha-transformed, and for those in which the EB model was the best fit the phylogeny was first |$a$|-transformed, before conducting the ACE. Phylogenetic mapping of each trait history was performed with the contMap function in phytools (Revell 2012), manually assigning the calculated ACE values to each node.
Phylogenetic signal
To assess the phylogenetic signal of each trait, Pagel’s |$\lambda $| was calculated (Pagel 1999).
Comparison of trait means between guilds
We compared the individual trait means between ecological guilds using the phylogenetic ANOVA (Garland et al. 1993) as implemented in phytools, with post hoc tests by phylogenetic simulations with 1000 iterations and Bonferroni correction. Furthermore, we tested the fit of comparisons of the combined multivariate data between guilds, which was done with phylogenetic MANOVAs in mvmorph (Clavel and Morlon 2020). This was performed on the combined data sets containing 2 traits of 749 species, 6 traits of 340 species, or 16 traits of 213 species. Traits for the combined data sets were chosen to reflect the morphology of different body parts and only include one of two highly correlated traits (such as leg length and leg width) to achieve a balanced representation of spider morphology, while minimizing sampling gaps due to incomplete data (i.e., maximizing the number of included species with complete data). Phylogenetic principal component analysis (pPCA) was performed in mvmorph to further explore the occupation of guilds in the global trait space.
Sensitivity analysis
We assessed the effect of phylogenetic uncertainty by summarizing the results of geiger analyses, the phylogenetic signal, and pANOVAs across a sample of 100 trees with variation in topology and divergence times, using an adaptation of the approach implemented in package sensiPhy (Paterno et al. 2018). The results were visualized by plotting estimates across 100 trees (i.e., phylogenetic uncertainty) together with boxplots to illustrate median values and parameter dispersion due to variations in phylogenetic trees.
Results
Strong Phylogenetic Signal and Ornstein–Uhlenbeck Fit for Most Traits
Comparison of evolutionary models showed that the evolutionary dynamics of most morphometric traits was best explained with an Ornstein–Uhlenbeck model (Table 1). Exceptions were body length (trait |$\#$| 1) and spinneret length (|$\#$| 20), whose evolution best fitted the Brownian Motion model, and the evolution of relative leg length (|$\#$| 9), leg thickness (|$\#$| 12) and tarsus elongation (|$\#$| 17), which were best explained with an Early Burst or a trend model.
Comparison of evolutionary model fit|$^{a}$| for global continuous traits
| |$\#$| | Trait | BM | OU | EB | Trend | White | Model parameters |
|---|---|---|---|---|---|---|---|
| 1 | Body length | 0.5541* | 0.2023 | 0.2431 | 0.0004 | 0.0000 | BM: |$\gamma ^{2} =$| 4.76E|$^{-4}$| |
| 2 | Carapace shape | 0.0000 | 0.9929* | 0.0000 | 0.0071 | 0.0000 | OU: |$\gamma ^{2} =$| 0.50E|$^{-4}$|; |$\alpha =$| 4.15E|$^{-3}$| |
| 3 | Rel. prosoma height | 0.0000 | 1.0000* | 0.0000 | 0.0000 | 0.0000 | OU: |$\gamma ^{2} =$| 2.84E|$^{-4}$|; |$\alpha =$| 7.47E|$^{-3}$| |
| 4 | Rel. paturon length | 0.0021 | 0.8858* | 0.0008 | 0.1113 | 0.0000 | OU: |$\gamma ^{2} =$| 2.27E|$^{-4}$|; |$\alpha =$| 4.15E|$^{-3}$| |
| 5 | Rel. fang length | 0.2585 | 0.3413* | 0.0931 | 0.3071 | 0.0000 | OU: |$\gamma ^{2} =$| 1.70E|$^{-4}$|; |$\alpha =$| 1.89E|$^{-3}$| |
| 6 | Eye size | 0.0217 | 0.5882* | 0.0079 | 0.3822 | 0.0000 | OU: |$\gamma ^{2} =$| 1.80E|$^{-4}$|; |$\alpha =$| 2.44E|$^{-3}$| |
| 7 | Anterior lateral eye enlargement | 0.0113 | 0.8868* | 0.0041 | 0.0978 | 0.0000 | OU: |$\gamma ^{2} =$| 2.90E|$^{-4}$|; |$\alpha =$| 2.57E|$^{-3}$| |
| 8 | Anterior/posterior eyes ratio | 0.0004 | 0.9568* | 0.0001 | 0.0427 | 0.0000 | OU: |$\gamma ^{2} =$| 2.48E|$^{-4}$|; |$\alpha =$| 3.46E|$^{-3}$| |
| 9 | Rel. leg length | 0.2216 | 0.0808 | 0.6976* | 0.0000 | 0.0000 | EB: |$\gamma ^{2} =$| 4.82E|$^{-4}$|; a |$=$||$-$|2.78E|$^{-3}$| |
| 10 | Front leg difference | 0.0006 | 0.8809* | 0.0002 | 0.1182 | 0.0000 | OU: |$\gamma ^{2} =$| 0.46E|$^{-4}$|; |$\alpha =$| 3.37E|$^{-3}$| |
| 11 | Tibia/femur | 0.0000 | 0.9987* | 0.0000 | 0.0013 | 0.0000 | OU: |$\gamma ^{2} =$| 0.59E|$^{-4}$|; |$\alpha =$| 3.98|$^{-3}$| |
| 12 | Leg width | 0.0075 | 0.0027 | 0.9898* | 0.0000 | 0.0000 | EB: |$\gamma ^{2} =$| 26.47E|$^{-4}$|; a |$=$||$-$|5.76E|$^{-3}$| |
| 13 | Femur thickening | 0.0104 | 0.9114* | 0.0038 | 0.0744 | 0.0000 | OU: |$\gamma ^{2} =$| 0.82E|$^{-4}$|; |$\alpha =$| 3.08E|$^{-3}$| |
| 14 | Front leg elongation | 0.0000 | 0.9826* | 0.0000 | 0.0174 | 0.0000 | OU: |$\gamma ^{2} =$| 0.98E|$^{-4}$|; |$\alpha =$| 3.60E|$^{-3}$| |
| 15 | Hind leg difference | 0.0000 | 0.9999* | 0.0000 | 0.0000 | 0.0001 | OU: |$\gamma ^{2} =$| 1.60E|$^{-4}$|; |$\alpha =$| 11.80E|$^{-3}$| |
| 16 | Metatarsus elongation | 0.0116 | 0.8447* | 0.0042 | 0.1394 | 0.0000 | OU: |$\gamma ^{2} =$| 0.93E|$^{-4}$|; |$\alpha =$| 2.18E|$^{-3}$| |
| 17 | Tarsus elongation | 0.2767 | 0.1008 | 0.3460* | 0.2765 | 0.0000 | EB: |$\gamma ^{2} =$| 3.46E|$^{-4}$|; a |$=$| -2.05E|$^{-3}$| |
| 18 | Opisthosoma shape | 0.0000 | 1.0000* | 0.0000 | 0.0000 | 0.0000 | OU: |$\gamma ^{2} =$| 2.08E|$^{-4}$|; |$\alpha =$| 7.72E|$^{-3}$| |
| 19 | Rel. opisthosoma height | 0.0000 | 0.9748* | 0.0000 | 0.0251 | 0.0000 | OU: |$\gamma ^{2} =$| 2.72E|$^{-4}$|; |$\alpha =$| 5.10E|$^{-3}$| |
| 20 | Spinneret length | 0.4112* | 0.2317 | 0.1484 | 0.2087 | 0.0000 | BM: |$\gamma ^{2} =$| 3.85E|$^{-4}$| |
Notes: BM, Brownian Motion (Felsenstein 1973); OU, Ornstein–Uhlenbeck (Butler and King 2004); EB, Early Burst (Harmon et al. 2010); trend, diffusion model with a continuous trend (i.e., gradual increase or decrease of evolutionary rates through time); white, white noise (null model, i.e., no phylogenetic covariance). Asterisks (*) and bold font mark the preferred model. Inferred parameters of the preferred model are given in the right column.
|$^{\rm a}$|Corrected Akaike information criterion weights of model fit per trait, as estimated by the fitContinuous function in geiger 2.0.7. Intraspecific variation was included in the fit of body length, but not for other traits due to the restricted number of observations. All trait data were log-transformed prior to analysis. Model fit is given for the analysis on the consensus tree—for a summary of the statistics across alternative phylogenies see Figure 3.
For all Ornstein–Uhlenbeck models, the inferred phylogenetic half-life was well below the tree height (ranging from |$t_{1/2}/T = 0.771$| in trait |$\#$| 5 to |$t_{1/2}/T = 0.124$| in trait |$\#$| 15), which represents a moderate to strong adaptive pull (Cooper et al. 2016). Generally, the evolution of prosoma, opisthosoma, and hind leg morphology seems to be more constrained than the evolution of mouthpart, eye, and front leg morphology. The phylogenetic signal indicates the strength of phylogenetic correlation of the morphometric traits, that is, a high phylogenetic signal means that trait expression is highly conditional on phylogenetic history and related species are generally more similar than less related species. Most traits showed a high phylogenetic signal (i.e., Pagel’s |$\lambda > 0.75$|). Exceptions were traits describing the body flattening (|$\#$| 3, prosoma height, and |$\#$| 13, opisthosoma height), which showed a moderate phylogenetic signal (Table 2).
Tests for trait correlations
| |$\#$| | Trait | |$N$| | Pagel’s |$\lambda $| | |$P $|(guild)|$^{a}$| | Post hoc|$^{b}$| |
|---|---|---|---|---|---|
| 1 | Body length | 815 | 0.9951 | 0.177 | – |
| 2 | Carapace shape | 761 | 0.9160 | 0.679 | – |
| 3 | Rel. prosoma height | 437 | 0.6818 | 0.856 | – |
| 4 | Rel. paturon length | 376 | 0.8767 | 0.869 | – |
| 5 | Rel. fang length | 299 | 0.9391 | 0.605 | – |
| 6 | Eye size | 481 | 0.9508 | 0.288 | – |
| 7 | Anterior lateral eye enlargement | 456 | 0.9339 | 0.406 | – |
| 8 | Anterior/posterior eyes | 492 | 0.9312 | 0.794 | – |
| 9 | Rel. leg length | 641 | 0.9934 | 0.004** | G3–G4 (|$P =$| 0.015) |
| 10 | Front leg difference | 599 | 0.9228 | 0.187 | – |
| 11 | Tibia/femur | 602 | 0.8565 | 0.172 | – |
| 12 | Leg width | 378 | 1.0017 | 0.038* | – |
| 13 | Femur thickening | 354 | 0.9025 | 0.551 | – |
| 14 | Front leg elongation | 642 | 0.9591 | 0.006** | G2–G3 (|$P = 0.045$|) G2–G6 (|$P = 0.060$|) G3–G4 (|$P = 0.015$|) G4–G6 (|$P = 0.015$|) G5–G6 (|$P = 0.030$|) |
| 15 | Hind leg difference | 612 | 0.9241 | 0.688 | – |
| 16 | Metatarsus elongation | 582 | 0.9255 | 0.699 | – |
| 17 | Tarsus elongation | 619 | 0.9854 | 0.790 | – |
| 18 | Opisthosoma shape | 635 | 0.8104 | 0.764 | – |
| 19 | Rel. opisthosoma height | 353 | 0.6782 | 0.006** | G3–G5 (|$P =$| 0.045) |
| 20 | Spinneret length | 322 | 0.9194 | 0.124 | – |
| Multivariate – 6 traits: 1, 2, 3, 4, 6, 9 | 340 | 0.9417 | 0.001** | G1–G3 (|$P =$| 0.078) G2–G3 (|$P = 0.096$|) G3–G4 (|$P = 0.015$|) G3–G6 (|$P = 0.015$|) | |
| Multivariate – 16 traits: 1, 2, 3, 4, 5, 6, 7, 8, 9, 10, 11, 13, 15, 17, 18, 19 | 213 | 0.9022 | 0.004** | G3–G4 (|$P = 0.056$|) G3–G6 (|$P = 0.015$|) |
|$^{a}P$|-values for the independence of each morphometric trait on ecological guilds (categorical trait with six unordered states) estimated with phylogenetic ANOVA or phylogenetic MANOVA (for multivariate data sets). All trait data were log-transformed prior to analysis. Significant correlations are marked with bold font and asterisks: *for |$\alpha = 0.1$|; **for |$\alpha = 0.01$|. |$N$|, number of species included with associated trait data.
|$^{b}$|Guild pairs with significantly different trait means (|$\alpha = 0.1$|), |$P$|-values estimated from post hoc tests by phylogenetic simulation with Bonferroni correction after Garland et al. (1993). G1, tube or burrow; G2, substrate bound web or sheet; G3, aerial (suspended) web; G4, ground runner (rarely climbing); G5, foliage runner (regularly climbing); G6, ambush hunter (mostly stationary, but without web).
All these results were robust toward phylogenetic uncertainty (Figs. 3 and 4), with the following exception. For the evolution of relative fang length (trait |$\#$| 5), in about 50|$\%$| of alternative phylogenies, the Brownian Motion model was preferred over the Ornstein–Uhlenbeck model.
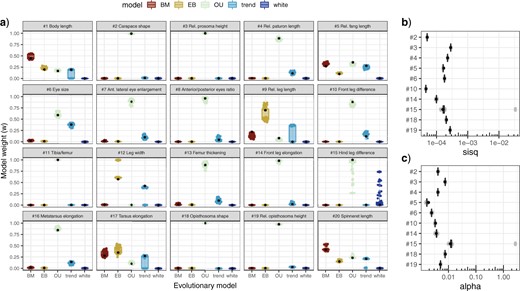
Fit of alternative evolutionary models for different morphometric traits. Plots report the variation of results from a sample of 100 alternative phylogenies (considering the uncertainty in divergence time estimation and local topology). Black dots indicate the results obtained from analyses using the consensus tree (as reported in Table 1). a) AICc weights per trait. b) |$\gamma ^{2}$| of fitted Ornstein–Uhlenbeck models for 10 exemplary traits. c) |$\alpha $| of fitted Ornstein–Uhlenbeck models for 10 exemplary traits (color version online only).
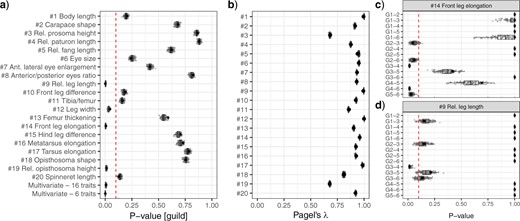
Phylogenetic signal and comparison of uni- and multi-variate trait means between guilds. Plots report the variation of results from a sample of 100 alternative phylogenies (considering the uncertainty in divergence time estimation and local topology). Black dots indicate the results obtained from analyses using the consensus tree (as reported in Table 2). a) |$P$|-value of phylogenetic ANOVAs and MANOVAs; the red (dashed vertical) line indicates a significance level of 0.1. b) Phylogenetic signal. c and d) |$P$|-values of pairwise comparisons for traits |$\#$| 9 and |$\#$| 14; the red (dashed vertical) line indicates a significance level of 0.1 (color version online only).
Differences between Guilds Are Almost Exclusively Expressed in Leg Morphology
For most morphometric traits, no differences between guilds could be established (Table 2 and Figs. 4 and 5). However, relative leg length (trait |$\#$| 9) and front leg elongation (|$\#$| 14) differed significantly between aerial web builders (G3) and ground runners (G4). Front leg elongation (|$\#$| 14) also differed between substrate web builders (G2) and aerial web builders (G2), between substrate web builders (G2) and ambushers (G6), between ground runners (G4) and ambushers (G6), and between foliage runners (G5) and ambushers (G6). This means, aerial web builders have, on average, longer legs and a higher front-to-hind leg ratio than substrate web builders and ground runners but are indistinguishable from other guilds. Ambushers have, on average, more elongated front legs than other cursorial spiders or substrate web builders but are indistinguishable from burrowers and aerial web builders. In addition, there was a significant difference in opisthosoma height (|$\#$| 19) between aerial web builders (G3) and foliage runners (G5). Moderate significance was also found for leg thickness (|$\#$| 12); however, post hoc pair-wise comparisons did not recover significant differences between guilds for an |$\alpha < 0.1$|.
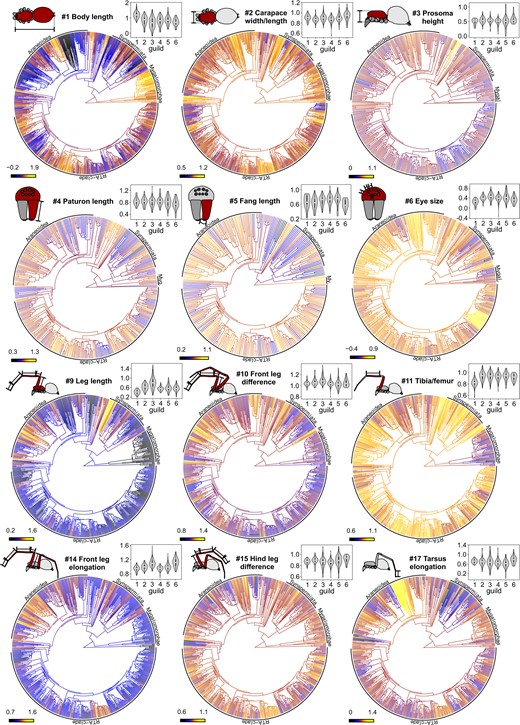
Phylogenetic distribution of trait states. Character history mapping of chosen log-transformed continuous traits (see caption and schematic symbol of trait) based on the best fitting model; dark shades indicate low trait values, and bright shades high trait values; major clades are indicated. Violin plots above display the trait distribution per guild (numbers 1–6 for Guild 1–Guild 6) (color version online only).
Multivariate combinations of traits differed between aerial web builders (G3) and all other guilds except foliage runners (G5) for the 6-trait data set, while for the 16-trait data set the difference was significant only between aerial web builders (G3) and ground runners (G4) and between aerial web builders (G3) and ambushers (G6) (Table 2). pPCA plots showed high overlap of the morphospaces with no distinct clusters recognizable (Fig. 6).
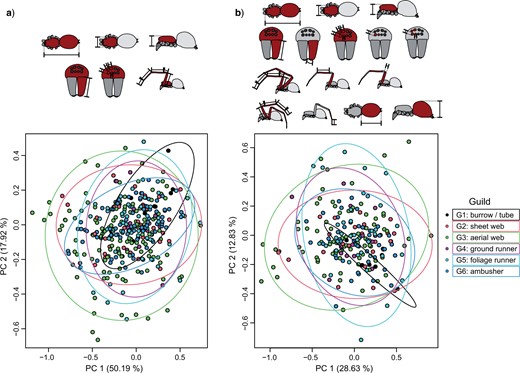
Morphometric trait space of spider guilds. Phylogenetic PCA plots, with each data point representing a species mean. Ellipses show the 0.95 confidence limit around the centroid of each guild. Schematic symbols above indicate traits covered by the shown data set. a) 6-trait data set, 340 species. b) 16-traits data set, 213 species (color version online only).
Extremes of Morphometric Trait Expressions Are Often Homoplasic
Expressions of most morphometric traits were rather evenly distributed across the phylogeny, with some exceptions (Fig. 5; for high-resolution traits maps with labeled tips, see S7 of the Supplementary material available on Zenodo). For instance, body size evolution tended to be more trended (or Brownian Motion like) in Mygalomorphae and Araneoidea (as seen by the higher lineage-specific divergence of trait values), and more mosaic in the RTA clade. This observation was investigated further using FPK models that allow the fitting of multimodal macroevolutionary landscapes. Mean functions of the macroevolutionary landscape resulting from maximum likelihood analyses showed two peaks (a small one at around 1 mm and a large one at around 30 mm) in Araneoidea and a single peak (at around 10 mm) in the RTA-clade (Fig. 7). In comparison with simpler models, the FPK model was strongly preferred in the Araneoidea (AICcW(FPK) |$= 0.9438$|; AICcW(BM) |$= 0.0151$|; AICcW(OU) |$= 0.0054$|; AICcW(EB) |$= 0.0203$|; AICcW(trend) |$=$| 0.0155; AICcW(white) |$=$| 0.0000), but only marginally preferred over the BM model in the RTA clade (AICcW(FPK) |$= 0.2784$|; AICcW(BM) |$= 0.2608$|; AICcW(OU) |$= 0.1859$|; AICcW(EB) |$= 0.0945$|; AICcW(trend) |$= 0.1804$|; AICcW(white) |$= 0.0000$|). This indicates that body size evolution follows a different evolutionary pattern in each clade.
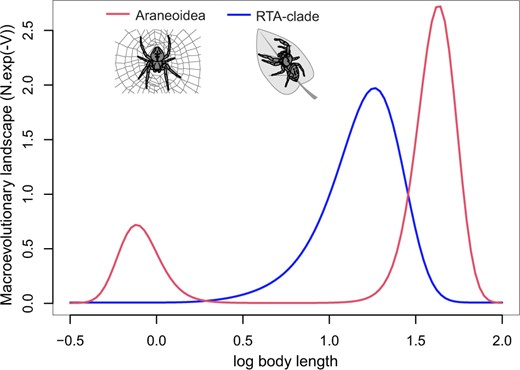
Macroevolutionary landscape of body length in spiders. Fitted FPK models for body size evolution in Araneoidea and the RTA clade. Macroevolutionary landscapes are represented by the polynomial functions using the average terms found in the maximum likelihood analysis (color version online only).
For most traits, there were no clades with exceptional expressions, and extreme (minimal or maximal) trait values were generally abundant or occurred on multiple convergent branches.
For body length (trait |$\#$| 1), minimal values were concentrated in lineages among Araneoidea, such as within Symphytognathidae, Mysmenidae, and Anapidae, all of which are aerial web builders and members of the “symphytognathoid” clade. The smallest body lengths outside Araneoidea were found in the Oonopidae, which are cursorial spiders. Exceptional maximal body lengths were found only in the Theraphosidae.
For carapace shape (trait |$\#$| 2), exceptional minimal values (i.e., slender prosomas) were found in two lineages of myrmecomorphic (ant-mimic) Corinnidae (Dionycha) lineages, while maximal values (i.e., wide prosomas) evolved independently within Oecobiidae, Thomisidae, and Trochanteriidae.
Prosoma height (trait |$\#$| 3) was a rather stable trait across the spider tree of life, with some remarkable localized deviations. Minimal values (i.e., flat bodies) occurred independently in the Philodromidae, Trochanteriidae, and Lamponidae. Exceptional maximal values (i.e., highly elevated carapaces) were unique to Archaeidae in which this trait correlates with highly elongated paturons.
For relative paturon length (trait |$\#$| 4) notable small values evolved within Thomisidae and Scytodidae, and large values in Tetragnathidae and Desidae.
Minimal relative fang lengths (trait |$\#$| 5) occurred in multiple lineages such as within Filistatidae, Segestriidae, Archaeidae, and Oxyopidae. Maximal fang length also occurred repeatedly, for example, in Gallieniellidae, Trochanteriidae, and Theridiidae (Euryopis).
Eye size (trait |$\#$| 6) was exceptionally small in species of Caponiidae that only possess two eyes (eyeless species were not included in our data set), and maximal in Salticidae. The ratio between anterior eyes (trait |$\#$| 7) was exceptional in Liphistiidae and Pholcidae (i.e., anterior lateral eyes much larger than anterior median eyes), while the opposite case (anterior median eyes much larger than anterior lateral eyes) was common and not restricted to single lineages. The anterior–posterior eye ratio (trait |$\#$| 8) was exceptionally low in some species of Eresidae, Deinopidae, and Cycloctenidae, and maximal in Salticidae.
For leg length (trait |$\#$| 9), minimal values were widespread (e.g., many Mygalomorphae, Thomisidae, Salticidae, Zodariidae, but also some Araneoidea) while maximal values were found within Pholcidae. The leg I to leg II ratio (trait |$\#$| 10) was minimal within Philodromidae (i.e., second leg pair longer than first leg pair) and maximal (i.e., first legs much longer than second legs) within Uloboridae (Miagrammopes) and Physoglenidae (Calcarsynotaxus). Leg I tibia to femur ratio (trait |$\#$| 11) tended to be smaller in Mesothelae and Mygalomorphae than in Araneomorphae. It was exceptionally small in Atypidae and maximal within Filistatidae and Mimetidae. Leg width (trait |$\#$| 12) was minimal in species of Archaeidae, Physoglenidae, and Synotaxidae. Leg width was maximal in Atypidae and a burrowing species of Zodariidae (Cryptothele). Femur thickening (trait |$\#$| 13) was minimal in various lineages and exceptionally high in Archaeidae and a species of Mecysmaucheniidae (Aotearoa).
Front leg elongation (trait |$\#$| 14) was minimal in various lineages and exceptionally high in a species of Cyatholipidae (Ulwembua). Leg III-to-IV ratio (trait |$\#$| 15) was exceptionally small (i.e., third leg pair highly shortened) in Hersiliidae, some Theridiidae and within Zodariidae, and exceptionally high (i.e., third legs longer than fourth legs) within Theridiosomatidae. Metatarsus elongation in the hind leg (trait |$\#$| 16) was minimal within Archaeidae and Anapidae and exceptionally high in some Zodariidae. Tarsus elongation in the hind leg (trait |$\#$| 17) was minimal in Hersiliidae and exceptionally high in Anapidae.
The opisthosoma shape (trait |$\#$| 18) showed minimal values (i.e., wide opisthosomas) in various lineages and exceptionally high values (i.e., long and slender opisthosomas) in some Tetragnathidae. The relative opisthosoma height (trait |$\#$| 19) was minimal within Deinopidae and maximal within Tetragnathidae. The relative length of the posterior lateral spinnerets (trait |$\#$| 20) was minimal within Corinnidae and Mimetidae and exceptionally high in Hersiliidae.
Discussion
Stabilized Evolution of Body Shapes But Not Body Size in Spiders
An important question in macroevolution is, why some lineages barely changed over long time scales, while others underwent massive phenotypic changes (Hansen and Houle 2004; Hunt 2007). Spiders have been highlighted for their conservative body plan despite being a highly speciose and ancient group of arthropods (Dimitrov and Hormiga 2020). Our results support this notion: the phylogenetic distribution of most descriptors of body proportions was best explained with Ornstein–Uhlenbeck models with moderate to strong stabilizing forces. Although most morphometric traits showed considerable variation, this variation was often evenly distributed across the spider tree of life and trait expressions concentrated in particular lineages (indicating clade-specific trends) were surprisingly rare.
We note that due to our sampling across higher taxonomic levels, these results are to be interpreted as global patterns, but that locally (i.e., within sub-families and genera) notable trends may be present. Locally, evolutionary dynamics may also switch from an Ornstein–Uhlenbeck to a Brownian Motion process, as, for instance, it may be likely for the case of myrmecomorphic (ant-mimicking) or cryptic spiders that exhibit outstanding rates in phenotypic evolution (Wolff et al. 2021). Such a switch in dynamics would indicate that constraints in the evolution of the trait are relaxed, or that mechanisms stabilizing the expression of the trait are overcome by strong selective pressures (e.g., predatory pressure selecting for mimicry or crypsis traits). An example for a clade with a highly derived body shape are the palpimanoids, most prominently the pelican spiders (Archaeidae) and trap-jaw spiders (Mecysmaucheniidae), which exhibit a highly elevated prosomal structure, resembling a ‘neck’ and a ‘head’, and highly elongated chelicerae with unusual mobility. It is noteworthy, though, that this special appearance is very old as shown by fossils and its basic pattern barely changed over hundreds of millions of years (Wood 2017). This example shows that rare events of radical changes in spider body shapes were followed by a long period of slow evolutionary change (Wood et al. 2015). A different scenario may be present in myrmecomorphic spiders, in which multiple morphological traits are under strong selection pressures (Pekár et al. 2011; Pekár 2014; McLean et al. 2019). However, the evolutionary dynamics that produce changes in morphometric traits in myrmecomorphic spiders have not been studied to date. Similarly, the adaptation to the sheltering in holes and crevices may lead to changed evolutionary dynamics and elevated evolutionary rates of body morphologies (Wolff et al. 2021), as indicated by our data showing the repeated trended evolution of flat bodies in some related lineages of hunting spiders and the low phylogenetic signal of traits indicating body flattening. These are intriguing examples where body shape evolution radically departed from the global average and which deserve closer investigation in the future.
While most descriptors of body proportions (globally) evolved under an Ornstein–Uhlenbeck process, body size evolution best fitted a Brownian Motion-like dynamics. This is in line with studies on other taxa that showed that Ornstein–Uhlenbeck dynamics are rare in the evolution of body size (Hunt 2007; Landis and Schraiber 2017). It was previously found in a series of fossils from diverse taxa that body size tends to be more labile than body shape (Hunt 2007). Our results support these patterns.
We did not find evidence for Cope’s rule (i.e., a global trend of increased body size over time) for spiders, which is in contrast to many vertebrate lineages (Alroy 1998), but similar to dragonflies—another lineage of arthropods with relative stasis in body shape, but not size (Waller and Svensson 2017). Instead, body size evolution was very dynamic with local trends. There were clear differences in branch-wise trait variation between araneoid spiders on the one hand, and the RTA-clade on the other hand (Fig. 5). In the first case, there were obvious divergent (or bimodal) trends in body size evolution across large clades, whereas in the latter, body sizes tended to be more variable between sister lineages. This indicates that body size evolution in the most speciose clades of web builders and cursorial spiders each follow different dynamics.
Disparate Body Size Evolution in Web Builders with Bimodal Trends
Body size is regarded a key trait in ecomorphology and ecophysiology, and its evolution has often been linked to selection acting on life history traits (Peters 1986; LaBarbera 1989; Blanckenhorn 2000). In spiders, body size evolution has previously been studied in the araneoid clade and linked to different hypotheses (Hormiga et al. 2000). Some lineages exhibit an extreme sexual size dimorphism that is unusual for terrestrial animals, and comparative approaches aimed to understand its evolution, specifically if it represents a male dwarfism, female gigantism or both (Hormiga et al. 2000; Kuntner and Coddington 2009, 2020). Extreme sexual size dimorphism was best explained with the evolution of female gigantism, with the most prominent example being the Nephilinae (golden orb-web spiders) (Hormiga et al. 2000; Higgins 2002; Kuntner and Coddington 2009). It is assumed that female gigantism has high fitness benefits for females by increasing fecundity, but that its evolution is constrained by resource availability, web architecture, and other negatives pressures (e.g., kleptoparasites) (Coddington et al. 1997; Kuntner and Coddington 2020). The occurrence of large female body sizes in some orb-web spiders has been explained with their ability to capture prey at high rates (Higgins 2002; Blackledge et al. 2009a; Harmer et al. 2015) or of larger size (Nentwig and Wissel 1986; Venner and Casas 2005).
Contrary to the trend observed in female gigantism, multiple lineages of orb-web spiders have evolved toward miniaturization (Eberhard 2007). Potential selective advantages of miniaturization may include access to new niches and the enhanced adaptability through shortened reproduction cycles (Hanken and Wake 1993). In spiders, a low body mass may also facilitate long-range dispersal via ballooning or thread-based locomotion (bridging) (Corcobado et al. 2010). The smallest known spiders belong to the Symphytognathidae, Mysmenidae, and Anapidae, all of which build aerial webs (orbs or suspended sheets) (Cardoso and Scharff 2009); these three families are members of the “symphytognathoid” clade (Kulkarni et al. 2021; but see also Kallal et al. 2020). It has been suggested that miniaturization is constrained by minimal organ sizes, most prominently the size of the central nervous system and sensory organs (Eberhard 2007; Quesada et al. 2011). We found that in spiders with body lengths smaller than 1.5 mm, the eyes were disproportionately large and the prosoma was high (including an unusual convex shape of the sternum to fit the central nervous system (Eberhard 2007)). It has been proposed that the ‘outsourcing’ of cognitive capacity into the web (i.e., by encoding information in the arrangement and straining of lines) would enable those spiders to evolve smaller body sizes (Japyassú and Laland 2017). However, adult female body sizes around 1.5 mm are also found in the cursorial Oonopidae. Oonopidae are a species-rich family with high abundances in some habitats, which does not support the argument that small spiders need external devices to process an amount of information suitable for growth and reproduction. The extended cognition hypothesis remains debatable and requires more investigation.
While trends in gigantism (e.g., Cope’s law) and miniaturization have been established for many taxa (Stanley 1973; Alroy 1998; Rüber et al. 2007; Avaria-Llautureo et al. 2012; Polilov 2016), bimodal trends in body size evolution have rarely been demonstrated (Benson et al. 2018; Boucher et al. 2018). The overall abundance and the mechanisms causing these disparate trends are largely unclear. For the bimodal trend of body size evolution found in the araneoid clade, it could be argued that different body sizes represent adaptations to different niches. However, in web building spiders, the relationship between spider body size and prey size seems less strong than in cursorial spiders (Nentwig and Wissel 1986). It can therefore be hypothesized that, in araneoids, the adaptations to the foraging niche are expressed in the characteristics of the web rather than in body morphology, and the bimodal trend of body size evolution represents two alternative strategies for enhanced reproduction (fast maturity vs. high fecundity). This interesting topic should be addressed in focused future studies.
Differences in Locomotory Modes between Foraging Niches Affect the Evolution of Spider Morphology
Links between ecological and morphological traits are the core of ecomorphology and the traditional study of adaptation, and have been demonstrated for many clades (McLean et al. 2018; Hembry and Weber 2020; Pigot et al. 2020).
In contrast, in spiders, of all twenty traits tested, only four were different between guilds, three of which were descriptors of leg morphology (|$\#$| 9 leg length, |$\#$| 12 leg thickness, and |$\#$| 14 front leg elongation), and one of opisthosomal shape (|$\#$| 19 opisthosoma height). This suggests that differences in the locomotory mode between guilds is driving morphological disparity. The correlation between size or shape of locomotory appendages and tropic niches has previously been demonstrated in studies on fish (Price et al. 2013; Colombo et al. 2016), birds (Pigot et al. 2020), and bats (Marinello and Bernard 2014; Sánchez and Carrizo 2021). However, in studies that used multiple traits, locomotor organs evolved more slowly or were less correlated with the trophic niche than descriptors of mouth parts (Price et al. 2013; Pigot et al. 2020), which is in contrast to our results in spiders.
A reason for this might be that in spiders adaptation to trophic niches is rather realized by behavioral strategies and extended phenotypes (webs) than differences in the feeding apparatus. The use of webs, however, seems to favor the evolution of specific leg morphologies. Moya-Laraño et al. (2008) previously compared leg morphology and locomotory performance of aerial web builders (i.e., spiders that predominantly move in a suspended mode) and cursorial spiders (i.e., spiders that predominantly walk standing on their legs) and concluded that the locomotory mode strongly affected the evolution of leg morphology and function. Aerial web builders tended to have longer, thinner legs and moved faster upside-down, following pendulum mechanics, whereas hunting spiders tended to have thicker legs and their locomotory kinematics was best explained by inverted pendulum mechanics. This conclusion is supported by our results, which represents a much larger sample size and was corrected for phylogenetic effects. According to pendulum mechanics, longer legs provide a more energy efficient locomotion, and, in a hanging spider the legs do not need to support the spider’s body weight, meaning that the evolution of a high aspect ratio of the legs is less limited. Notably, not only leg length but also the ratio between front and hind legs is reversed in aerial web builders compared to ground runners, perhaps because hanging spiders predominantly ‘pull’ themselves forward, whereas in ground runners locomotion is primarily driven by the thrust of the hind legs.
Despite these clear differences, it should be noted that leg morphology does not unequivocally characterize spider guilds. For instance, long, thin legs are not exclusive characteristics of aerial web builders. They have also been reported as a key trait in myrmecomorphy (Pekár 2014), which almost exclusively evolved in hunting spiders. At the same time, there are aerial web builders with short sturdy legs, such as in the uloborid genus Hyptiotes that use these robust legs to hold their highly stressed modified capture web (Han et al. 2019).
Burrowers tended to have short, sturdy legs with the smallest tibia to femur ratios. However, not all burrowers showed this pattern. This may be because within burrowing spiders, prey capture strategies (e.g., the use of legs or fangs in prey grasping) differ. Also, depending on the substrate, the mechanical requirements on the legs as excavation devices may differ considerably.
Interestingly, there was also no clear difference in leg morphologies between the three guilds of cursorial spiders (i.e., ground runners, foliage runners, and ambushers), although locomotory modes and locomotor activity differ considerably between those guilds. This shows that the frequency and style of locomotion does not necessarily translate into leg lengths or proportion between leg articles, as previously suggested (Moya-Laraño et al. 2008; Eberle et al. 2018). However, it is possible that fine scale differences in movement styles and prey capture behavior, not considered in this study, correlate with leg morphology.
Our multivariate analysis showed a high overlap of the occupied trait space between guilds. Aerial web builders and burrowers exhibited the strongest disparities of trait expression, but even their morphometric trait spaces overlapped. Morphometric traits cannot unequivocally indicate the foraging niche of a spider. We advise against using body proportions for the inference of spider ecology, where no behavioral or observational data are available (such as in fossil or rare species). Micro-morphological characters, such as the presence of certain podal structures, may be good indicators of foraging guild, where they are present. For instance, special serrated bristles under the median claw (so-called auxiliary claws) are mostly (but not exclusively) found in aerial web builders (Ramírez 2014). Scopulae (pads of adhesive setae covering the distal leg articles) are almost exclusively found in cursorial spiders, and claw tufts (adhesive foot pads) are predominantly found in foliage runners (Wolff et al. 2013).
Poor Link between Body Morphology and Predatory Ecology in Spiders
The lack of (phylogenetically corrected) differences in most of our studied traits could mean that, in spiders, adaptations to foraging niches are barely evident in gross morphology. Also, the lack of guild-specific differences in eye size, paturon length, fang length, and femur thickening does not support the idea that the use of webs as extended prey capture devices (‘extended phenotypes’) reduces the need to invest in sensory organs and predatory devices. This is remarkable, as extended phenotypes have been postulated as opportunities to evade selection pressures (Odling-Smee et al. 2003). This underlines that webs may be important devices for prey interference but do not substitute for body morphologies in prey immobilization or visual information, or adhesive pads, spines, and special behavioral predatory techniques as the alternatives to webs (Wolff et al. 2013; Eggs et al. 2015). We note that eyes play a dominant role for prey recognition only in certain clades of spiders, such as the Salticidae and Deinopidae, and differences in the abundance of other sensory organs between spiders of different guilds remain to be investigated.
Outlook: Enhanced Hypothesis Testing by Linking Advances in Phylogenomics with Trait Databases
Our study is one of the largest phylo-ecomorphological studies thus far conducted on a group of animals. Our results demonstrate the power to combine the recent advances in phylogenomics with trait-based approaches to resolve global patterns of phenotypic evolution at an unprecedented scale. Current initiatives to set up and grow central online databases of species traits will further facilitate the task to collate comparative data and enhance opportunities to study functional diversity through space and time (Gallagher et al. 2020; Pekár et al. 2021).
Conclusions
We built a large database of morphometric and behavioral traits and used it to perform the thus far largest comparative study of spider body size and body shape in the context of foraging guild evolution. The database can be accessed from the Supplementary material available on Dryad and is open for use and applicable to future questions on spider ecology and evolution.
Body size followed a Brownian Motion like evolutionary dynamic. This was most prominent in the araneoid clade (ecribellate orb-weaving spiders and allies) that showed a bimodal trend (female gigantism and miniaturization). This could indicate that, in animals that express niche dependent adaptations primarily through behavioral traits (i.e., the use of extended prey capture devices), body size evolution is governed by reproductive strategies.
Most other morphometric traits followed an Ornstein–Uhlenbeck-like evolutionary dynamic, indicating that the spider body plan is highly conserved and deviations from the ground pattern of body proportions are rare.
Morphometric traits are poor estimators of foraging guilds. Aerial web builders tend to have evolved longer, thinner legs and a higher front to hind leg ratio than spiders of other guilds, supporting the pendulum mechanics hypothesis, but this rule is not without exceptions. We propose that, to infer information on spider ecology in species lacking behavioral data, micro-morphological characters, such as the presence of certain podal structures, should be consulted instead.
Eye size and fang length did not differ between guilds, indicating that the use of webs as prey capture devices does not reduce the need to process visual information or immobilize prey.
Supplementary Material
Data available from the Dryad Digital Repository: https://doi.org/10.5061/dryad.2280gb5rz. Supporting information is available from Zenodo: https://doi.org/10.5281/zenodo.5772110. The analysis scripts and input files are available from Zenodo: https://doi.org/10.5281/zenodo.6192506.
Funding
This work was supported by a Macquarie University Research Fellowship of Macquarie University, a Discovery Early Career Researcher Award of the Australian Research Council (DE190101338) and a Principle Investigator Grant of the Deutsche Forschungsgemeinschaft (DFG, German Research Foundation, Grant 451087507) to J.O.W., by an Australian Research Council Discovery grant (DP170101617) to M.B.J.K. and M.E.H., by the Global Genome Initiative, National Museum of Natural History, Smithsonian Institution, and US National Science Foundation grant EAR-0228699 to J.A.C., by the NSF EAR-0228699 grant and a US National Science Foundation grant (Division of Environmental Biology 1754289) to G.H., and by grant PICT-2017-0289 from FONCyT to M.J.R.
Acknowledgments
We thank the contributors of macro photographs for display in Figure 2. We thank the following peers for the contribution of image data for morphometric measurements: Suresh P. Benjamin, Jason Bond, Meghan Culpepper, Diana Silva Dávila, Paola Favre, Anna Goldman, Abel Peréz González, Cristian Grismado, Charles Griswold, Adrian Harris, Emile Hasan, Matías Izquierdo, Facundo Labarque, Joel Ledford, Lara Lopardo, Wayne Maddison, Ivan Magalhaes, Jeremy Miller, Fernando Alvarez Padilla, Virginia Power, Nibia Soto Rolón, Gonzalo Rubio, Alma Saucedo, Nikolaj Scharff, Jesper Schmidt, Petra Sierwald, Chad Spruill, Tamás Szűts, Darrell Ubick, Christopher Vo, Hannah Wood, and Junxia Zhang. Martín Carboni, from Museo Argentino de Ciencias Naturales, helped running the phylogenetic analyses. We acknowledge the Wallumattagal clan of the Dharug nation as the traditional custodians of the Macquarie University land.
Author Contributions
J.O.W. and M.J.R. conceived and designed the study. J.O.W. extracted the ecological data, performed the morphometric measurements from images, analyzed the data and drafted the manuscript. K.W. extracted morphometric data from the literature and formatted the trait database. M.J.R. performed the phylogenetic inference. G.B.P. performed the sensitivity analysis. J.A.C., G.H., and M.B.J.K. imaged samples for morphometric measurements or provided additional data. M.H. mentored the project. All authors contributed to revising the manuscript draft.
Ethics Statement
This study does not contain data that were generated from living animals. All de novo acquired trait data were performed on preserved museum specimens.
Data Accessibility
The trait data sets are available from Dryad https://doi.org/10.5061/dryad.2280gb5rz and the World Spider Trait database (WST) https://spidertraits.sci.muni.cz/datasets/185.
Conflict of Interest
The authors declare no competing financial interests.
