


Abstract
There is wide variability in the propensity of somatic cells to reprogram into pluripotency in response to the Yamanaka factors. How to segregate these variabilities to enrich for cells of specific traits that reprogram efficiently remains challenging. Here we report that the variability in reprogramming propensity is associated with the activity of the MKL1/SRF transcription factor and concurs with small cell size as well as rapid cell cycle. Reprogramming progressive cells can be prospectively identified by their low activity of a widely used synthetic promoter, CAG. CAGlow cells arise and expand during cell cycle acceleration in the early reprogramming culture of both mouse and human fibroblasts. Our work illustrates a molecular scenario underlying the distinct reprogramming propensities and demonstrates a convenient practical approach for their enrichment.

The authors report a novel and much simpler method to identify and enrich for reprogramming progressive cells. They benchmarked the identity of the CAG low cells by assessing their cell cycle, cell size, and transcriptome. Due to its simplicity, this method should be widely useful for enriching reprogramming progressive cells.
INTRODUCTION
The somatic cells amenable to switching into pluripotency upon expression of the Yamanaka factors are considered to exist stochastically.1,–3 Within such a model, the rare cells known to have high reprogramming potential, such as the privileged cells or the poised/elite/winner cells,4 could represent extreme cellular states existing by chance. With the advent of various single cell genomics, it is now possible to define the expression of large numbers of genes in many individual cells,5,–9 capturing data sufficient for quantitative assessment of the stochastic nature in gene expression of single cells. Surprisingly, such studies revealed that the expression level of most genes is minimally stochastic, and can in fact be reliably predicted.9 Intriguingly, the most predictive parameters of gene expression heterogeneity are DNA content, indicative of cell cycle status, and cell size/shape. These findings suggest the possibility that if the rare cells of certain cell cycle behavior and/or cell size/shape can be prospectively identified or enriched, the stochasticity of somatic cell progressing into pluripotency may be minimized.
Cell size and shape is largely and collectively controlled by the concentration and conformation of cytoskeletal proteins. The expression of many cytoskeletal genes is under the control of MKL1 (Megakaryoblast Leukemia 1)/SRF (serum response factor), via the consensus CArG motif in their promoters. Important MKL1/SRF target genes include many members of the actin genes, and SRF itself.10 Besides cytoskeletal genes, another major class of SRF target genes is the “immediate early genes,” such as the AP1 family of transcription factors c-jun, c-fos, and Fra1.11,–14 These transcription factors are now known to antagonize Yamanaka reprogramming, or established pluripotency by redefining the enhancer-Pol II relationship.15,–17 We have recently reported that MKL1/SRF activity potently prevents the activation of mature pluripotency by hindering chromatin accessibility via an actin-LINC-dependent process.18 Taken together, these evidence suggest that the transcriptional activity of the ubiquitously expressed SRF could potentially serve as an indicator to how likely a somatic cell could progress into pluripotency.
In this report, we reveal that the fast cycling cells are small in size and display reduced SRF target gene expression. Low endogenous SRF activity can be conveniently captured by a synthetic promoter, the CAG promoter which derives part of its sequence from the chicken actin promoter/enhancer.19,20 Prospective isolation of CAGlow cells significantly enriched for reprogramming progressive cells in both mouse and human fibroblasts. Our work demonstrates that the inherent difference in reprogramming potential can be purified, at least partially, by the activity of a ubiquitously expressed transcription factor SRF.
RESULTS
Cells expressing low CAG promoter activity emerge during early reprogramming
Given that SRF target genes, the cytoskeletal genes and immediate early genes, both antagonize pluripotency, we wondered whether cells with diminished SRF activity represent the cells of higher reprogramming potential. SRF drives expression of target genes by binding to the consensus CArG sequences in their promoters, thus transgenes under the control of functional CArG elements might provide a convenient measure of SRF activity. Since the key functional element of the widely used CAG promoter contains two well-conserved CArG sites,19,20 we tested the intensity of fluorescent reporters driven by the CAG promoter during early reprogramming.
We first assessed reprogramming of mouse embryonic fibroblasts (MEFs) derived from a transgenic mouse line expressing an H2B-GFP fusion protein driven by the CAG promoter,21 crossed with the Rosa26:rtTA allele.22 A lentiviral vector directing doxycycline (Dox) inducible OSKM polycistronic cassette23 that also includes mCherry was used to drive Yamanaka factor expression (Figure 1A). With this system, reprogramming cells are contained within the mCherry+ cells after Dox is added. Cells with lower SRF activity should display lower CAG:H2B-GFP fluorescence intensity.
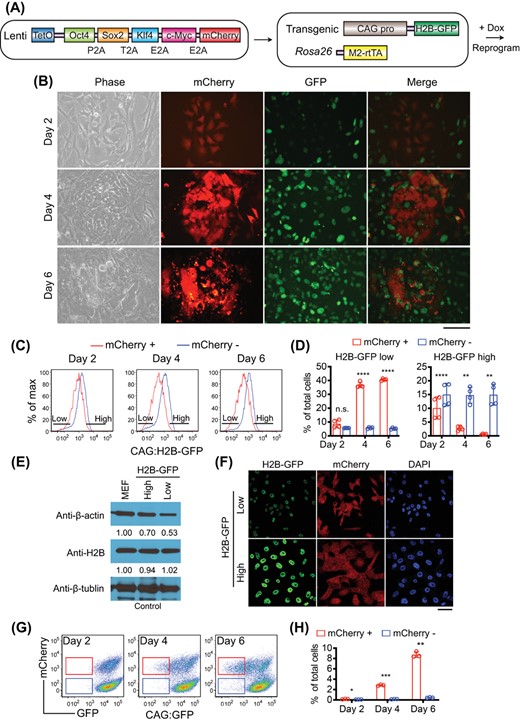
Reprogramming progressive cells show reduced CAG promoter activity. A, Schematic of the experimental design of reprogramming. B, Downregulation of CAG:H2B-GFP in reprogramming cells as revealed by fluorescence microscopy. mCherry marks OSKM-expressing cells. Scale bar: 100 μm. C, FACS analysis of the CAG:H2B-GFP MEFs undergoing reprogramming. OSKMmCherry+ cells display reduced GFP signal. D, Percentage quantification of CAG:H2B-GFPlow and CAG:H2B-GFPhigh cells in mCherry+ and mCherry− population, as gated in C. CAG:H2B-GFPlow cells are enriched in the mCherry+ cells. n.s., non-significant; **P < .01; ****P < .0001. Statistics were performed by Student's t test. E, Western blot of whole cell lysates from bulk MEFs or subsets isolated from reprogramming cultures based on H2B-GFP intensity, with β-tubulin as loading control. The endogenous H2B remains unchanged, as determined by normalized densitometry. Protein level in bulk MEFs is set to 1. F, Confocal fluorescence microscopy confirming the H2B-GFP intensity after mCherry+ cells were sorted based on GFP intensity. Scale bar: 50 μm. G, FACS analysis of the CAG:GFP MEF cells undergoing reprogramming. A fraction of OSKMmCherry+ cells decreased GFP signal as reprogramming continued. H, Percentage quantification of CAG:GFPlow cells in mCherry+ and mCherry− population, as gated in G. CAG:GFPlow cells are enriched in the mCherry+ population. *P < .05; **P < .01; ***P < .001. Statistics were performed by Student's t test
We examined whether CAG:H2B-GFP intensity decreases during early reprogramming to reflect the decreasing MKL1/SRF activity.18 Shortly after Dox addition, there was a marked downregulation of CAG:H2B-GFP intensity within the mCherry+ population compared with the mCherry− cells (Figures 1B-D). The decrease in CAG:H2B-GFP intensity is consistent with reduced activity of MKL1/SRF as revealed by lower β-actin expression (Figure 1E),18 and cells with distinct CAG:H2B-GFP intensity can be recovered by FACS sorting (Figure 1F). Importantly, the decreased H2B-GFP signal was not a result from downregulation of the H2B moiety, because endogenous H2B protein did not decrease in the sorted CAG:H2B-GFPlow cells (Figure 1E). To rule out the possibility that the downregulation of the CAG:H2B-GFP signal was mediated by the particular transgene integration site, we reprogrammed MEFs derived from another independent transgenic mouse line24 similarly crossed with the Rosa26:rtTA allele.22 These MEFs express GFP without H2B under the same CAG promoter but presumably have a different transgene integration site. Similar to the observations with CAG:H2B-GFP MEFs, the CAG:GFP level was significantly reduced only in the mCherry+ cells early in reprogramming (Figure, 1G,H). Therefore, a small population of cells expressing low CAG promoter activity emerges during early reprogramming.
CAGlow cells enrich for reprogramming progressive cells
To test whether the CAGlow cells are enriched for efficient reprogramming, we sorted the ~15% cells of the highest and lowest CAG:H2B-GFP intensity among all mCherry+ cells and replated them separately to allow further reprogramming (Figure S1A). As shown in Figure 2A, the CAG:H2B-GFPlow population displayed much higher (about 20-fold) efficiency compared with the CAG:H2B-GFPhigh cells, assessed by alkaline phosphatase staining. Reprogramming efficiency of the bulk mCherry+ cells was in between that of the CAG:H2B-GFPhigh and CAG:H2B-GFPlow cells, indicating that the former is depleted of the reprogramming progressive cells while the latter enriched for it. To confirm the derived colonies are mature iPSCs, we stained them for Nanog, a more stringent pluripotency marker. As expected, most colonies arose from CAG:H2B-GFPlow cells were Nanog-positive (Figure 2B). The expression of additional core pluripotency genes, Oct4, Nanog, Sox2 and Esrrb, was similar to that in mESCs (Figure 2C). The iPSCs derived from CAG:H2B-GFPlow cells readily supported teratoma formation in which differentiation toward all three germ layers are present (Figure 2D), confirming their pluripotent nature. Importantly, prospective isolation of CAG:GFPlow cells similarly enriched for high reprogramming activity from the MEFs expressing a second CAG promoter-driven reporter CAG:GFP (Figure 2E). Lastly, we assessed when reprogramming progressive CAGlow cells emerge from the reprogramming culture in reprogrammable MEFs expressing the transgenic CAG:H2B-GFP, and reprogrammable MEFs transduced with a lentivirally expressed CAG-driven GFP (Figures 2F,G and S1B,C). Consistently, transgenic CAGlow cells or virally expressed CAGlow cells enriched for reprogramming activity (Figure 2F,G). CAGlow-enriched reprogramming became detectible at day 2 and grew more prominent later, by both the transgenic and virally transduced CAG (Figure 2F,G). The consistent enrichment of reprogramming efficiency among the CAGlow cells, by multiple independent transgenic lines (Figure 2A,B,E,F) and by the CAG-driven viral vector across multiple timepoints (Figure 2G) demonstrate that low CAG promoter activity could reveal the reprogramming progressive cells.
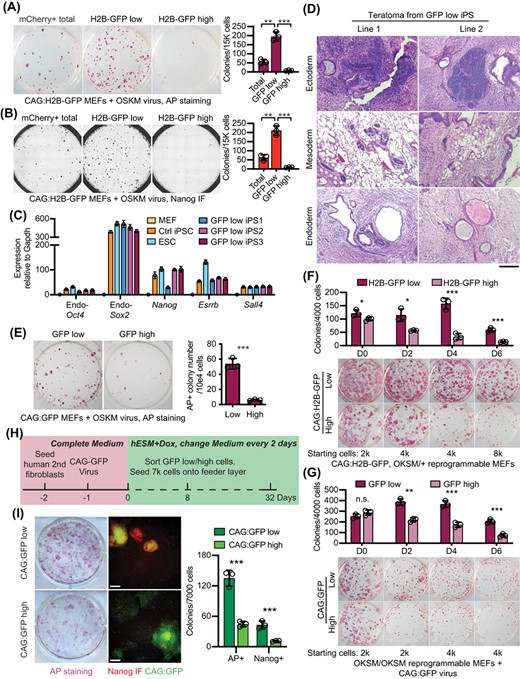
Low CAG promoter activity in reprogramming fibroblasts enriches for reprogramming progressive cells. A, AP staining of iPS colonies at reprogramming day 12. Total mCherry+ cells, 15% of the highest or lowest CAG:H2B-GFP+ cells were sorted from the mCherry+ cells on day 4 and replated on feeder cells to allow further reprogramming. Reprogramming efficiency is quantified on the right. **P < .01; ***P < .001. Statistics were performed by Student's t test. B, Immunostaining of iPS colonies at reprogramming day 12 for Nanog. Total mCherry+ cells, 15% of the highest or lowest H2B-GFP+ cells were sorted from the mCherry+ cells on day 4 and replated on feeder cells to allow further reprogramming. Reprogramming efficiency is quantified on the right. **P < .01; ***P < .001. Statistics were performed by Student's t test. C, Real-time PCR analysis of core pluripotent gene expression in MEFs, control iPSCs, ESCs, and iPS colonies derived from CAG:H2B-GFPlow cells sorted at reprogramming day 4. Expression in MEFs is set to 1. D, Representative histology of teratomas grown from two CAG:H2B-GFPlow-derived iPS cell lines, showing tissues of the ectoderm, mesoderm and endoderm. Scale bar for all images: 300 μm. E, AP staining of iPS colonies at reprogramming day 12. 15% highest or lowest CAG:GFP+ cells were sorted from the OSKMmCherry+ population on day 6 and replated on feeder cells to allow further reprogramming. Colonies were scored and quantified on the right. ***P < .001. Statistics were performed by Student's t test. F, Quantification of AP+ colonies derived from MEFs expressing transgenic CAG:H2B-GFP and a heterozygous Col1a:OKSM allele. The ~10% cells with the lowest or highest H2B-GFP intensity were sorted on reprogramming day 0, 2, 4 and 6, respectively, and were replated to allow for further reprogramming. *P < .05; ***P < .001. Statistics were performed by Student's t test. G, Quantification of AP+ colonies derived from reprogrammable MEFs transduced with CAG:GFP virus. The ~10% cells with the lowest or highest GFP intensity were sorted on reprogramming day 0, 2, 4 and 6, respectively, and were replated to allow for further reprogramming. n.s. nonsignificant, **P < .01; ***P < .001. Statistics were performed by Student's t test. H, Schematics of reprogramming timeline using the secondary human fibroblast. I, AP staining and Nanog immunostaining of colonies at reprogramming day 32. The numbers of AP+ or Nanog+ colonies arising from CAG:GFPlow and CAG:GFPhigh cells are shown on the right. Scale bars: 200 μm. ***P < .001. Statistics were performed by Student's t test
To test whether low CAG promoter activity identifies reprogramming progressive human cells, we used the secondary human fibroblasts.25,26 These human fibroblasts contain the dox-inducible transcription factors OCT4, SOX2, KLF4, and C-MYC. We transduced the cells with the viral CAG:GFP, and added Dox. On day 7, the brightest and dimmest 10% CAG:GFP+ cells were FACS sorted and replated for further reprogramming (Figure 2H). Similar to the results in MEFs, CAG:GFPlow cells gave rise to significantly more AP+ colonies than CAG:GFPhigh cells. Immunostaining for Nanog confirmed positivity in many of these colonies, indicative of their mature pluripotency (Figure 2I). Taken together, our data reveal that the activity of the synthetic CAG promoter, when expressed as a transgene, has a surprising utility in enriching for reprogramming progressive cells in both human and mouse.
CAGlow cells largely overlap with the fast cycling cells
Because we previously identified that a minor population of cells that have achieved sufficient cell cycle acceleration also reprogram with much higher efficiency,27 we examined the relationship between the CAG:H2B-GFPlow cells and the ultrafast cycling cells. Using a violet cell proliferation indicator dye (inherited by the two daughter cells of each cell division), we obtained simultaneous measurements of the CAG:H2B-GFP signal and the intensity of the proliferation dye (Figure 3A). Cells with low proliferation dye intensity indicate fast cycling speed, since the dye is diluted more during the same chase period.27 We observed a strong correlation between the dyelow cells and the CAG:H2B-GFPlow cells: dyelow cells are low in CAG:H2B-GFP and vice versa (Figure 3B). These data confirm that CAG:H2B-GFPlow cells largely overlap with the fast cycling cells, accounting for the high reprogramming efficiency observed for both isolation approaches.27
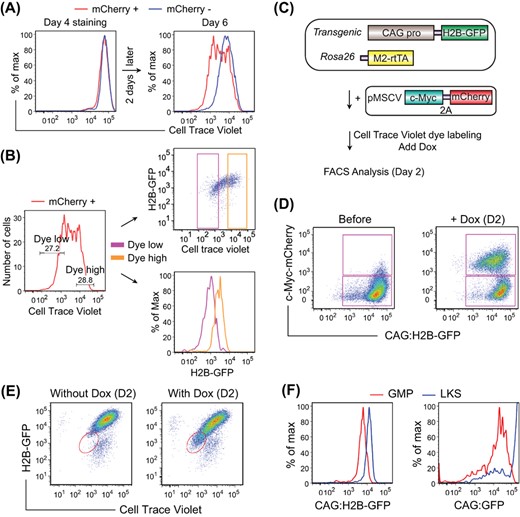
Reprogramming cells with low CAG promoter activity are fast cycling cells. A, FACS analysis of CAG:H2B-GFP fibroblasts during reprogramming, which was performed as shown in Figure 1A. Cells were stained with Cell Trace Violet dye at day 4, replated and analyzed at day 6. mCherry+ and mCherry− cells indicate OSKM-expressing and nonexpressing cells, respectively. B, mCherry+ cells shown in A are gated according to the violet dye intensity, and the populations are replotted based on H2B-GFP intensity. Dye low cells display low H2B-GFP intensity. C, Schematics of the experimental design on the correlation between CAG promoter activity and c-Myc-driven cell cycle acceleration. CAG:H2B-GFP fibroblasts were transduced with inducible c-Myc-2A-mCherry. Cells were labeled with Cell Trace Violet dye and induced for c-Myc expression thereafter. D, FACS analysis of CAG:H2B-GFP fibroblasts shown in C, before and after induction for c-Myc expression for 2 days. Note that most of the H2B-GFPlow cells are mCherry+. E, FACS analysis of CAG:H2B-GFP fibroblasts treated as shown in C, without or with Dox induction for 2 days. Dye low cells (oval gate) correlate with H2B-GFPlow cells. F, FACS plot of fresh LKS cells and GMPs from the bone marrow of CAG:H2B-GFP and CAG:GFP transgenic mice
To examine whether low CAG promoter activity arose when cell cycle becomes fast, we accelerated the cell cycle of CAG:H2B-GFP fibroblasts by overexpressing Dox-inducible c-Myc alone, using a vector that also encodes mCherry (Figure 3C,D). The same tight correspondence between dye retention and CAG activity was similarly observed, with dyelow cells displaying low CAG:H2B-GFP intensity (Figure 3E). These data suggest CAGlow cells could arise consequent to cell cycle acceleration, such as when c-Myc is overexpressed.
To test whether CAGlow cells exist in normal somatic cells of distinct cycling behavior, we examined the CAG activity in closely related hematopoietic progenitors. As shown in Figure 3F, the largely quiescent hematopoietic stem cells (Lineage− Kit+ Sca+, LKS) display higher CAG activity than the fast cycling granulocyte macrophage progenitors (GMPs), in both CAG:H2B-GFP and CAG:GFP mice. Consistent with the findings in MEFs, the CAGlow cells also correspond to those with high reprogramming efficiency, as GMPs reprogram more efficiently than LKS cells.27,28 Taken together, these data demonstrate that the CAGlow cells are primarily the same as fast cycling cells, reinforcing the notion that low CAG promoter activity enrich for reprogramming progressive cells.
CAGlow cells are small in size with reduced SRF target genes
To explore whether low CAG promoter activity is related to the reduced MKL1/SRF signaling pathway, we examined cell size/morphology changes in live cell imaging and tracking of cells undergoing reprogramming,27,29 since cell size/morphology is largely determined by actin cytoskeletal genes, which are MKL1/SRF targets. We found that the reprogramming mCherry+/CAG:H2B-GFPlow cells formed clusters shortly after adding Dox (2 days), and these cell clusters contained cells of much smaller size (Figure 1B). Over a longer time in Dox, the clusters increased in size while individual cells within the clusters became even smaller (Figure 1B,F). This is consistent with earlier reports that successful reprogramming originated from cells of small sizes.30 FACS sorting by either CAG:H2B-GFP or CAG:GFP recovered cells of distinct sizes, with the CAGlow cells being significantly smaller (Figures 4A,B and S2). The difference in cell size can also be detected by FACS forward scatter, a crude measure of cell size (Figure 4C). Indeed, sorting smaller cells by low forward scatter (Figure S1D) enriched for reprogramming efficiency starting at day 2 (Figure 4D), in a manner similar to the enrichment achieved by sorting CAGlow cells (Figure 2F,G). These data are consistent with our previous finding that full reprogramming is contingent on low MKL1/SRF activity.18
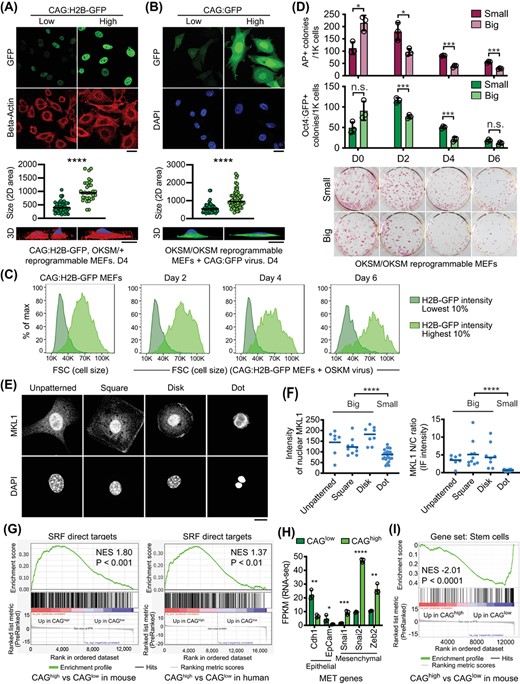
Reprogramming cells with low CAG promoter activity show reduced cell size and low MKL1/SRF activity. A, Confocal microscopy images of H2B-GFP intensity (top) after day 4 reprogramming cells were sorted for the ~10% of cells with the lowest or highest GFP intensity. 2D cell size were quantified by β-actin+ area (middle). Representative 3D reconstructed images shown on the bottom. Scale bars: 20 μm. ****P < .0001. Statistics were performed by Student's t test. B, Confocal microscopy images of GFP intensity (top) after day 4 reprogramming cells were sorted for the ~10% of cells with the lowest or highest GFP intensity. 2D cell size were quantified by GFP+ area (middle). Representative 3D reconstructed images shown on the bottom. Scale bars: 20 μm. ****P < .0001. Statistics were performed by Student's t test. C, FACS Forward Scatter (FCS) of CAG:H2B-GFPlow and CAG:H2B-GFPhigh cells at reprogramming day 0, 2, 4, and 6. CAG:H2B-GFPlow cells are smaller, as indicated by low FSC. D, Quantification of AP+ and Oct4:GFP+ colonies derived from reprogrammable MEFs sorted on indicated days based on cell size. Reprogramming cells with smaller size enrich for reprogramming progressive cells. n.s., nonsignificant; *P < .05; ***P < .001. Statistics were performed by Student's t test. E, Confocal images of fibroblasts grown on micropatterned surface, immunostained with MKL1 antibody, or stained with DAPI to reveal the nuclei. Micropatterned surfaces include unpatterned surface, square, disk, and dot shape. Scale bar: 20 μm. F, Quantification of MKL1 intensity in micropatterned fibroblasts. Small indicates cells grown on the dot pattern; big indicates cells grown on unpatterned, square or disk patterned surfaces. ****P < .0001. Statistics were performed by Student's t test. G, Gene set enrichment analysis (GSEA) of differentially expressed genes between CAGhigh and CAGlow cells at reprogramming day 4 (mouse) and day 7 (human). SRF target genes are enriched in the upregulated DEGs between CAGhigh and CAGlow cells of the same species. H, Representative MET gene expression as determined by mRNA-seq. CAGlow cells display higher expression of epithelial genes (Cdh1, EpCam), while CAGhigh cells display higher expression of mesenchymal genes (Snai1, Snai2, Zeb2). FPKM: fragments per kilobase of transcript per million mapped reads. *P < .05; **P < .01; ***P < .001; ****P < .0001. Statistics were performed by Student's t test. I, The differentially expressed genes between CAGhigh and CAGlow cells at reprogramming day 4 (mouse) were analyzed by GSEA, revealing significantly enriched stem cell genes in the upregulated DEGs in CAGlow cells
To directly monitor whether MKL1/SRF activity is modulated by cell size, we plated MEFs on micropatterned surfaces of varying sizes, and determined endogenous MKL1 subcellular localization by immunostaining, as transcriptionally active MKL1 localizes inside the nucleus (Figure 4E). Strikingly, larger cells showed higher MKL1 nuclear to cytoplasmic ratio, while smaller cells had significantly decreased nuclear MKL1 (Figure 4F). Although the degree of enrichment for reprogramming activity was less than that achieved by dye dilution (more than 1000 fold27) or CAG activity (Figure 2), the fact that altering just a single parameter, that is, cell size, could change MKL1 localization strongly supports that mCherry+/CAG:H2B-GFPlow cell clusters expressed reduced MKL1/SRF activity as they become smaller. Cell size reduction supports low MKL1/SRF activity, since this change involves dramatic reduction and rearrangement of the actin cytoskeleton. The different extent of enrichment for reprogramming activity suggests that fast cell cycle likely leads to additional molecular changes besides decreasing cell sizes.
To reveal the molecular differences between the CAGlow and CAGhigh cells, conserved between mouse and human, we performed RNA-seq analyses on CAG:H2B-GFP MEFs (Figures 2A and S1A) and human secondary fibroblasts (Figure 2H) which were FACS sorted based on CAG activity on reprogramming day 4 and 7, respectively. Larger transcriptomic changes were detected between the reprogramming MEFs compared with the reprogramming human fibroblasts (Figure S3), likely due to secondary nature of the human fibroblasts. Strikingly, however, the differentially expressed genes (DEGs) between the CAGhigh and CAGlow cells of both species revealed significantly more SRF target genes by gene set enrichment analysis (GSEA) (Figure 4G). This difference in SRF target gene expression is also coorborated by lower β-actin protein seen in the CAGlow cells (Figure 1E). Furthermore, CAGlow cells expressed reduced mesenchymal transcription factors and elevated epithelial markers (Figure 4H), consistent with the known role of MKL1/SRF in driving many mesenchymal genes.31,32 In agreement with their reduced mesenchymal features, CAGlow cells had significantly enriched stem cell signature (Figure 4I). Taken together, these results confirm that the CAG promoter activity indeed reports endogenous SRF activity and that cells with low CAG activity display molecular features of progression toward pluripotency.
Although cells with low MKL1/SRF activity enrich for reprogramming progressive cells, we note that complete lack of MKL1 interferes with MEF proliferation, and consequently reprogramming (Figure S4A,B). This observation is consistent with the fact that SRF null embryos die at E6.0,33 preceding the time when MEFs are derived typically on E13.5-E14.5. The difference in the severity between MKL1-null and SRF-null embryos may be related to the functional redundancy provided by MKL2,34 as a dual targeting shRNA against both MKL1 and MKL2 ablated all AP+ colonies accompanied by reduced cell numbers (Figure S4C). Therefore, CAGlow instead of CAG negative cells, enrich for reprogramming progressive cells.
DISCUSSION
We describe a convenient approach to isolate and enrich for reprogramming progressive cells from multiple somatic cell types, of both mouse and human origin. Based on the activity of a widely used synthetic promoter, CAG, significant enrichment of reprogramming efficiency can be achieved. Specifically, cells expressing low CAG promoter activity are small in size and share overlapping identity with the previously identified fast cycling cells.27 Cells bearing both traits display high reprogramming efficiency. The mechanisms why CAGlow cells reprogram more efficiently is related to their reduced MKL1/SRF activity, as CAGlow cells express many SRF target genes at reduced levels. This enrichment approach is easy to implement and should help the further mechanistic studies.
We clarify the relationship between the small cells and fast cycling cells: they are essentially the same entity. Cells of small size and rapid cell cycle were reported in separate observations, both of which enrich for reprogramming cells. Specifically, early reprogramming is accompanied by dramatic cell cycle acceleration,27 and tracking pluripotency induction from somatic cells by live cell imaging have revealed that the privileged cells undergo ultrafast cell cycle of 8 hours/cycle. Independent imaging studies also revealed that successful reprogramming from fibroblasts invariably originate from cells of small sizes,30 an observation confirmed by other approaches.35 As c-Myc alone was sufficient to induce the distinct appearance of CAGlow cells, and c-Myc is a potent cell cycle driver, we suggest that the CAGlow cells with higher reprogramming potential arise consequent to cell cycle acceleration during early reprogramming. The CAGlow cells in many aspects resemble the dome-like cells reported by Liu et al,36 which have higher proliferative capacity and increased pluripotent gene expression than the flat monolayer cells coexisting in the human pluripotent stem cell culture. Therefore, the heterogeneity and/or stochasticity reflected by cell cycle and size/shape9 may be fundamentally connected to the regulation of pluripotency.
The contribution of gene expression heterogeneity in the initiating somatic cells to reprogramming efficiency could have many underlying reasons, including complex crosstalks among heterologous cells. For example, reprogramming could be influenced by non-cell autonomous signals, such as IL-6 secreted by adjacent senescent cells.37,38 Variability in inflammatory cytokine production39 and cellular competition40 have been recently reported to mediate different reprogramming behaviors. Furthermore, we recently described a noncell-autonomous mode of regulation of reprogramming by the transcription coactivator YAP via one of the secreted matricellular protein CYR61.41 Therefore, it could be difficult to reach absolute purification for reprogramming progressive cells. The extend of enrichment achievable by selecting for CAGlow cells is superior or comparable to many previously reported approaches.42,–44
MATERIALS AND METHODS
Mice and cells
All mouse work was approved by the Institutional Animal Care and Use Committee of Yale University. The reprogrammable mouse (R26rtTA;Col1a14F2A)45 (stock# 011004), CAG:H2B-GFP transgenic line (stock# 006069) and CAG:EGFP line (stock# 003291) were purchased from the Jackson Laboratory. The reprogrammable mice with reporter (R26rtTA;Col1a14F2A;Oct4GFP) were derived by crossing reprogrammable mice with Oct4:GFP mice. MKL1 knockout mouse line has been described before.34 MEFs with different genetic backgrounds were all derived from E13.5 embryos. Unless otherwise indicated, all reprogrammable MEFs were homozygous for the Col1a:OKSM allele. Human secondary fibroblasts were generated as previously described.25,26
Teratoma formation assay
1 × 10⁶ cells were dissociated into single cells, harvested, suspended in 50 μL of PBS, and injected subcutaneously into the hind legs of the mice. Teratoma formation assay was performed on Rag2−/-Il2rg−/− mice. They were maintained under nonspecific pathogen-free (SPF) conditions, at the Yale Animal Resources Center (YARC) Facility. Teratomas were excised at 4 weeks postinjection, fixed in 4% PFA, and embedded in paraffin. Sectioned samples were stained with hematoxylin and eosin for histological analysis.
Cell culture
MEFs, 293 T and human secondary fibroblasts cells were cultured in DMEM (Gibco, 11 995) supplemented with 10% heat-inactivated FBS (Gibco) and 1× Penicillin-Streptomycin-Glutamine (PSG, Gibco). Mouse iPS cells and ES cells were cultured in mESC medium defined as DMEM supplemented with 15% FBS (Hyclone), 0.1 mM nonessential amino acid (NEAA, Gibco), 1 × PSG, 0.1 mM β-mercaptoethanol, and 1000 U/mL murine leukemia inhibitory factor (LIF, Millipore). Human iPS cells were cultured in mTeSR1 complete kit (STEMCELL Technologies, 85850). Feeder cells were obtained by irradiating P5-P6 MEFs. Mature iPS cells and ES cells were maintained on feeder layers.
iPSC induction
For reprogramming involving Dox inducible OSKM-cassette or reprogrammable MEFs, reprogramming was induced by adding Doxycycline (Dox) to the ESC culture medium with a final concentration of 2 μg/mL. Viruses were generally transduced or cotransduced 1 day before initiation of reprogramming. Cells were sorted by FACS Aria, and replated onto feeder layer with specified number of cells on indicated reprogramming days. Medium was changed every other day for reprogramming experiments. Reprogramming was evaluated by performing AP staining, Nanog immunostaining, and quantification of AP-positive, Nanog-positive or Oct4:GFP-positive colonies. For mouse reprogramming with reprogrammable MEFs, vitamin C was added to the reprogramming culture after replating.
Constructs
The reprogramming factors Oct4, Sox2, Klf4 and c-Myc, and the reporter mCherry are fused with 2A, and cloned into the pFUW lentiviral backbone with an inducible promoter TetO. MKL1/2 shRNA construct was obtained from Addgene.11 CAG:GFP construct was obtained from Cellomics Technology (PLV10057). Inducible c-Myc-mCherry construct was generated by cloning the c-Myc coding sequence into pFUW lentiviral backbone with an inducible promoter TetO, and c-Myc is fused with a 2A-mCherry reporter.
RNA extraction, reverse transcription, and qPCR
Total RNA was extracted with Trizol reagent (Invitrogen) and reverse transcribed with the SuperScript III First-Strand Synthesis System according to manufacturer's instructions (Invitrogen). Quantitative real-time PCR was performed using the iQ SYBR Green Supermix (Bio-Rad) on a Bio-Rad CFX96. Primer sequences: Endo-Oct4_F, TCTTTCCACCAGGCCCCCGGCTC, Endo-Oct4_R, TGCGGGCGGACATGGGGAGATCC; Endo-Sox2_F, TAGAGCTAGACTCCGGGCGATGA, Endo-Sox2_R, TTGCCTTAAACAAGACCACGAAA; Nanog_F, AAATCCCTTCCCTCGCCATC, Nanog_R, TTTGGGACTGGTAGAAGAATCAGG; Sall4_F, GTGTCTCAGCAAGTGTCCGTGT, Sall4_R, GCATGAGGTAGCTTGGCTTGTT; Esrrb_F, GATCGGGAGCTTGTGTTCC-TC, Esrrb_R, AGGCGAGAGTGTTCCTCATCC.
RNA-Seq and data analysis
RNA-seq libraries were prepared with TruSeq Stranded mRNA Library Prep Kit (Illumina, RS-122-2101) following the manufacturer's instructions. High-throughput sequencing was performed with the Illumina HiSeq 4000 Sequencing System. For data analysis, the RNA-seq reads were mapped to mouse genome (mm10) or human genome (hg38) with TopHat2. Gene abundance was calculated using cuffnorm, which outputs read counts and the number of mapped fragments per kilobase of exon per million fragments (RPKM). Genes with RPKM ≥1 in two or more samples were selected for further analysis. Differentially expressed genes were identified by Cuffdiff followed by cutting off with FDR-adjusted P value <.05 and fold change >2. GSEA was performed using GSEA software (http://software.broadinstitute.org/gsea/)46 with default parameters. SRF directed targets were extracted from Esnault et al. 47 Stem cell gene set was obtained from Polo et al. 42 RNA-seq raw data and processed data can be obtained from GEO (GSE157672).
FACS analysis and sorting
Cells were analyzed on BD LSRII, or sorted on BD Aria. For FACS analyzing or sorting of cultured cells, cells were dissociated with 0.25% Trypsin-EDTA (Gibco/Thermo Fisher Scientific, 25200056), washed and resuspended with DPBS before analyzing or sorting. For analysis of GMP and LKS cells, cells were harvested from mouse bone marrow, and subject to lineage depletion using a mixture of biotinylated anti-mouse antibodies to Mac-1α (CD11b), Gr-1(Ly-6G/C), Ter119 (Ly-76), CD3ε, CD4, CD8a (Ly-2), and B220 (CD45R). Cells were subsequently stained with fluophore-conjugated antibodies against Kit, Sca, CD34, and CD16/32. LKS: Lin−Kit+Sca+; GMP: Lin−Kit+Sca−CD34+CD16/32+.48 Antibodies were purchased from BD Biosciences. FACS sorting strategies were provided in the supporting information figures. For CAG:GFP transgenic MEFs, sorting strategy is similar to that shown in Figure S1A. For human secondary fibroblasts, sorting strategy is similar to that shown in Figure S1C.
AP staining
AP staining was performed using the AP staining kit from StemGent (00-0055).
Western blot analysis
Cell lysates were harvested by directly lysing the cells with 2 × sampling buffer (Bio-Rad). Proteins were separated by SDS-PAGE, transferred onto nitrocellulose membranes (Bio-Rad). The membranes were blocked with 5% nonfat dry milk in TBS-Tween (TBST) for 1 hour, incubated with primary antibodies overnight at 4°C, followed by incubation with horseradish-peroxidase-conjugated secondary antibodies for 1 hour, and illuminated by enhanced chemiluminescence (ECL). Quantification of band intensity was done in Image J. β-actin antibody: Abcam, Ab20272 (1:10 000); β-tubulin antibody: Abcam, Ab6046 (1:5000); H2B antibody: Cell Signaling, 8135 (1:2000).
Growing cells on micropatterned surface
Micropatterned culture dishes are purchased from 4Dcell. Cells were seeded and cultured for 48 hours, followed by immunostaining analysis.
Immunostaining, image acquisition, and analysis
Cells or reprogramming colonies were fixed with 4% paraformaldehyde (PFA) at room temperature (RT) for 20 minutes, and then permeabilized with 0.5% Triton X-100 in DPBS at RT for 30 minutes. Samples were blocked with blocking buffer (5% normal goat serum [NGS], 0.3% Triton X-100 in DPBS) at RT for 1 hour. Primary antibody incubation was performed at 4°C overnight. Antibody was diluted with antibody buffer (1% BSA, 0.3% Triton X-100 in DPBS). After washing, samples were then incubated with secondary antibody prepared with antibody buffer at RT for 1 hour. Signal intensity was measured by Image J. For capturing fluorescent images of Nanog-positive reprogramming colonies, images were taken with the live cell imaging system (Molecular Devices) to obtain the image of the entire well. 3D image reconstruction was performed by acquiring z-stack images with Leica SP5, followed by reconstruction using Leica LAS X software. Nanog antibody: Cell Signaling, 4903 (1:200); MKL1 antibody: a gift from Topher Carroll (1:500); β-actin antibody: Abcam, Ab20272 (1:500).
CFSE/cell trace violet dye staining
CFSE/Cell Trace Violet dye staining was performed according to the manufacturer's instructions. Briefly, cells were trypsinized, washed, and resuspended with DPBS in 1 million cells/mL concentration. Cells were then incubated with CFSE/Cell Trace Violet dye at 37°C for 20 minutes, and supplied with 5 times the volume of complete culture medium, followed by incubation at 37°C for 5 minutes. Cells were centrifuged and resuspended in prewarmed culture medium with incubation for more than 10 minutes. And then, they were subject for either flow analysis or replating for further growth.
ACKNOWLEDGMENT
We thank Alejandro De Los Angeles for kindly providing us with the human secondary fibroblasts.
CONFLICT OF INTEREST
The authors declared no potential conflicts of interest.
AUTHOR CONTRIBUTIONS
X.H.: designed, performed, analyzed most of the experiments, wrote the manuscript; Q.W.: performed reprogramming experiments with human secondary fibroblasts, RNA-seq experiments, experiments on the relationship between CAG activity and cell cycle acceleration; J.Z.: performed RNA-seq data analysis; J.K., I.H.P.: performed the teratoma assay; X.C., A.A.H., A.E.E.: provided intellectual support; S.G.: supervised the project, designed experiments, wrote the manuscript.
DATA AVAILABILITY STATEMENT
The data that support the findings of this study are available on request from the corresponding author.
REFERENCES
Author notes
Funding information Connecticut Innovations, Grant/Award Number: 15-RMB-YALE-03
