


Abstract
Nasal, paranasal sinus and mucosal disorders are common symptoms in autoimmune rheumatic diseases. Soft tissue changes and fluid accumulation in the osteomeatal complexes and paranasal sinuses manifest as opaqueness on radiological images which can be assessed using visual scoring and computational methods on CT scans, but their results do not always correlate. Using MRI, we investigate the applicability of different image analysis methods in SLE.
We assessed paranasal sinus opaqueness on MRI from 51 SLE patients, using three visual scoring systems and expert-delineated computational volumes, and examined their association with markers of disease activity, inflammation, endothelial dysfunction and common small vessel disease (SVD) indicators, adjusting for age and sex-at-birth.
The average paranasal sinus volume occupation was 4.55 (6.47%) [median (interquartile range) = 0.67 (0.25–2.65) ml], mainly in the maxillary and ethmoid sinuses. It was highly correlated with Lund–Mackay (LM) scores modified at 50% opaqueness cut-off (Spearman’s ρ: 0.71 maxillary and 0.618 ethmoids, P < 0.001 in all), and with more granular variations of the LM system. The modified LM scores were associated with SVD scores (0: B = 5.078, s.e. = 1.69, P = 0.0026; 2: B = –0.066, s.e. = 0.023, P = 0.0045) and disease activity (anti-dsDNA: B = 4.59, s.e. = 2.22, P = 0.045; SLEDAI 3–7: 2.86 < B < 4.30; 1.38 < s.e. < 1.63; 0.0083 ≤ P ≤ 0.0375). Computationally derived percent opaqueness yielded similar results.
In patients with SLE, MRI computational assessment of sinuses opaqueness and LM scores modified at a 50% cut-off may be useful tools in understanding the relationships among paranasal sinus occupancy, disease activity and SVD markers.

In patients with SLE, paranasal sinus occupancy may be related to disease activity and small vessel disease.
MRI computational assessment of sinuses opaqueness can be useful in autoimmune rheumatic diseases.
Lund–Mackay scores modified at 50% cut-off can be useful in diseases with low prevalence of sinuses occupancy.
Introduction
The paranasal sinuses are the four paired air-containing cavities that surround the nasal cavity, named according to the bone in which they are found—maxillary, ethmoid, frontal and sphenoid. One of their possible roles include immunological defense [1]. The mucosa lining these cavities and the osteomeatal complexes (OMC), known as rhinosinusitis, is susceptible to infection and inflammation and is visible on MRI as opaque areas representing thickening of the soft tissue and, sometimes, fluid levels occupying the cavities. Chronic rhinosinusitis (CRS) has been associated with elevated risk of stroke and dementia [2, 3], and may directly lead to life-threatening intracranial complications [4]. Nasal and paranasal sinus disorders including CRS are often a comorbidity in chronic inflammatory diseases [5]. A previous study has reported that the prevalence of CRS in patients with SLE was 3.9% [6].
While the presence of rhinosinusitis in inflammatory conditions is widely accepted, its significance, interactions with other pathophysiological pathways and effects on progression of the condition are not well understood mainly due to the difficulties in their accurate assessment. Paranasal sinus occupancy can be identified through clinical questionnaires in combination with a physical examination, but radiography can precisely determine mucosal changes and polyp presence. Although CT is the ideal imaging modality clinically, due to its ability to provide details of bony structures, MRI can be used as an alternative [7] enabling investigation of these structures in addition to brain imaging variables in research studies. Different visual scoring systems are available to assess the severity of paranasal sinus opaqueness from radiological images. The commonly used Lund–Mackay (LM) system [8] assigns each sinus a score of 0 (no opacity), 1 (partial opacity) or 2 (complete opacity). Although this system has high reliability, numerous studies have shown that the LM scores do not correlate with patient symptoms, likely due to its coarseness and inability to differentiate the varying extent of partial opacity [9]. Subsequent studies, therefore, have attempted to modify the LM system by expanding the range of scores with finer gradation [10, 11], but their advantages over the LM scoring system are still to be verified. Recent studies have used software-based tools to measure sinus inflammation using volumetric calculations from CT scans, by means of manual delineation [12], and automatic segmentation using state-of-the-art deep learning techniques [13]. However, computational measurements from conventional MRI scans are still to be validated for this purpose. Moreover, it is not known whether or not the level of granularity of these other visual rating scales and MRI-derived computational measures add value over the more established LM scoring system in inflammatory diseases with low prevalence of paranasal sinus occupancy, and if so, to what extent.
The present study attempts to answer these questions by validating a semi-automated method to assess paranasal sinus opaqueness from routine MRI scans against visual scores all generated using MRI images in a sample of patients with SLE. Additionally, we investigated correlations between markers of endothelial dysfunction and disease activity with both visual scores and computational measurements, to document their applicability to inflammatory diseases known to have low prevalence of paranasal sinus occupancy. We hypothesize that our analyses will (i) ascertain the usefulness of computational measurements derived from MRI scans in assessing the paranasal sinus occupancy, and (ii) investigate associations between markers of endothelial dysfunction and disease activity with paranasal sinus occupancy in SLE. Given the reported association between endothelial dysfunction and small vessel disease (SVD) [14], the presence of SVD in SLE patients [15], and the association between ischaemic vascular disease and paranasal sinuses inflammation [16, 17], we also explore the association between paranasal sinuses occupancy and neuroimaging markers of SVD. We expect them to be associated regardless of the method used to assess paranasal sinus occupancy. We do not expect that for cohorts/diseases with low prevalence of sinus occupancy like the one this study analyses, increase on granularity in the visual scores for sinus opaqueness will be relevant.
Methods
Subjects
We analysed clinical and brain MRI data (details in Supplementary Methods, available at Rheumatology online) from 51 SLE patients of the Scottish Lupus Exchange Database, who provided written consent to participate in a study of brain changes in relation to disease activity and were recruited between April and December 2014 (UK Clinical Trials ID 15489) [15]. The study was approved by the South-East Scotland Research Ethics Committee 01, 14/SS/0003. Patients were seen by a consultant rheumatologist at a regional specialist SLE clinic, all met the updated ACR 1997 criteria for SLE [18], and had different disease severity and duration.
Clinical markers
We use two variables related to SLE disease degree: the SLEDAI 2000 and the SLICC damage index [19–21], and the C3 and C4 protein complement components and the double-stranded DNA antibodies of the IgG class (anti-dsDNA) as indicators of disease activity obtained from blood samples. We also use the following markers of inflammation and endothelial function: pro-inflammatory cytokine IL-6, fibrinogen, von Willebrand Factor antigen (vWF: Ag), and factor VIIIc (FVIIIc), ristocetin cofactor (vWF: RCoF) and homocysteine, all obtained from blood specimens [15, 22].
MRI acquisition
The MRIs were obtained from a GE Signa Horizon HDxt 1.5T scanner (General Electric, Milwaukee, WI, USA) equipped with a self-shielded gradient set (maximum gradient strength of 33 mT/m) and an eight-channel phased-array head coil. The imaging protocol was described previously [15, 22, 23]. In this study we used the T2-weighted images acquired axially with TR/TE = 8750/102 ms, slice thickness 2.5 mm, acquisition matrix 384 × 384, pixel width and height of 0.47 mm, voxel depth of 2.5 mm, resolution 2.133 pix/mm and bandwidth of 20.83 kHz, comprising 56 slices acquired during 5 min and 59 s.
Neuroimaging markers of small vessel disease
In our analyses we use white matter hyperintensities (WMH), enlarged perivascular spaces (PVS) and SVD visual scores from the primary study database, graded following the Standards for Reporting Vascular Changes on Neuroimaging (STRIVE) guidelines [24]. The Fazekas scale [25] was used to assess WMH, PVS were assessed in the basal ganglia and centrum semiovale using a five-point scale [26–28], and the total SVD score was calculated as per Staals et al. [29].
Paranasal sinus occupancy
Visual rating scores
We explore three different scoring systems: a modified version of the LM [8, 30], Okushi [10] and Zinreich [11], schematically represented in Supplementary Table S1 (available at Rheumatology online), all derived from the LM system (see Supplementary Methods, available at Rheumatology online). We implemented and evaluated a modification of the LM system, rating 0 when no opacity was present, 1 if the nasal cavity had <50% occupancy or 2 if the cavity was perceived as having >50% occupancy, to differentiate between ‘less severe’ and ‘more severe’ opacity. Scores of inferior and posterior ethmoids were averaged for the analyses against clinical variables and evaluation of the computational assessment.
Ratings were performed by two observers independently using the LM scoring system as described, and by the same observer twice using all the three scoring systems, blind to all clinical information and the ratings of the other observer or previous own ratings. The intra-/inter-observer agreement was determined through the weighted Kappa coefficient as per http://vassarstats.net/kappa.html (Copyright Richard Lowry 2001–2021), marginal homogeneity tests for total scores and the Kruskal–Wallis test for comparing the distribution of the scores in the sample per individual sinuses.
Computational measurements
Using the MRIcron software (https://www.nitrc.org/projects/mricron), each sinus cavity was manually outlined along the bony landmarks that delineate the sinuses (excluding the OMC) in every T2-weighted MRI axial slice that contained one or more cavities [9] (Fig. 1). The area inside the drawn boundaries was filled automatically using the same software as detailed in the Supplementary Material, available at Rheumatology online.
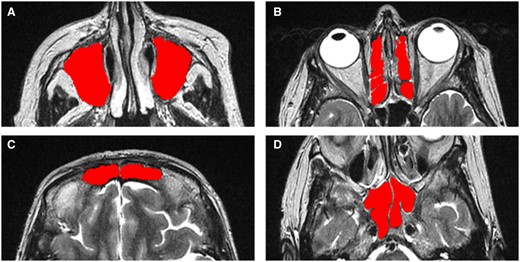
Axial MRI images of a patient showing the four different pairs of sinuses that were manually segmented using the MRIcron software, and these region of interest masks were used for calculating the computational volumes. (A) Maxillary sinuses. (B) Ethmaid sinuses. (C) Frontal sinuses. (D) Sphenoid sinuses
Statistical analysis
The correlations between the computational measurements and the visual ratings were calculated using Spearman’s rank-order correlation coefficient. Multivariable regression models with the sinus occlusion as predictor and the clinical variables as outcome, controlling for age and sex, was performed to examine putative associations between the computational measurements and, separately, the LM visual scores, with the markers of endothelial dysfunction, SVD and disease activity. All analyses were performed in Matlab R2022a. For categorical clinical variables the model used was an ordinal multinomial logistic regression model, whereas for continuous clinical variables we used the generalized linear model. All regression models were repeated adjusting, additionally, for (i) vascular risk factors (i.e. hypertension and high cholesterol) and (ii) self-reported comorbidities considered relevant for the analyses (i.e. SS and Raynaud’s syndromes) (see details in Supplementary Methods, available at Rheumatology online).
Results
Sample characteristics
Fifty-one SLE patients [mean age 48.8 (14.3) years; range 20–76 years] provided data for the study. Forty-seven (92%) of them were women. None had diabetes, only 6 (12%) were smokers, 9 (18%) were hypertensive and 18 (35%) had total cholesterol levels >5.2 mmol/l (i.e. threshold considered in previous publications for dichotomizing them into high and low [15]). All patients were asymptomatic regarding any sinus involvement, and none of them had any previous clinical history of sinus infection. Only one patient had a tooth infection 2 weeks before the clinical assessments and MRI examination. Four patients (8%) reported having SS and eight (16%) reported having Raynaud’s syndrome. The sample clinical characteristics we analysed are shown in Table 1.
Demographic, clinical and neuroimaging characteristics of the sample (n = 51)
| Parameters | n (%), mean (s.d.) or median (Q1–Q3) |
|---|---|
| Demographics | |
| Age, years | 48.8 (14.3) |
| Female patients | 47 (92%) |
| Disease activity | |
| SLEDAI (0–105) | 2 (0–4) |
| SLICC (0–47) | 0 (0–1) |
| C3, g/L | 1.21 (0.31) |
| C4, g/L | 0.19 (0.08) |
| Anti-dsDNA, IU/mL | 32.3 (39.4) |
| Inflammation | |
| IL-6 | 2.06 (1.55) |
| Fibrinogen | 2.92 (0.54) |
| Endothelial (dys)function | |
| vWF: Ag | 1.71 (0.66) |
| FVIIIc | 1.37 (0.44) |
| vWF: RCoF | 1.37 (0.4) |
| Homocysteine | 18.89 (6.66) |
| SVD markers | |
| WMH PV Fazekas scores (0–3) | 1 (1–1) |
| WMH Deep Fazekas scores (0–3) | 1 (0–1) |
| WMH Total Fazekas scores (0–6) | 2 (1–2) |
| PVS BG scores (0–4) | 2 (2–3) |
| PVS CSO scores (0–4) | 3 (3–4) |
| PVS Midbrain scores (0 or 1) | 1 (1–1) |
| Total SVD score (0–4) | 1 (1–1) |
vWF: Ag: von Willebrand Factor antigen; vWF: RCoF: von Willebrand Factor ristocetin cofactor; WMH: white matter hyperintensities; PVS: perivascular spaces; PV: periventricular; BG: basal ganglia; CSO: perivascular spaces centrum semiovale; SVD: small vessel disease.
Paranasal sinus occupancy
Visual scores—intra-/inter-observer reliability
Table 2 illustrates the breakdown of the cumulative ratings (i.e. considering all individual sinuses: maxillary, ethmoid, frontal, sphenoid and OMC, for left and right hemispheres) in the LM scoring system, considered as reference. The intra-observer agreement was κ = 0.8419, s.e. = 0.0221, 95% CI = 0.7985, 0.8553, and the inter-observer was κ = 0.7329, s.e. = 0.0302, 95% CI = 0.6737, 0.7921. Homogeneity tests revealed differences in the scores 0 and 1 between observers and in repeat tests. In the inter-observer analysis 0.098% (4 assessments) were graded higher by the Observer 2, compared with 14.31% (72 assessments) which were graded higher by Observer 1. There were no noticeable differences between scores 1 and 2.
Inter- and intra-observer reliability results; homogeneity analysis of the scores in all sinuses
| Intra-rater analysis | Inter-rater analysis | ||||||||
|---|---|---|---|---|---|---|---|---|---|
| Observer 1 | Observer 1 | ||||||||
| Score 0 | Score 1 | Score 2 | Score 0 | Score 1 | Score 2 | ||||
| Observer 1R | Score 0 | 280 | 43 | 0 | Observer 2 | Score 0 | 321 | 72 | 0 |
| Score 1 | 6 | 143 | 1 | Score 1 | 4 | 74 | 1 | ||
| Score 2 | 0 | 0 | 37 | Score 2 | 0 | 1 | 38 | ||
1R: repeat test done by Observer 1.
In terms of the individual scores per sinuses, no significant inter-observer differences were found in the scoring of the frontal and sphenoid sinuses (Kruskal–Wallis: P = 0.905 and P = 0.977, respectively). However, scores in the maxillary and ethmoid sinuses differed between observers (Kruskal–Wallis: P = 1.611 × 10⁻⁹ and P = 7.314 × 10⁻¹⁰ respectively).
Visual scores—performance in the study sample
Table 3 shows the overall scores for all sinuses, from each visual scale, performed by the same observer. From a total of 612 sinuses (i.e. 6 sinuses × 2 hemispheres × 51 patients), 56.21% did not exhibit any opaqueness, and 90.36% had <25%. Only seven sinuses (1.14%) had sinus opaqueness >50%. No significant difference was found between the scoring systems in overall or individual (i.e. per sinus) scores. The slight increase in the mean score with the increase in granularity of the scoring system was driven by the few sinuses (i.e. 7/612) that had high occupancy (Fig. 2).
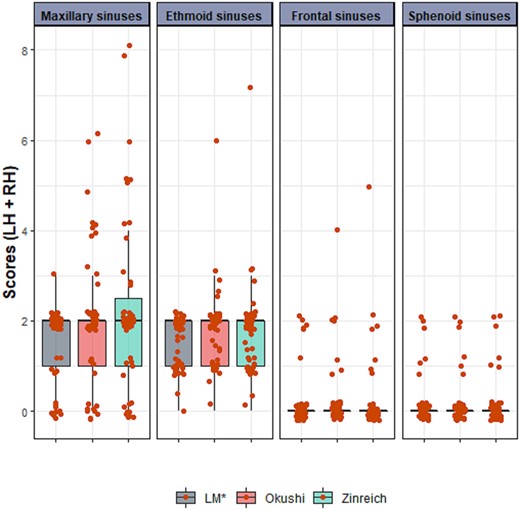
Distribution of the scores per-sinus and per-scoring system in the sample. LH + RH: left hemisphere + right hemisphere. Red points represent individual scores, jittered for enhanced visibility
Visual scores per scoring system
| Scoring system | Score 0 (%) | Score 1 (%) | Score 2 (%) | Score 3 (%) | Score 4 (%) | Score 5 (%) | Median (Q1–Q3) | Mean (96% CI) |
|---|---|---|---|---|---|---|---|---|
| LM* | 357 (58.33) | 217 (35.46) | 38 (6.21) | 6 (4–8) | 5.75 (0.00–11.00) | |||
| Okushi | 344 (56.21) | 216 (35.29) | 47 (7.68) | 4 (0.65) | 1 (0.16) | 6 (4–9) | 6.39 (1.20–13.40) | |
| Zinreich | 344 (56.21) | 209 (34.15) | 52 (8.50) | 4 (0.65) | 2 (0.33) | 1 (0.16) | 6 (4–9) | 6.63 (1.20–15.00) |
LM*: Lund–Mackay scoring system modified considering 50% occlusion (instead of 100%) as threshold.
In terms of sinuses occupancy per patient, 10 patients (19.61%) did not have any (total LM score 0), 5 patients (9.80%) had a total LM score of 1, 11 (21.57%) had a total score of 2, and 8 (15.69%) had a total score of 3. Only 33.33% of the sample had levels of opacity above the threshold considered in previous works [31] to identify ‘presence’ of sinus occupancy (i.e. LM total score of 4 and above).
Computational measurements
The total mean volume of the sinus cavities was 48.59 (13.89) ml, with median (interquartile range) volume of opacity of 0.67 (0.25–2.65) ml. The results per sinus and their correlation with the LM visual scores are shown in Table 4. All correlations were statistically significant (P < 0.0001). In terms of percentage opacity, the total average per patient was 4.55 (6.47%) of the sinuses’ total volume, with the ethmoid sinuses showing the highest values except in 12 patients who did not have any opacity detected in the ethmoids. On the contrary, in the sphenoid sinuses, only 12 patients had opacity, this being 0.01 ml or less in five of them, between 0.5 and 0.9 ml in four, and 3.6 ml in one patient. In the maxillary sinuses 10 patients did not have any opacity, and in the frontal sinuses 34 patients.
Average volumes of sinuses and their opacity in the sample, and correlation with the LM visual ratings
| Sinus | Total volume (ml) | Volume occupation (ml) | Percentage occupation (%) | Correlation with LM visual ratings | |
|---|---|---|---|---|---|
| ρ | r (95% CI) | ||||
| Maxillary | 26.21 (8.82) | 0.29 (0.02–1.45) | 4.58 (8.07) | 0.706 | 0.669 (0.482, 0.798) |
| Ethmoid | 8.36 (2.30) | 0.25 (0.02–0.97) | 8.38 (12.04) | 0.618 | 0.647 (0.452, 0.783) |
| Frontal | 3.93 (2.48–6.65) | 0.00 (0.00–0.02) | 2.21 (6.29) | 0.584 | 0.885 (0.806, 0.933) |
| Sphenoid | 8.86 (7.06–11.98) | 0.00 (0.00–0.00) | 1.07 (4.04) | 0.516 | 0.791 (0.659, 0.876) |
Average volumes are given as mean (s.d.) or median (Q1–Q3) depending on the distribution of values across the sample. The LM visual ratings were generated by the experienced analyst considering 50% occlusion (instead of 100%) as threshold. LM: Lund–Mackay.
Correlation of computational measurements with LM, Okushi and Zinreich scores, all assessed by the same observer, are of similar order to the correlations shown in Table 4 using the assessments done by the other observer, although slightly lower for the maxillary and ethmoid and higher for sphenoid and frontal sinuses: 0.514 < ρ < 0.671 for the maxillary, 0.451 < ρ < 0.530 for the ethmoid, 0.579 < ρ < 0.647 for the frontal and ρ = 0.609 for the sphenoid sinuses.
Association between sinuses occupation and clinical indicators
We used both the LM scores and computational measurements to investigate their associations with SLE disease activity and clinical variables, controlling for age and sex. Here, only maxillary and ethmoid sinuses were used, as data for the frontal and sphenoid sinus were heavily skewed. However, we also calculated a total score across all sinuses thereby capturing effects across all sinus cavities (Supplementary Table S2, available at Rheumatology online). Two indicators of SLE disease activity and SVD burden were associated with paranasal sinus occupancy assessments: SLEDAI scores (for values 3–7, associations with total LM scores were 2.86 < B < 4.30; 1.38 < s.e. < 1.63; 0.0083 ≤ P ≤ 0.0375) and anti-dsDNA (associations with percentage of total volume occupancy: B = 1.78; s.e. = 0.91; P = 0.058 and with LM scores: B = 4.59; s.e. = 2.22; P = 0.045) (Supplementary Table S2, available at Rheumatology online). Also, all imaging markers of small vessel disease analysed, namely WMH, PVS and total SVD scores, were associated with the sinus occupancy assessments (Supplementary Table S2, available at Rheumatology online). All results were consistent regardless of the assessment method (i.e. computational or visual scores).
When analyses were repeated, adding the presence/absence of the relevant comorbidities to age and sex as covariates (see Supplementary Table S3, available at Rheumatology online), the results were similar: SLEDAI scores and anti-dsDNA remained associated with paranasal sinus occupancy, as well as all imaging markers of SVD. When the models were adjusted for hypertension and high cholesterol in addition to age and sex (full results in Supplementary Table S4, available at Rheumatology online), again, the associations remained for SLEDAI scores, anti-dsDNA, and Fazekas, SVD total and PVS visual ratings although with the latter, associations were weaker. Total Fazekas scores were strongly associated with maxillary, ethmoid and total sinus occupancy in all models (B > 4 × s.e.; P < 0.0001).
Discussion
In our sample of 51 patients with SLE, paranasal sinus percent occupancy, with similar prevalence as previous reports [6], was moderately associated with disease activity, PVS-visual ratings and total SVD scores, and strongly associated with total WMH burden, but not with markers of endothelial dysfunction or inflammation. The association of paranasal sinus percent occupancy with PVS scores in the basal ganglia, a marker of SVD, when considered relevant comorbidities, weakened after adjusting for vascular risk factors. Computational measurements correlated with visual scores and yielded practically the same results in terms of association with clinical parameters. Consistent with our hypothesis, in this cohort, the increase in granularity while assessing nasal and paranasal sinuses occupancy, best represented by the percentage opacity generated from the computational measurements, did not confer an advantage over the coarse visual assessment represented by the LM scores, modified to reflect two levels of severity in the occupancy.
Computational measurements vs visual ratings
The computational measurements and all the visual scores had a high correlation. To the best of our knowledge this is the first study using computational measures of paranasal sinus occupancy using routine MRI scans. A previous study using CT scans has also reported high correlation between the computational measurements obtained and LM scores [13], and studies presenting other methods, also developed for CT scans, have reported correlation with sinonasal symptoms instead [9, 12, 30]. However, perhaps the higher correlation values between LM visual scores and the computational measurements reported here, and between the LM and Okushi and Zinreich scores, is partly owed to the application of a modification of the LM scoring system using a cut-off of 50% opacity to indicate less vs more severe occupancy, instead of the 99% proposed by Lund and Mackay [8]. We did not find superiority of the more granular scoring systems (Okushi and Zinreich) over the LM scoring system we applied, but this agrees with Garneau et al. [9], who used the traditional LM scores.
Associations with clinical variables
There have not been many studies investigating the correlation/association between clinical variables and computational measurements of paranasal sinus occupancy, as most of them explored the relationship between volumetric measurements and symptom scores in CRS patients [9, 12, 30]. However, the results obtained are supported by other studies on SLE and SVD. For example, a previous study of 73 SLE patients reported that patients with moderate-to-high SLEDAI scores had a significantly higher frequency of nasal mucosal abnormalities compared with those with no-to-mild disease activity [32]. In our study, SLEDAI scores of 3–7 (from the 0–10 range this sample has), were associated with percent opacity in maxillary, ethmoids and total sinuses. It is worth noting that in this sample sinus occupancy is chronic, i.e. none of the patients had fluid in sinuses due to recent acute trauma.
Similar borderline association was found between anti-dsDNA and total sinus occupancy. Anti-dsDNA antibodies are associated with high disease activity in SLE, and a prior study has noted a significant positive correlation between SLEDAI scores and anti-dsDNA titre [33]. Anti-dsDNA antibodies could have deposited in the sinuses by binding to cross-reactive antigens on the mucosa, causing inflammation [34]. A study of histologic sections from the nasal mucosa of 18 female SLE patients with bad nasal breathing and no anatomical nose deformities reported oedema in the upper lamina propia accompanying vascular alterations [35]. It also reported perivascular inflammatory infiltrates and vascular ectasia, which the authors manifested had the characteristics of ‘aspecific vasomotor rhinitis’, where the nasal mucosa may influence the local inflammation and vasculitis ‘induced by the immune complex in circulation’ [35]. The varying degrees of involvement from the different sinuses in SLE suggest that the site and degree of the occupancy may be helpful in aiding physicians to predict the levels of disease-associated biomarkers and, potentially, in the selection of treatments [30].
The SVD markers analysed, especially total WMH burden and PVS scores in the basal ganglia, were associated with paranasal sinus occupancy in this sample. Rhinosinusitis has been associated with the risk of ischaemic stroke [36, 37], having more prevalence in patients with cerebrovascular disease [16]. MRI-identified incidental paranasal sinusitis has been reported to be strongly associated with cerebrovascular disease [17]. In this sample of SLE patients, a previous study reported a greater total SVD score compared with healthy controls and ischaemic stroke patients, with higher PVS and WMH scores than normal controls, and similar or more SVD features than stroke patients with similar age despite having lower prevalence of vascular risk factors [15]. Therefore, our results are not surprising. Increasing PVS numbers in SLE patients have been linked to the neuroinflammatory activity as a result of autoantibody-induced inflammation in the CNS as well as SLE-related inflammation in the maxillary sinuses [38]. A population-based case–control study on the association between CRS and premorbid autoimmune diseases, including SLE, on 30 611 CRS patients with 122 444 individuals without CRS, found that CRS patients had a higher significant association with SLE [adjusted odds ratio 1.69 (95% CI 1.26–2.25)] [39].
Strengths and limitations
To the best of our knowledge, this is the first study to present and evaluate computational measures of paranasal sinus occupancy using clinically acquired routine brain MRI. Also, we use a modification of the LM scoring system that shows high inter-/intra-observer agreement and high correlation with a computational assessment of the percentage of occupancy per sinus, and overcomes the limitations of the original LM scoring system for its application in individuals with a low degree of paranasal sinus occupancy, as it is shown to yield the same results in relation to clinical indicators as the percentage opacity per sinus. Another strength of our study is the comparison of the methods used to explore the degree and influence of sinus occupancy in SLE, with the more granular, namely the Okushi and Zinreich, scoring systems providing comprehensive information on the application of these state-of-the-art clinical instruments in SLE. In addition, analyses are repeated accounting not only for vascular risk factors but also for comorbidities relevant to the analyses [40, 41]. The associations found, explored in SLE for the first time, open an avenue of research that will require confirmation in larger samples.
Although our sample was small and the majority of patients were female (F:M = 47:4), the gender split in our sample is consistent with the gender prevalence of SLE [42], and our sample size is proportionate with and representative of the incidence of SLE in a region. Given the role of environmental factors in SLE activity [43], including patients from different environments could have added confounds in the analyses. The lack of a control group (e.g. healthy individuals without SVD or SLE) could be considered a limitation. However, previous studies in SLE patients with CRS have argued that incidental paranasal sinus occupancy is relatively common, affecting 27% to 45% of individuals without CRS [12]. A prior study that performed CT imaging of the paranasal sinuses on patients with and without CRS reported that the mean LM score was 4.3/24 for patients without CRS and 9.8/24 for patients with CRS [44]. Since the LM score in healthy individuals is not 0, including a control group may have affected the interpretation of the research findings in cases of mild sinuses occupancy.
The computational method presented here is semi-automatic, requiring manual intervention. This is not only time-consuming and labour-intensive, but is highly dependent on the image analyst’s skills and training, limiting the applicability of the method and reproducibility of the results. Modifications are needed to automate the segmentation of the sinuses and their occupancy, enabling automatic calculation of the percentage of opacity [45]. Furthermore, the OMC was not assessed by the computational method and its obstruction is relevant for studying sinus occlusion as it may cause CRS symptoms [46]. Although final visual inspection and manual removal of false positives would certainly be always necessary, a fully automatic and reliable approach would be needed to explore the influence of mucus accumulation in human health.
This study only looked at occupancy in the paranasal sinuses and not osteitic changes or bone remodelling. Patients with osteitis have been reported to have higher LM scores compared with those without [47, 48]. Also, studies have noted increased bony thickness in the maxillary sinuses of CRS patients in comparison with normal subjects [49, 50]. Despite their potential to impact clinical outcomes [51], osteitis and bone thickening in the paranasal sinuses have not been extensively studied, and further studies are needed to understand their significance.
Supplementary material
Supplementary material is available at Rheumatology online.
Data availability
The imaging and clinical data analysed in this project are not publicly available as they contain personal information that could compromise the privacy and confidentiality of the participants. The data are stored in a database and access is restricted to those involved in research on SLE patients, and on this basis can be made available for research purposes upon request. The output from the MATLAB scripts is provided as part of the supplementary materials.
Funding
This work was supported by Row Fogo Charitable Trust [BROD.FID3668413 to M.C.V.H.]; the European Union Horizon 2020 [PHC-03-15, 666881, ‘SVDs@Target’ to J.M.W.]; the Fondation Leducq Network for the Study of Perivascular Spaces in Small Vessel Disease (16 CVD 05); the Stroke Association [SA PDF 18\100026 to S.J.W.]; Lupus UK; and the University of Edinburgh. It is also supported by the Galen and Hilary Weston Foundation under the Novel Biomarkers 2019 scheme (ref UB190097, to J.M.W. and M.C.V.H.) administered by the Weston Brain Institute, and the UK Dementia Research Institute at the University of Edinburgh where the work was carried out, which receives its funding from DRI Ltd, funded by the UK MRC, Alzheimer’s Society and Alzheimer’s Research UK.
Disclosure statement: The authors declare no conflicts of interest.

Comments