


Abstract
To estimate the prevalence of long-term exposure to glucocorticoids (GCs) and to identify factors associated with, and variations in prescribing practices over time and across recruiting countries.
We included patients with SSc having a visit recorded in the EUSTAR database from January 2013 onward. We analysed the prevalence and the main features of GCs users, their exposure to GCs over time, and their GCs dosages. Multivariable linear regression was used to analyse the factors identified as associated with GCs intake duration. Time trends, and variations in GCs utilization across recruiting countries were explored. Missing data were imputed using multiple imputation with chained equations.
The 9819 patients included were mostly females (85%), the majority had lcSSc (73%), and the median age was 58 years. At baseline, 34% of patients (n = 2769/8109) (48% dcSSc vs 29% lcSSc) were on GCs, and the median dose was 7.5 mg/day. GCs users were more frequently males and anti-Scl70 positive, and more commonly had dcSSc and more severe disease. On average, GCs users spent 25% of their follow-up time (median 33.2 months) on GCs, with no significant between-subsets difference. Notably, 33% (n = 971/2959) and 22% (n = 647/2959) of patients followed up for >1 year had received GCs for >6 and >12 months, respectively. Multivariable analysis showed that patient and disease characteristics poorly explained the variability in GCs exposure (adjusted-R2 = 0.06, P < 0.001). GCs utilization varied within and across countries, and gradually decreased over time (36% in 2013 vs 23% in 2018).
GCs are widely and long-term prescribed in SSc, with significant between-countries and within-country differences. A gradual decrease in their utilization has been observed.
Glucocorticoids are widely and long-term prescribed in SSc.
Glucocorticoids users spent 25% of their follow-up time on these agents.
Glucocorticoids utilization is variable within and across countries, and has gradually decreased over time.
Introduction
Although glucocorticoids (GCs) are largely prescribed in rheumatology for their anti-inflammatory and disease-modifying action, their role in SSc is not well established [1, 2], along with the magnitude of their use in daily care.
The rationale for prescribing GCs comes from the evidence that SSc patients with early disease present an inflammatory component that can theoretically respond to steroids [3, 4]. Perivascular and tissue inflammatory infiltrates consisting of mononuclear cells and mainly CD4+ lymphocytes are observed in the skin of patients with early dcSSc [5, 6]. Moreover, GCs can decrease vascular leakage, and the expression of adhesion molecules on endothelial cells [7], mechanisms involved in the early phase of SSc pathogenesis. GCs are also prescribed to control symptoms. Experience accumulated in the clinical setting suggests that they are useful in resolving musculoskeletal inflammatory manifestations, and SSc patients receiving GCs often report lessening of itchiness and fatigue, and improvement in appetite [1, 2].
However, the use of GCs remains controversial in SSc because of the lack of solid evidence demonstrating their anti-fibrotic efficacy when administered alone or in combination with other immunosuppressive drugs. Additionally, important arguments against their use are the established association with scleroderma renal crisis and additional, SSc-independent, general adverse events [1, 8]. Possible harmful effects of GCs include the inhibition of prostaglandins and the amplification of responses to vasoconstrictive substances like catecholamines [1–7]. These actions could potentially be dangerous in SSc, in which vascular damage can result in RP, digital ulcers, pulmonary hypertension, and scleroderma renal crisis [1–7].
Despite these limitations, it seems that the use of GCs, and low-dose GCs in particular, is widespread in SSc. Data from cross-sectional studies [9–12] and a survey of physicians [13] suggest that up to one-third of patients with lcSSc and up to half of patients with dcSSc are on GCs at any given time point. However, in contrast to the situation for other systemic rheumatic diseases, no study has investigated the utilization of long-term GCs in SSc. Estimating GCs exposure, and understanding the main features associated with their long-term use, is pivotal in achieving better and more reasoned prescription, avoiding related harms, and identifying potential targets for improvement of quality management.
Herein, using data from a large international database, we have estimated to what extent SSc patients are exposed to GCs over time, identified the main features of patients receiving long-term GCs, and explored variations in prescribing patterns across countries and over time.
Methods
EUSTAR database, inclusion criteria, and ethics
This study used prospectively collected data from the EUSTAR database. The structure of the EUSTAR database and minimum essential dataset have been described previously [11, 14]. A set of demographic, clinical, imaging and treatment data are collected at least yearly for each patient. We included all patients having at least one visit from 1 January 2013 to 17 May 2019, and available data on GCs in at least one observation. The EUSTAR database collects at each visit information on the use and dose of oral GCs, expressed as daily dose (milligrams) of prednisone-equivalent.
Local ethics committee permission was obtained for each EUSTAR centre and informed consent (where appropriate according to local ethics regulations) was obtained from patients prior to EUSTAR enrolment.
Prevalence of glucocorticoids at study entry, time trends, and exposure over time
For each patient, we calculated the prevalence of any GCs use at study entry and the respective dosages. In order to study temporal trends, a cross-sectional analysis evaluating the yearly prevalence of GCs users was performed between 1 January 2013 (when GCs use and dose started to be documented) and 17 May 2019. The annual prevalence of GCs use was defined as the proportion of users per 100 patients with SSc for the corresponding year.
For every patient, we identified episode(s) of GCs use over the entire follow-up period. Several treatment episodes from a single patient could have been included. The duration of each episode was taken as the time between two consecutive visits if GCs were prescribed at both visits. If prescribed at a given visit, but discontinued at the following one, the time spent on GCs for this treatment episode was considered to be half of the period between the two observations, to account for potential between-visit tapering. Where information was lacking, we carried forward the GCs status (i.e. ‘user’ or ‘non-user’) at the most recent available visit. In the case of patients on these drugs at the last observation, we added 6 months to the total time spent on GCs to account for potential tapering of the drug. Time spent on GCs was then calculated by summing the durations of each treatment episode since study entry, and it was expressed in months. For patients with no available information on GCs use at baseline, the total follow-up time was calculated from the date of the first visit with information available on GCs use onward, and adding 6 months to the total follow-up time. Time spent on GCs was then normalized by the overall follow-up time, to obtain, for each patient, the percentage of time spent on GCs.
Subgroup analyses
Prevalence of GCs utilization at study entry, time trends, time spent and proportion of time spent on GCs, were also evaluated in the subgroup of patients with a short (<3 years) disease duration, and in patients with lcSSc vs dcSSc. We also investigated the proportion of users at baseline and the median proportion of time spent on GCs across the main recruiting countries (those countries for whom >100 patients were included).
Statistical analysis
For categorical variables, data were presented as frequencies and percentages. Continuous variables were expressed as median (range, interquartile range). The annual prevalence of GCs use was defined as the yearly proportion of GCs users/100 patients. For GCs users, association between the median proportion of time spent on GCs per country and the median proportion of time spent on immunosuppressants per country was assessed by Spearman correlation.
Factors associated with the proportion of time spent on GCs were determined based on expert knowledge, and the association was evaluated using a multivariable linear regression model using age, sex, time from first non-RP symptom, SSc subset, current presence of digital ulcers, presence of puffy fingers, modified Rodnan skin score, worsening of skin symptoms, worsening of cardiopulmonary symptoms, worsening of vascular symptoms, presence of joint synovitis, presence of tendon friction rubs, presence of pericardial effusion, anti-Scl70 positivity, forced vital capacity (FVC) (% of predicted value), diffusing lung capacity for carbon monoxide (DLCO) (% of predicted value), presence of interstitial lung disease, creatine kinase elevation, and CRP elevation.
Missing data were imputed with multiple imputation using the R package MICE and the predictive mean matching algorithm. For the imputation model, all the above variables, except age and sex, were used.
A P-value of <0.05 was considered statistically significant. Analyses were performed using R 4.1 statistical software (R Development Core Team, Vienna, Austria).
Results
Baseline characteristics, and prevalence of and factors associated with glucocorticoids use, at study entry
We studied 9819 of 9989 patients with data available on GCs use over time, of whom 8109 (82%) had information on baseline GCs use.
The 9819 patients included were mostly females (85%), were in the lcSSc subset (73%), had a median age of 58 years (IQR 48—67) and had median disease duration from the first non-RP symptoms of 8 years (IQR 3.3—14.4). Less than one-tenth (n = 724; 7%), and about one-fifth (n = 1896; 19%) of patients had <1-year and <3-year disease duration, respectively. The main characteristics of the disease at baseline are summarized in Table 1.
Characteristics of SSc patients included in the study
| Characteristics | Overall sample | Not on GCs | On GCs | P | Missing data (%)a |
|---|---|---|---|---|---|
| N = 9819 | N = 5340 | N = 2769 | |||
| Age, median (IQR) | 58 (48–67) | 58 (48–67) | 57 (47–67) | 0.253 | 0 |
| Male sex, n, % | 1476 (15) | 734 (14) | 490 (18) | <0.001 | 0 |
| Body weight, kg, median (IQR) | 65 (57–75) | 65 (57–74) | 65 (56–75) | 0.983 | 11 |
| Disease characteristics | |||||
| lcSSc subset, n, % | 6697 (73) | 3965 (80) | 1645 (63) | <0.001 | 6 |
| Disease duration since first non-RP symptom, median (IQR), years | 8 (3.3–14.4) | 7.5 (3–14) | 7.5 (3–14) | 0.124 | 15 |
| mRSS, median (IQR) | 5 (2–11) | 5 (2–9) | 7 (2–14) | <0.001 | 15 |
| RP, n, % | 9086 (95) | 5043 (96) | 2602 (96) | 0.664 | 3 |
| Intestinal symptoms, n, % | 2325 (24) | 1218 (23) | 703 (26) | 0.013 | 3 |
| Puffy fingers, current, n, % | 3411 (42) | 1966 (43) | 966 (41) | 0.025 | 17 |
| Current digital ulcers, n, % | 1113 (14) | 620 (12) | 436 (17) | <0.001 | 18 |
| Joint synovitis, n, % | 1084 (11.6) | 392 (8) | 538 (21) | <0.001 | 4 |
| Worsening of finger vascularization within the last month, n, % | 1773 (20) | 971 (20) | 603 (24) | <0.001 | 9 |
| Worsening of skin within the last month, n, % | 1208 (14) | 629 (13) | 456 (18) | <0.001 | 9 |
| Worsening of cardiopulmonary manifestation within the las month, n, % | 1204 (11) | 449 (9) | 445 (17) | <0.001 | 8 |
| Pericardial effusion, n, % | 432 (6) | 192 (5) | 187 (9) | <0.001 | 28 |
| Renal crisis, ever, n, % | 142 (2) | 63 (1) | 55 (2) | 0.006 | 2 |
| Disease activity score 2001, score, median (IQR) | 3 (2–5) | 2 (1–5) | 4 (2–6) | <0.001 | 0.5 |
| DLCO/SB, median (IQR), % of predicted value | 69 (56–81) | 71 (59–83) | 64 (50–77) | <0.001 | 26 |
| FVC, median (IQR), % of predicted value | 97 (81–110) | 100 (85–113) | 90 (74–105) | <0.001 | 21 |
| Fibrosis at lung HRCT, n, % | 2519 (45) | 1048 (36) | 1123 (60) | <0.001 | 43 |
| Laboratory parameters | |||||
| Creatine kinase elevation (>3 ULN), n, % | 667 (8) | 330 (8) | 274 (12) | <0.001 | 19 |
| CRP elevation, n, % | 1991 (23) | 924 (19) | 822 (33) | <0.001 | 28 |
| ACA positive, n % | 3543 (42) | 2366 (50) | 646 (27) | <0.001 | 14 |
| Topo I positive, n % | 2799 (33) | 1264 (27) | 1067 (42) | <0.001 | 13 |
| Anti-RNA polymerase III, n, % | 374 (7) | 226 (7) | 105 (7) | 0.854 | 43 |
| Treatment | |||||
| CYC, n, % | 843 (10) | 256 (5) | 566 (21) | <0.001 | 15 |
| MTX, n, % | 1479 (18) | 670 (13) | 780 (29) | <0.001 | 16 |
| MMF, n, % | 990 (12) | 406 (8) | 563 (21) | <0.001 | 15 |
| AZA, n, % | 763 (9) | 282 (5) | 462 (17) | <0.001 | 16 |
| Rituximab, n, % | 252 (3) | 80 (1.5) | 161 (6) | <0.001 | 0 |
Rate of missing data for patients with available data on glucocorticoids.
GCs: glucocorticoids; IQR: interquartile range; mRSS: modified Rodnan skin score; DLCO/SB. single-breath diffusing capacity for carbon monoxide; FVC: forced vital capacity; HRCT: high-resolution CT; ULN: upper limit of normal.
Of the 8109 patients with data available on GCs at study entry, 2769 (34%) were considered ‘users’, and they had a median daily dose of 7.5 mg (IQR 7.5–15], with higher figures for dcSSc compared with lcSSc patients (966/1991, 48% vs 1645/5610, 29%; P < 0.001) (Table 1). A minority of patients had been prescribed >15 mg/day (n = 146; 2%) prednisone equivalent. On average, patients receiving GCs at baseline were more frequently males, and the majority had dcSSc, were anti-Scl70 positive, reported more commonly worsening of skin, cardiopulmonary and vascular conditions, had overall more active disease, had more joint synovitis and pericardial effusion, had higher CRP levels, and had worse FVC and DLCO values (Table 1). Patients treated with >15 mg/day vs those receiving ≤15 mg/day of prednisone equivalent were more frequently males, had more often dcSSc, had a shorter period since diagnosis of SSc, had a higher prevalence of worsening of skin and respiratory symptoms, had lower respiratory volumes, had more often creatine kinase elevation, and had overall higher disease activity (Supplementary Table S1, available at Rheumatology online). Over the whole sample, GCs were in most cases (64%) associated with parallel use of an immunosuppressive drug, mainly MTX (29%), CYC (21%), MMF (21%), AZA (17%) or rituximab (6%).
In the subgroup of patients who had a shorter period since diagnosis of SSc (<3 years from first non-RP symptom onset) (n = 1896), the prevalence of users was in line with that observed in the entire sample (51% for dcSSc vs 30% for lcSSc, P < 0.001), but the proportion of patients with dcSSc receiving GCs in combination with immunosuppressors was higher, at 80%.
Exposure over time to glucocorticoids
During a median follow-up of 33.2 months (IQR 13.1–62.6), 3775 (38%) patients (52.3% dcSSc, n = 1308/2498; 33% lcSSc, n = 2240/6697; P < 0.0001) had received steroids at least once, with a median dose of 5 mg/day. Twenty-one percent of patients who had received GCs experienced at least one episode of arthritis during the follow-up, 12% at least one episode of myositis and/or increased creatine kinase values, and 30% either arthritis or myositis and/or increased creatine kinase values.
The median time spent on GCs was 6 months (IQR 6–9, range 1–96). On average, patients spent 25% (IQR 12–58) of their follow-up time on GCs. For patients who were followed-up for >1 year (n = 2959), 971 (33%) and 647 (22%) had received GCs for >6 months and >12 months, respectively (Fig. 1). Exposure to GCs was significantly longer for males than females [median 28% (IQR 13–71) vs 25% (IQR 12–53), P < 0.01], but comparable between lcSSc and dcSSc subsets. Accordingly, the number of patients on GCs for more than one-third [503/1308 (38%) dcSSc vs 862/2240 (38%) lcSSc; P = 0.987] or more than half [365/1308 (28%) dcSSc vs 577/2240 (26%) lcSSc; P = 0.162] of the follow-up time was also comparable between the subsets. The analysis of patients who had a shorter period since diagnosis of SSc (time from the first non-RP symptom onset of <3 years) led to similar results, both in terms of proportion of follow-up time spent on GCs [median 27% (IQR 14–49)] and in the rate of SSc patients receiving GCs for more than one-third [132/336 (39%) dcSSc vs 147/418 (35%) lcSSc; P = 0.24] or more than half [94/336 (28%) dcSSc vs 114/418 (27%) lcSSc; P = 0.83] of the follow-up time.
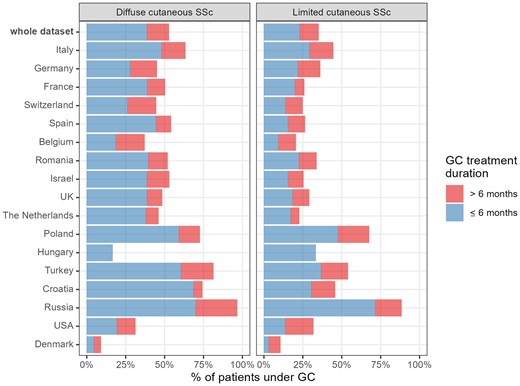
Proportions of patients followed up for >1 year who had been treated with glucocorticoids (GCs). Proportions of patients followed up for >1 year who had been treated with GCs for ≤6 months (blue bars) or >6 months (red bars). Data are shown for the whole dataset and by countries, for dcSSc (left panel) and lcSSc (right panel) patients
The longitudinal analysis of GCs prescribing showed that they were used in combination with an immunosuppressive drug in 2462/4356 (57%) of the visits, mainly with MTX (24%), MMF (18%), CYC (16%), AZA (14%) and rituximab (6%).
Multivariable linear regression showed that the proportion of time spent on GCs was positively associated with age, male sex, worsening of cardiopulmonary manifestations, synovitis, tendon friction rubs, pericardial effusion, lower FVC or DLCO, lung fibrosis on high-resolution CT, and increased creatine kinase or CRP, and negatively associated with lcSSc and mRSS (adjusted R2 = 0.06, P > 0.0001). The results of linear regression for the whole sample, and for the subgroup of patients in the early stages of the disease are shown in Table 2.
Association of demographic and disease-related factors with the proportion time spent on glucocorticoids
| Whole series N = 8109 | Early SSc patients N = 1896 | |||
|---|---|---|---|---|
| Coef (95% CI) | P value | Coef (95% CI) | P value | |
| Demographics | ||||
| Age, years | 0.05 (0.01, 009) | <0.001 | 0.05 (–0.01, 0.13) | 0.13 |
| Male sex | 2.3 (0.7, 3.9) | 0.003 | 1.5 (–1.1, 4.1) | 0.24 |
| Characteristics of disease | ||||
| Time from first non-RP symptom, years | –0.02 (–0.09, 0.05) | 0.55 | – | – |
| lcSSc | –3.9 (–6.1, –1.6) | <0.001 | –3.5 (–7.0, –0.06) | 0.006 |
| Current digital ulcers | –0.2 (–2.8, 2.3) | 0.77 | 0.6 (–3.0, 4.3) | 0.71 |
| Puffy fingers | –0.031 (–1.8, 1.2) | 0.58 | 1.3 (–1.0, 3.5) | 0.22 |
| mRSS | –0.09 (–0.3, 0.1) | <0.001 | –0.07 (–0.3, 0.2) | 0.17 |
| Worsening of skin | 1.6 (–1.5, 4.7) | 0.07 | 1.8 (–1.4, 5.1) | 0.21 |
| Worsening of cardiopulmonary manifestation | 5.6 (2.0, 9.3) | <0.001 | 8.5 (4.2, 12.8) | <0.001 |
| Worsening of vascular manifestations | 0.5 (–1.8, 2.9) | 0.42 | –1.3 (–4.2, 1.6) | 0.29 |
| Joint synovitis | 8.5 (6.4, 10.5) | <0.001 | 6.5 (3.3, 9.7) | <0.001 |
| Tendon friction rubs | 4.4 (1.4, 7.4) | <0.001 | 2.7 (–1.7, 7.0) | 0.21 |
| Pericardial effusion | 2.3 (–0.9, 5.4) | 0.03 | 3.4 (–2.1, 8.8) | 0.11 |
| Anti-Scl70 positive | 1.1 (–0.6, 2.7) | 0.11 | 0.20 (–0.2, 4.8) | 0.62 |
| FVC, % of predicted value | –0.01 (–0.1, –0.02) | <0.001 | –0.01 (–0.08, 0.05) | 0.57 |
| DLCO, % of predicted value | –0.04 (–0.1, 0.01) | <0.001 | –0.05 (–0.12, 0.02) | 0.04 |
| Fibrosis at lung HRCT | 4.4 (2.3, 7.0) | <0.001 | 5.2 (2.2,8.2) | <0.001 |
| Laboratory | ||||
| Creatine kinase elevation | 4.0 (0.9, 7.0) | <0.001 | 3.6 (–0.4, 7.6) | 0.03 |
| CRP elevation | 5.0 (3.0, 7.0) | <0.001 | 5.1 (2.2, 8.0) | <0.001 |
mRSS: modified Rodnan skin score; FVC: forced vital capacity; DLCO: diffusing lung capacity for carbon monoxide; HRCT: high-resolution CT.
Temporal trends of glucocorticoids use
The annual proportion of GCs users gradually decreased between 2013 and 2018 in the overall sample of patients (36% in 2013 vs 23% in 2018), both in those with lcSSc (23% in 2013 to 14% in 2018) and in those with dcSSc (36% in 2013 to 23% in 2018). To adjust for disease severity, the same analysis performed in patients in the early stages of the disease confirmed the observed trend, with the rate of patients with dcSSc who were GCs users falling from ∼60% in 2013 to <40% in 2018. Fig. 2 shows the temporal trend of GCs use in the whole sample and in SSc patients in the early stages of the disease.
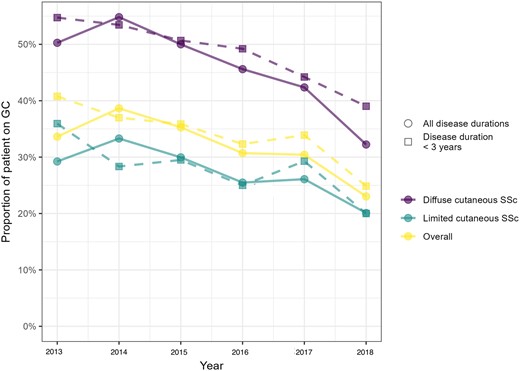
Yearly prevalence of glucocorticoids (GCs) users. Yearly prevalence of GCs users in the whole sample of patients (circles and solid lines), or in patients with a disease duration of <3 years (squares and dashed lines), according to disease subset
Prescribing practices according to countries
The baseline proportion of GCs users (in the whole sample and for each SSc subset) across the main recruiting countries was highly heterogeneous, with the highest figures recorded in Russia, Turkey and Poland, and the lowest in Denmark and Belgium (Fig. 1). In most countries, GCs have been prescribed in >50% of dcSSc patients (Fig. 1).
The median proportion of time spent on GCs also greatly varied across countries (Fig. 3). We found a strong correlation between the median proportion of time spent on GCs and the median proportion of time spent on immunosuppressants per country among patients treated with GCs [rho 0.71 (95% CI 0.30, 0.90), P = 0.001] (Supplementary Fig. S1, available at Rheumatology online). The wide range of time spent on GCs within each country mirrors the high variability in prescribing patterns across countries.
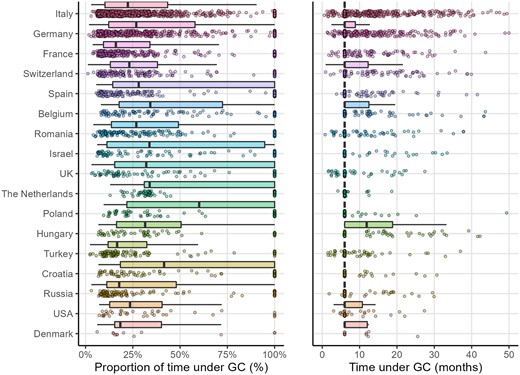
Proportion of time under glucocorticoids, and time under glucocorticoids for glucocorticoids users, in the main recruiting countries
GC, glucocorticoids
Discussion
We showed that GCs were commonly prescribed in SSc, mainly to patients with a more severe condition or presenting signs or symptoms of active inflammatory disease. One-third of glucocorticoid-treated patients had an active musculoskeletal inflammatory condition over their disease course. Although relatively more dcSSc patients received GCs, the duration of treatment (on average a quarter of follow-up time) was similar in the two subsets. We observed a huge heterogeneity in GCs prescription across and within countries, and the mean time spent on these agents was poorly explained by a patient’s characteristics. Interestingly, these drugs are being gradually less prescribed. Doses higher than 15 mg/day were rarely given, and then mainly to patients with high disease activity and worsening lung and/or skin disease.
Our cross-sectional analysis revealed that, at study entry, about one-third of lcSSc and half of dcSSc patients were current GCs users, with similar figures in both the whole sample and in the subgroups of incident patients. This finding, consistent with the results of a meta-analysis from national and international SSc registries and cohorts [10], confirms the frequent use of these drugs in SSc, irrespective of disease duration (our main analysis focused on patients with a median disease duration of ∼8 years), and in spite of the absence of evidence about their efficacy [1, 13, 15]. In daily practice, by analogy with other inflammatory autoimmune diseases, GCs are prescribed in SSc to obtain relief from symptoms or to treat overt active inflammatory manifestations [1]. They are also delivered in combination with immunosuppressive drugs for interstitial lung disease or diffuse skin fibrosis [1, 13, 15], even though their utility is not proven. The results of two randomized controlled trials investigating the efficacy of GCs in early diffuse disease [16, 17] will hopefully better drive their use in this subgroup of patients in the coming years. For interstitial lung disease, GCs at a dose of ≤10 mg per day are generally among the permitted concomitant medications in randomized controlled trials, but no study has specifically demonstrated any benefit from these agents for this indication. A recent European consensus statement recommended against GCs monotherapy for the treatment of interstitial lung disease [18].
Even at low doses, long-term GCs use is associated with increased risk of infection, osteoporosis, cataract, and cardiovascular events [19, 20], and tapering GCs as rapidly as clinically feasible is recommended in most systemic autoimmune diseases. Nevertheless, a glucocorticoid-free status was not reached in our sample for a considerable proportion of SSc patients. Indeed, we observed that nearly 1 in 3 treated patients followed for at least 1 year continued to receive ≥5 mg/day of GCs for >6 months, and about 1 in 4 for >1 year. The reasons accounting for long-term GCs exposure in SSc are various and not easy to determine. Physicians’ beliefs about the utility of long-term exposure to GCs [21], failure to achieve discontinuation [22, 23], or poor knowledge about the detrimental effects of long-term low-dose GCs use [24] could at least in part explain such an observation.
Glucocorticoids prescription hugely varied across and within countries in our study, and the variability in GCs exposure was poorly explained by other information about the patients. The strong correlation found between the extent of GCs use and that of use of immunosuppressive drugs weakens the hypothesis that the larger use of GCs in some countries could be justified by the unavailability of drugs with steroid-sparing effect. Conversely, it could reflect regional differences in management practices (i.e. physicians being more prone to prescribe GCs and immunosuppressive drugs in some countries). A comprehensive analysis of the relationship between the prescription of GCs, immunosuppressive agents, and disease severity, would help to better understand differences in SSc management. This deserves a dedicated study and is beyond the aim of this paper. The high variability in GCs prescribing practices also occurs within countries, suggesting that lack of agreement among physicians [25] might be the main driver of the variability. Even if we cannot demonstrate this aspect by the analysis of our data, various studies have clearly shown that there is no consensus on how, to whom, and for how long GCs should be prescribed in SSc [12, 25–27]. In the European Scleroderma Observational Study (ESOS), approximately half of early dcSSc patients received or had received GCs [12]. Discrepancy in GCs use was highlighted in a survey conducted among experts from the Scleroderma Clinical Trials Consortium and from the Canadian Scleroderma Research [25]. The observation that patient characteristics explained only about 6% of the variability of GCs exposure in our multivariable model further supports this hypothesis. That said, we should acknowledge that, in spite of a huge variability in prescribing practices, we found high consistency about the doses used, given that only a very small proportion of patients with a very active and severe disease had received >15 mg per day of prednisone equivalent. We stress that the risk of scleroderma renal crisis should always be kept in mind when prescribing prednisone equivalent higher than 15 mg per day to SSc patients.
Interestingly, GCs were less prescribed over time. This seems to be unrelated to the inclusion of patients with a milder disease in these latter years, since the same trend was also shown for those with a severe disease (early dcSSc). The reasons for this finding could include better knowledge about the lack of evidence demonstrating the utility of these agents for preventing lung or skin fibrosis worsening [1, 2, 15, 28]. We can also hypothesize that growing awareness about the harms related to GCs chronic use could represent a contributing factor. In fact, more attention has been paid over the last few years to the side effects associated with long-term GCs exposure, even if used at low dosages [29–36], and steroid-free strategies are increasingly being tested for systemic autoimmune diseases [37–39].
This study has some limitations. Due to the lack of available information, we were not able to explore the main indications for GCs prescription or discontinuation. This could have enabled us to better understand whether long-term use is driven more by the need to control symptoms, by physicians’ beliefs about their potential effectiveness for slowing down fibrosis accumulation, or by other factors. Moreover, we could not appraise the potential SSc-(un)related consequences of long-term intake of GCs, since many of these complications need to be investigated over a longer time span. Information bias is an issue, for two reasons. First, misclassification of GCs use was possible, since some patients could have filled a prescription only for short-term use in case of flares, or may have received these compounds for other reasons. Second, time on GCs was extrapolated between visits, and after the last visit (by adding 6 months). However, this measurement error should not lead to systematic bias, because it is not likely associated with clinical characteristics. Finally, our data mirrors the practice observed in the EUSTAR centres, which might not be representative of the whole picture of GCs management in a given country.
The strengths of this study are the availability of a large sample of patients, coming from different continents, and reflecting the daily clinical practices across the centres contributing to the EUSTAR database. Furthermore, we have for the first time prospectively explored the burden of GCs intake over time in SSc, a topic that is (and has been) neglected for this disease so far.
In conclusion, low-dose oral GCs are widely and long-term prescribed to SSc patients, mainly to those in the dcSSc subset. GCs prescription is very heterogeneous across centres and countries, and has steadily declined over recent years. Even though relatively few patients receive >15 mg per day of prednisone, the risk of scleroderma renal crisis should always be considered for patients receiving this dosage. The areas of high variability in practice we have identified underscore the need for a better evidence base for GCs prescription and might also be instrumental in suggesting potential targets for quality improvement.
Supplementary data
Supplementary data are available at Rheumatology online.
Data availability statement
The data that support the findings of this study are available upon reasonable request.
Funding
No specific funding was received from any bodies in the public, commercial or not-for-profit sectors to carry out the work described in this article.
Disclosure statement: M.I.: speaking fee from Boehringer Ingelheim; D.M.:none declared; E.S.: none declared; P.E.C.: none declared; J.D.: none declared; J.H.: speaking fees from Roche/Chugai, Janssen, Neovii and Boehringer-Ingelheim; E.Z.: none declared; E.H.: speaking fees from Johnson & Johnson, GSK, and Roche-Chugai; research funding from CSL Behring, GSK, Roche-Chugai and Johnson & Johnson; and consulting fees/meeting fees from Johnson & Johnson, Boehringer Ingelheim, Bayer, GSK, Roche-Chugai, and Sanofi-Genzyme; G.D.L.: none declared; C.d.S.M.: speaking fees for Janssen and Boehringer-Ingelheim; T.S.: none declared; J.-L.T.: none declared; B.V.B.: none declared; M.D.S.: none declared; A.-M.H.-V.: research funding, consulting fees, or other remuneration from Actelion, Boehringer Ingelheim, Roche, Bayer, Merck Sharp & Dohme, ARXX therapeutics, Lilly, and Medscape; A.G.: none declared; O.D.: has/had a consultancy relationship with and/or has received research funding from or has served as a speaker for the following companies in the area of potential treatments for SSc and its complications in the last 3 years: Abbvie, Acceleron, Amgen, AnaMar, Arxx, Baecon, Blade, Bayer, Boehringer Ingelheim, ChemomAb, Corbus, CSL Behring, Galapagos NV, Glenmark, GSK, Horizon (Curzion), Inventiva, iQvia, Italfarmaco, Kymera, Medac, Medscape, Mitsubishi Tanabe, MSD, Novartis, Pfizer, Roche, Roivant, Sanofi, Serodapharm, Topadur, Target Bioscience and UCB. Patent issued ‘mir-29 for the treatment of systemic sclerosis’ (US8247389, EP2331143). D.S.C.: none declared.
Acknowledgements
EUSTAR collaborators: Giovanna Cuomo (Naples, Italy), Gianluca Moroncini (Ancona, Italy), Jiri Stork (Prague, Czech Republic), Fiorenzo Iannone (Bari, Italy), Ulrich Walker (Basel, Switzerland), Eugenia Bertoldo (Verona, Italy), Dorota Krasowska (Lublin, Poland), Maria João Salvador (Coimbra, Portugal), Mohammed Tikly (Johannesburg, South Africa), Valeria Riccieri (Rome, Italy), Ami Sha (Baltimore, MD, USA), Ana Maria Gheorghiu (Bucharest, Romania), Cord Sunderkötter (Münster, Germany), Francesca Ingegnoli (Milan, Italy), Luc Mouthon (Paris, France), Vanessa Smith (Gent, Belgium), Francesco Paolo Cantatore (Foggia, Italy), Kilian Eyerich (Munich, Germany), Piotr Wiland (Wroclaw, Poland), Marie Vanthuyne (Brussels, Belgium), Branimir Anic (Zagreb, Croatia), Maria Üprus (Tallin, Estonia), Brigitte Granel (Marseille, France), Alessandra Vacca (Monserrato, Italy), Cristina-Mihaela Tanaseanu (Bucharest, Romania), Paloma García de la Peña Lefebvre (Madrid, Spain), Jean Sibilia (Strasbourg, France), Ira Litinsky (Tel Aviv, Israel), Lesley Ann Saketkoo (New Orleans, LA, USA), Eduardo Kerzberg (Buenos Aires, Argentina), Massimiliano Limonta (Bergamo, Italy), Doron Rimar (Haifa, Israel), Petros Sfikakis (Athens, Greece), Maurizio Cutolo (Genova, Italy), Rosario Foti (Catania, Italy), Srdan Novak (Rijeka, Croatia), Mislav Radic (Split, Croatia), Raffaele Pellerito (Torino, Italy), Carlo Francesco Selmi Rozzano (Milan, Italy), Lidia P. Ananieva (Moscow, Russia), Gabriela Szűcs (Debrecen, Hungary), Carlos de la Puente (Madrid, Spain), Ruxandra Maria Ionescu (Bucharest, Romania), Maria Rosa Pozzi (Monza, Italy), Juan Jose Alegre-Sancho (Valencia, Spain), Kristine Herrmann (Dresden, Germany), Ellen De Langhe (Leuven, Belgium), Sule Yavuz Altunizade (Istanbul, Turkey), Svetlana Agachi (Chisinau, Republic of Moldova), Douglas Veale (Dublin, Ireland), Esthela Loyo (Santiago, Dominican Republic), Mengtao Li (Beijing, China), Edoardo Rosato (Rome, Italy), Britta Maurer (Bern, Switzerland), Iván Castellví (Barcelona, Spain), François Spertini (Lausanne, Switzerland), Kamal Solanki (Hamilton, New Zealand), Nicoletta Del Papa (Milan, Italy), Gerard Espinosa (Barcelona, Spain), László Czirják (Pecs, Hungary), Bernard Coleiro (Balzan, Malta), Dominique Farge Bancel (Paris, France), Raffaele Pellerito (Torino, Italy), Christopher Denton (London, UK), Nemanja Damjanov (Belgrade, Serbia and Montenegro), Vera Ortiz Santamaria Granollers (Barcelona, Spain), Michaela Kohm (Frankfurt am Main, Germany), Bojana Stamenkovic (Niska Banja, Serbia and Montenegro), Yannick Allanore (Paris, France), Paolo Airo’ (Brescia, Italy), Alexandra Balbir-Gurman (Haifa, Israel), Marco Matucci Cerinic (Firenze, Italy), Gabriela Riemekasten (Lübeck, Germany), Stefan Heitmann (Stuttgart, Germany), Nicolas Hunzelmann (Köln, Germany), Carlomaurizio Montecucco (Pavia, Italy), Jadranka Morovic-Vergles (Zagreb, Croatia), Camillo Ribi (Lausanne, Switzerland). This work was presented in form of abstract at the EULAR Congress 2022, in Copenhagen (POS0874). All the authors were involved in drafting the article or revising it critically for important intellectual content, and all authors approved the final version to be published. M.I. had full access to all of the data in the study and takes responsibility for the integrity of the data and the accuracy of the data analysis. M.I. and D.S.C. were responsible for the study conception and design. M.I., E.S., P.E.C., J.D., J.H., E.Z., E.H., G.D.L. C.d.S.M., T.S., J.-L.T., B.V.B., M.D.S., A.-M.H.-V., A.G., O.D. and D.S.C. were responsible for the acquisition of data. M.I., D.M., E.S., P.E.C., J.D., J.H., E.Z., E.H., G.D.L., C.d.S.M., T.S., J.-L.T., B.V.B., M.D.S., A.-M.H.-V., A.G., O.D. and D.S.C.were responsible for the analysis and interpretation of data.
References
Author notes
See acknowledgements section for a list of the EUSTAR collaborators.

Comments