


Abstract
To characterize patients with positive anti-topoisomerase I (ATA) in lcSSc.
SSc patients enrolled in the EUSTAR cohort with a disease duration of ≤3 years at database entry were considered. We assessed the risk of major organ involvement in the following groups: ATA-lcSSc vs ACA-lcSSc and vs ANA without specificity (ANA)-lcSSc, and ATA-lcSSc vs ATA-dcSSc. Cox regression models with time-dependent covariates were performed with the following outcomes: new-onset interstitial lung disease (ILD), ILD progression [forced vital capacity (FVC) decline ≥10% and ≥5% vs values at ILD diagnosis), primary myocardial involvement (PMI), pulmonary hypertension (PH), any organ involvement and all-cause mortality.
We included 1252 patients [194 ATA-lcSSc (15.5%)], with 7.7 years (s.d. 3.5) of follow-up. ILD risk was higher in ATA-lcSSc vs ACA- and ANA-lcSSc and similar to ATA-dcSSc, although with less frequent restrictive lung disease. The risk of FVC decline ≥10% (35% of ATA-lcSSc) was lower in ATA-lcSSc than in ATA-dcSSc, whereas FVC decline ≥5% occurs similarly between ATA-lcSSc (58% of patients) and other SSc subsets, including ATA-dcSSc. The risk of PMI was similar in ATA-lcSSc and ANA-lcSSc but lower than in ACA-lcSSc; no difference in PH and mortality risk was observed among lcSSc subsets. The risk of any organ involvement, PMI and PH was lower and the mortality tended to be lower in ATA-lcSSc vs ATA-dcSSc.
ATA-lcSSc patients have a high risk of ILD, albeit with a lower risk of progression compared with ATA-dcSSc, supporting careful screening for ILD in this subgroup.
ATA-lcSSc patients have a high risk of ILD, both at baseline and during follow-up.
ATA-lcSSc patients constitute a frequent SSc subset in which careful screening for ILD is recommended.
ILD progression is less frequent in ATA-lcSSc than ATA-dcSSc with an FVC decline ≥10%.
Introduction
SSc is a connective tissue disease characterized by an extremely wide heterogeneity, ranging from mild and stable to life-threatening forms [1, 2]. Besides the European Scleroderma Trial and Research (EUSTAR) activity score [3], reliable markers of disease activity and robust predictive factors are lacking in SSc. Therefore, improving risk stratification is of the utmost importance [4]. Patients affected with SSc are classified into limited (lcSSc) and diffuse (dcSSc) cutaneous forms [5]. However, recent evidence suggests that this classification may fail to fully capture the heterogeneity of the scleroderma spectrum [6]. Notably, there is renewed interest in the potential role of SSc-specific autoantibodies in predicting organ involvement [7] thanks to their high reproducibility and worldwide availability. Typically lcSSc patients have positive anticentromere (ACA), whereas those with dcSSc have positive anti-topoisomerase I (ATA). However, by exploring the ‘many faces of scleroderma’ back in 1988, Steen etal. [8] highlighted a consistent population of SSc patients with positive ATA but stable lcSSc, hypothesizing that it may be an ‘aborted form of dcSSc’ [9]. Although some cohort studies have more recently reported that this population may represent 11–23% of the lcSSc forms [10–12], very few have investigated the clinical spectrum of ATA-lcSSc patients, thus their disease presentation and course remain largely unknown [13, 14].
Interstitial lung disease (ILD) is the leading cause of death in SSc to date [15, 16]. The disease course in SSc-ILD is extremely variable, ranging from mild asymptomatic to rapidly progressive [17]. Interestingly, there have recently been some major achievements in recent randomized controlled trials (RCTs) leading to the labelling of two drugs for SSc-ILD: nintedanib and tocilizumab [18–21]. It must be pointed out that in the SENSCIS trial (NCT02597933), not only patients with dcSSc were enrolled, but also patients with lcSSc, with similar efficacy of nintedanib irrespective of the cutaneous subset, highlighting that some lcSSc may have significant ILD [22]. Risk stratification for SSc-ILD development and progression is a milestone towards early diagnosis and tailored treatments to improve outcome [23–25]. Our aim was to investigate the clinical features and risks of major organ involvement, including ILD, in patients with lcSSc and positive ATA in a large international multicentre cohort.
Methods
The study was conducted on prospectively collected data in the large multicentre EUSTAR database through July 2019. The structure of the online database, the collected data set and the definitions of clinical variables have been previously reported [26, 27]. Inclusion criteria were patients fulfilling the ACR 1980 and/or ACR/EULAR 2013 classification criteria for SSc [28], disease duration (from the first non-Raynaud’s sign/symptom) ≤3 years at database entry and known and stable cutaneous form during the first 3 years (i.e. lcSSc → lcSSc). In order to avoid the potential misclassification of some dcSSc patients as lcSSc in a very early stage of SSc, only patients with an available follow-up ≥3 years after database entry were included. Exclusion criteria were patients presenting multiple autoantibody reactivities and patients with unknown or positive anti-RNA polymerase III and anti-ENA antibodies other than ACA and ATA (i.e. anti-U1RNP and anti-PM/Scl). This was to avoid the inclusion of patients with multiple autoantibody positivity and those not tested for less-frequent but relevant SSc-associated antibodies (e.g. anti-RNA polymerase III).
Demographic and clinical data were recorded at baseline (i.e. database entry). Multivariable Cox regression models with time-dependent covariates were performed to assess the risk of developing the following outcomes during follow-up:
ILD: evidence of lung fibrosis on standard X-ray and/or high-resolution CT (HRCT)
Scleroderma renal crisis (SRC): according to the EUSTAR definition [29]
Primary myocardial involvement (PMI): ventricular arrhythmia or conduction defects by electrocardiogram or systolic dysfunction (i.e. ejection fraction <52% for males, <54% for females) [30] or diastolic dysfunction or significant pericardial effusion (>10 mm and diffuse) by transthoracic echocardiography (TTE)
Pulmonary hypertension (PH): systolic pulmonary arterial pressure (PAP) >45 mmHg by TTE and/or a mean PAP ≥25 mmHg on right heart catheterization (RHC)
Any major organ involvement: ILD and/or PMI and/or PH and/or SRC
Mortality: death from all-cause mortality.
Outside of Cox regression models, gastrointestinal (GI) involvement was defined as gastroesophageal reflux disease or stomach symptoms or malabsorption or intestinal symptoms or paralytic ileus.
As secondary endpoints, two adjunctive models were performed to assess the risk of ILD progression, defined by two different cut-offs of Forced vital capacity (FVC) decline:
ILD progression (FVC ≥10%): FVC decline ≥10% from ILD onset (defined as the first imaging evidence of ILD) to the last follow-up.
ILD progression (FVC ≥5 %): FVC decline ≥5% from ILD onset (defined as the first imaging evidence of ILD) to the last follow-up.
Restrictive lung disease was defined as FVC <80% of predicted value [31].
For each model, if FVC at ILD onset was not available, the closer FVC measure to ILD onset (within 1 year) was considered as the baseline FVC. The period of observation after ILD onset (i.e. ILD follow-up) was calculated from the baseline FVC to the first occurrence of progression or to the last available follow-up in patients without progression. Each Cox regression model was adjusted for age, sex and confounders.
Our SSc population was subdivided into four subsets: ATA-lcSSc, ACA-lcSSc, lcSSc with ANA positive but without anti-ENA specificity (ANA-lcSSc) and ATA-dcSSc. For baseline comparisons and Cox regression models, the analysis was performed in two groups of patients:
Group 1: lcSSc, by comparing patients with ATA-lcSSc vs ACA-lcSSc and vs ANA-lcSSc
Group 2: ATA-positive SSc, by comparing ATA-lcSSc vs ATA-dcSSc patients.
Ethics
Approval of the local ethics committee was obtained by each participating EUSTAR centre and informed consent was given by each registered patient.
Statistical analysis
For continuous variables, mean (s.d.) or median and interquartile range (IQR) are shown; counts and percentages are used for categorical variables. Group comparisons of baseline variables were performed using the Mann–Whitney test for continuous variables or the χ2 test for categorical variables. For groupwise comparisons of ACA-lcSSc and ANA-lcSSc vs ATA-lcSSc, P-values were adjusted for two parallel tests. Crude group comparisons of time until respective events of interest were conducted using Kaplan–Meier analysis. For multivariable time-to-event analysis, missing values were imputed 10 times with predictive mean matching and fixed random seed (packages mice and mitools); only cases with any available follow-up information were analysed. Multivariable Cox regression models allowing for time-dependent variables were used to investigate the influence of sets of variables, preselected according to medical considerations [32], on the events of interest. The starting point was the baseline visit for models assessing the risk of organ involvement and death and the first evidence of ILD for models evaluating ILD progression. The risk of event was expressed as the hazard ratio (HR) and its 95% confidence interval (CI). SPSS Statistics version 24 (IBM, Armonk, NY, USA) and R version 4.0.3 (R Foundation for Statistical Computing, Vienna, Austria) were used for analysis.
Results
Study population
Among the 16 831 total adult SSc patients, 4817 had a disease duration at database entry of ≤3 years; among them, 1949 were followed up for at least 3 years. In the latter group of patients, 133 (6.8%) transitioned from lcSSc to dcSSc (according to LeRoy et al. [5]) and were therefore excluded. Notably, the proportion of lcSSc patients treated with immunosuppressants was higher in those who transitioned to dcSSc (49.6%) compared with lcSSc who did not (32.3%) (P = 0.0003). After applying the other exclusion criteria (Supplementary Fig. S1, available at Rheumatology online), 1252 patients [1042 (83.2% female)] were enrolled; 95.5% of patients were Caucasian, 827 (66.1%) had lcSSc and 425 (33.9%) had dcSSc, the median age was 52 years (IQR 41.4–61.8) and disease duration at database entry was 1.3 years (IQR 0.7–2.2). Among patients with lcSSc, 194 (23.5%) had positive ATA, 537 (64.9%) had positive ACA and 96 (11.6%) had positive ANA without anti-ENA specificity. Among patients with positive ATA (n = 619), 194 (31.3%) had lcSSc and 425 (68.7%) had dcSSc (Tables 1 and 2).
Demographic and clinical characteristics of patients with the limited cutaneous form at baseline
| Characteristics | Patients with data available, n | Total lcSSc (N = 827) | ACA-lcSSc (n = 537) | P-value | ATA-lcSSc (n = 194) | P-value | ANA-lcSSc (n = 96) |
|---|---|---|---|---|---|---|---|
| Female, n (%) | 827 | 740 (89.5) | 498 (92.7) | <0.0001 | 161 (83) | 0.766 | 81 (84.4) |
| Age at RP onset, years | 820 | 45.6 (15.2) | 46.9 (15.3) | 0.284 | 44.2 (15.2) | 0.423 | 46.3 (14.5) |
| Time from RP to SSc, years, median (IQR) | 820 | 1.9 (0.1–7.9) | 2.5 (0.3–9.9) | <0.0001 | 0.7 (0–3) | 0.978 | 0.8 (0–4) |
| Age at SSc onset, years | 827 | 51.4 (13.7) | 53 (13.3) | <0.0001 | 46.9 (14.2) | 0.043 | 51.1 (13.3) |
| Age, years | 827 | 52.8 (13.7) | 54.4 (13.3) | <0.0001 | 48.4 (14.3) | 0.05 | 52.4 (13.3) |
| Disease duration, years | 827 | 1.4 (0.9) | 1.4 (0.9) | 1.000 | 1.4 (0.9) | 1.000 | 1.4 (0.8) |
| BMI | 455 | 25.4 (4.9) | 25.6 (5.1) | 1.000 | 25.5 (4.7) | 1.000 | 25.1 (4.4) |
| ESR >20 mm/ha, n (%) | 396 | 113 (28.5) | 65 (26) | 0.08 | 36 (35.3) | 0.344 | 12 (27.3) |
| CRP elevation, n (%) | 381 | 58 (13.2) | 25 (8.8) | <0.0001 | 25 (23.6) | 0.665 | 8 (16.7) |
| Hba, g/dl | 64 | 13.2 (1.3) | 13.2 (1.3) | 1.000 | 13.3 (1.3) | 0.928 | 13.7 (1.0) |
| mRSS | 752 | 4.8 (4.2) | 4.3 (4) | 0.001 | 5.8 (4.8) | 1.000 | 5.1 (3.9) |
| Puffy fingers (ever), n (%) | 451 | 207 (45.9) | 123 (42.4) | 0.025 | 62 (56.4) | 0.236 | 22 (43.1) |
| DUs ever, n (%) | 820 | 219 (26.7) | 141 (26.5) | 0.893 | 59 (30.7) | 1.000 | 19 (20.0) |
| DUs current, n (%) | 820 | 200 (24.4) | 130 (24.4) | 0.759 | 53 (27.6) | 0.315 | 17 (17.9) |
| Telangiectasiaa, n (%) | 138 | 67 (48.6) | 49 (55.1) | 0.030 | 10 (30.3) | 0.360 | 8 (50) |
| Joint synovitis, n (%) | 821 | 97 (11.8) | 46 (8.6) | 0.002 | 33 (17.2) | 1.000 | 18 (18.8) |
| TFRs, n (%) | 819 | 25 (3.1) | 9 (1.7) | 0.008 | 11 (5.7) | 1.000 | 6 (6.3) |
| Muscle weakness, n (%) | 821 | 110 (13.4) | 52 (9.8) | <0.0001 | 41 (21.1) | 0.985 | 17 (17.7) |
| CK elevation, n (%) | 783 | 55 (7.0) | 18 (3.6) | <0.0001 | 25 (13.3) | 1.000 | 12 (13.3) |
| GI involvement, n (%) | 826 | 492 (59.6) | 338 (63.1) | 0.015 | 101 (52.1) | 1.000 | 53 (55.2) |
| GERD, n (%) | 824 | 463 (56.2) | 323 (60.5) | 0.005 | 93 (47.9) | 1.000 | 47 (49.0) |
| Stomach symptoms, n (%) | 822 | 123 (15) | 74 (13.9) | 0.922 | 31 (16.1) | 1.000 | 18 (18.8) |
| Intestinal symptoms, n (%) | 824 | 145 (17.6) | 94 (17.6) | 1.000 | 33 (17) | 1.000 | 18 (18.8) |
| SRC, n (%) | 823 | 7 (0.9) | 2 (0.4) | 0.581 | 2 (1) | 0.395 | 3 (3.1) |
| Serum creatininea, mg/dl, median (IQR) | 65 | 0.7 (0.7–0.9) | 0.8 (0.7–0.9) | 1.000 | 0.7 (0.7–0.8) | 0.054 | 0.65 (0.55–0.7) |
| Proteinuria, n (%) | 781 | 22 (2.8) | 8 (1.6) | 0.011 | 10 (5.4) | 1.000 | 4 (4.4) |
| ILD, n (%) | 784 | 163 (20.8) | 52 (10.3) | <0.0001 | 87 (46.3) | 0.004 | 24 (27.0) |
| Restrictive LD, n (%) | 783 | 97 (12.4) | 43 (8.4) | <0.0001 | 39 (21.4) | 0.628 | 15 (16.3) |
| FVC, % predicted, median (IQR) | 417 | 103 (91–115) | 106 (95–118) | <0.0001 | 95 (84.5–106) | 0.357 | 101 (85–114) |
| TLCa, % predicted, median (IQR) | 287 | 99 (88–110) | 100 (90–111) | 0.012 | 93 (81–107) | 0.799 | 97 (82–110) |
| DLCO, % predicted, median (IQR) | 656 | 77 (64–89) | 78 (66–90) | 0.006 | 72 (59–86) | 1.000 | 71 (58–90) |
| FEV1a, % predicted, median (IQR) | 289 | 99 (86–109) | 100 (90–112) | 0.006 | 94 (83–103) | 0.565 | 98.5 (87–105) |
| PHa, n (%) | 321 | 14 (4.4) | 11 (5.1) | 0.350 | 1 (1.4) | 0.439 | 2 (5.6) |
| sPAPa, mmHg | 311 | 28.4 (10.7) | 28.5 (11.2) | 1.000 | 27.7 (6.7) | 1.000 | 29.3 (13.2) |
| PMI, n (%) | 827 | 154 (18.1) | 100 (18.6) | 1.000 | 36 (18.6) | 1.000 | 18 (18.8) |
| PMI (<45%), n (%) | 812 | 147 (17.9) | 95(18.1) | 1.000 | 34(17.8) | 1.000 | 18 (18.8) |
| Ejection fractiona, % | 391 | 62.7 (5.8) | 62.7 (5.7) | 1.000 | 62.5 (6.7) | 1.000 | 63.5 (4.5) |
| Cardiac blocks, n (%) | 769 | 52 (6.8) | 26 (5.2) | 0.104 | 17 (9.3) | 1.000 | 9 (10.3) |
| Diastolic dysfunction, n (%) | 773 | 109 (14.1) | 77 (15.4) | 0.632 | 22 (12.3) | 1.000 | 10 (10.8) |
| Pericardial effusiona, n (%) | 398 | 15 (3.8) | 9 (3.5) | 1.000 | 4 (4.1) | 0.483 | 4 (8.7) |
| Any severe, n (%) | 827 | 293 (35.4) | 149 (27.7) | <0.0001 | 104 (53.6) | 0.111 | 40 (41.7) |
| EScSG activity index 2001, median (IQR) | 827 | 0.5 (0–1) | 0.5 (0–0.5) | <0.0001 | 0.5 (0–1.5) | 0.126 | 0.5 (0–1) |
| EScSG activity index 2016a, median (IQR) | 64 | 2.7 (1.3–3.7) | 2.4 (0.7–3.4) | 0.263 | 3.5 (1.5–5) | 0.260 | 2.4 (1.8–2.6) |
| EScSG 2001 active, n (%) | 796 | 31 (3.7) | 13 (2.4) | 0.002 | 16 (8.2) | 0.214 | 2 (2.1) |
| EScSG 2016 activea, n (%) | 64 | 35 (54.7) | 18 (48.6) | 0.180 | 14 (73.7) | 0.189 | 3 (37.5) |
| Corticosteroids, n (%) | 827 | 174 (21) | 73 (13.6) | <0.0001 | 63 (32.5) | 0.464 | 38 (39.6) |
| Prednisone equivalent, mg/day, median (IQR) | 827 | 5 (3.5–5) | 5 (2.5–5) | 0.133 | 5 (4–6) | 0.567 | 5 (3.4–5) |
| Immunosuppressants, n (%) | 827 | 267 (32.3) | 124 (23.1) | <0.0001 | 90 (46.4) | 0.315 | 53 (55.2) |
Values are presented as mean (s.d.) unless stated otherwise.
Data available in less than half of patients.
Significant P-values (<0.05) are in bold.
CK: creatine kinase; DLCO: diffusing capacity for carbon monoxide; DUs: digital ulcers; EScSG: European Scleroderma Study Group; FEV1: forced expiratory volume in the first second; FVC: forced vital capacity; GI: gastrointestinal; GERD: gastroesophageal reflux disease; Hb: haemoglobin; ILD: interstitial lung disease; LD: lung disease; sPAP: systolic pulmonary artery pressure; immunosuppressants: CYC, SSZ, HCQ, MTX, LEF, AZA, MMF, ciclosporin A, d-penicillamine, rituximab, imatinib, anti-TNF inhibitors, tocilizumab or abatacept; mRSS: modified Rodnan Skin Score; PH: pulmonary hypertension; PMI: primary myocardial involvement; SRC: scleroderma renal crisis; TFRs: tendon friction rubs; TLC: total lung capacity.
Demographic and clinical characteristics of ATA-positive patients at baseline
| Characteristics | Patients with data available, n | Total ATA (N = 619) | ATA-dcSSc (n = 425) | P-value | ATA-lcSSc (n = 194) |
|---|---|---|---|---|---|
| Female, n (%) | 619 | 463 (74.8) | 302 (71.1) | 0.003 | 161 (83) |
| Age at RP onset, years | 615 | 45.3 (34.5–55.6) | 45.1 (35.4–55.3) | 0.832 | 45.4 (31.4–56) |
| Time from RP to SSc, years | 615 | 0.3 (0–2) | 0.1 (0–1.2) | <0.0001 | 0.7 (0–3) |
| Age at SSc onset, years | 619 | 47.2 (36.9–57) | 46.8 (36.9–56.3) | 1.000 | 47.8 (37.3–57.8) |
| Age, years | 619 | 48.9 (38.6–58.6) | 48.2 (38.6–58.2) | 1.000 | 49.7 (38.4–59.3) |
| Disease duration, years, mean (s.d.) | 619 | 1.4 (0.8) | 1.5 (0.8) | 1.000 | 1.4 (0.9) |
| BMI, mean (s.d.) | 357 | 24.7 (4.4) | 24.3 (4.2) | 0.030 | 25.5 (4.7) |
| ESR >20 mm/h, n (%) | 330 | 147 (44.5) | 111 (48.7) | 0.047 | 36 (35.3) |
| CRP elevation, n (%) | 337 | 109 (32.3) | 84 (36.4) | 0.040 | 25 (23.6) |
| Hba, g/dl, mean (s.d.) | 57 | 13.4 (0.2) | 13.4 (0.2) | 1.000 | 13.3 (0.3) |
| mRSS | 586 | 12.5 (5–20) | 16 (11–23) | <0.0001 | 5 (2–8) |
| Puffy fingers (ever), n (%) | 336 | 115 (34.2) | 79 (35) | 1.000 | 36 (32.7) |
| DUs ever, n (%) | 616 | 212 (34.4) | 153 (36) | 0.426 | 59 (30.7) |
| DUs current, n (%) | 616 | 190 (30.8) | 137 (32.3) | 0.483 | 53 (27.6) |
| Teleangiectasiaa, n (%) | 109 | 46 (42.2) | 36 (47.4) | 0.195 | 10 (30.3) |
| Joint synovitis, n (%) | 615 | 145 (23.6) | 112 (26.5) | 0.024 | 33 (17.2) |
| TFRs, n (%) | 610 | 112 (18.4) | 102 (24.4) | <0.0001 | 11(5.7) |
| Muscle weakness, n (%) | 615 | 145 (23.6) | 104 (24.7) | 0.665 | 41 (21.1) |
| CK elevation, n (%) | 580 | 83 (14.3) | 58 (14.8) | 1.000 | 25 (13.3) |
| GI involvement, n (%) | 619 | 365 (59) | 264 (62.1) | 0.037 | 101 (52.1) |
| GERD, n (%) | 618 | 344 (55.7) | 251 (59.2) | 0.018 | 93 (47.9) |
| Stomach symptoms, n (%) | 617 | 119 (19.3) | 88 (20.8) | 0.342 | 31 (16.1) |
| Intestinal symptoms, n (%) | 619 | 101 (16.3) | 68 (16.0) | 1.000 | 33 (17.0) |
| SRC, n (%) | 618 | 10 (1.6) | 8 (1.9) | 0.868 | 2 (1.0) |
| Serum creatininea, mg/dl, mean (s.d.) | 58 | 0.83 (0.73) | 0.72 (0.16) | 0.209 | 1.02 (1.19) |
| Proteinuria, n (%) | 589 | 48 (8.1) | 38 (9.4) | 0.189 | 10 (5.4) |
| ILD, n (%) | 598 | 290 (48.5) | 203 (49.5) | 0.925 | 87 (46.3) |
| Restrictive LD, n (%) | 579 | 202 (34.9) | 163 (41.1) | <0.0001 | 39 (21.4) |
| FVC, % predicted | 317 | 90 (77–101) | 86 (75–99) | <0.0001 | 95 (84.5–106) |
| TLCa, % predicted | 201 | 90 (76–100) | 86 (73–99) | 0.008 | 93 (81–107) |
| DLCO, % predicted | 488 | 68 (54–82) | 64 (52–80) | 0.001 | 72 (59–86) |
| FEV1a, % predicted | 232 | 89 (78–100) | 87 (76–99) | 0.015 | 94 (83–103) |
| PHa, n (%) | 243 | 9 (3.7) | 8 (4.7) | 0.447 | 1 (1.4) |
| sPAPa, mmHg, mean (s.d.) | 233 | 28.7 (8.4) | 29.1 (8.9) | 0.389 | 27.7 (6.7) |
| PMI, n (%) | 619 | 134 (21.6) | 98 (23.1) | 0.414 | 36 (18.6) |
| PMI (<45%), n (%) | 607 | 127 (20.9) | 93 (22.4) | 0.400 | 34 (17.8) |
| Ejection fractiona, %, mean (s.d.) | 291 | 62.7 (6.2) | 62.8 (6) | 1.000 | 62.5 (6.7) |
| Cardiac blocks, n (%) | 581 | 57 (9.8) | 40 (10.1) | 1.000 | 17 (9.3) |
| Diastolic dysfunction, n (%) | 571 | 87 (15.2) | 65 (16.6) | 0.371 | 22 (12.3) |
| Pericardial effusiona, n (%) | 301 | 15 (5) | 11 (5.4) | 1.000 | 4 (4.1) |
| Any severe, n (%) | 619 | 351 (56.7) | 247 (58.1) | 0.587 | 104 (53.6) |
| EScSG activity index 2001 | 619 | 1 (0.5–2.5) | 1.5 (0.5–3) | <0.0001 | 0.5 (0–1.5) |
| EScSG activity index 2016a | 52 | 4 (3.1–5.4) | 4.4 (3.8–5.6) | 0.039 | 3.5 (1.5–5) |
| EScSG 2001 active, n (%) | 619 | 103 (16.6) | 87 (20.5) | <0.0001 | 16 (8.2) |
| EScSG 2016 activea, n (%) | 52 | 44 (84.6) | 30 (90.9) | 0.097 | 14 (73.7) |
| Corticosteroids, n (%) | 619 | 228 (36.8) | 165 (38.8) | 0.257 | 63 (32.5) |
| Prednisone equivalent, mg/day | 619 | 5 (5–7.5) | 5 (5–7.5) | 0.059 | 5 (4–6) |
| Immunosuppressants, n (%) | 619 | 332 (53.6) | 242 (56.9) | 0.029 | 90 (46.4) |
Values are presented as median (IQR) unless stated otherwise.
Data available in less than half of patients.
Significant P-values (<0.05) are in bold.
CK: creatine kinase; DUs: digital ulcers; EScSG: European Scleroderma Study Group; FEV1: forced expiratory volume in the first second; GERD: gastroesophageal reflux disease; Hb: haemoglobin; LD: lung disease; sPAP: systolic pulmonary artery pressure; immunosuppressants: CYC, SSZ, HCQ, MTX, LEF, AZA, MMF, ciclosporin A, d-penicillamine, rituximab, imatinib, anti-TNF inhibitors, tocilizumab or abatacept; DLCO: diffusing capacity for carbon monoxide; FVC: forced vital capacity; GI: gastrointestinal; ILD: interstitial lung disease; mRSS: modified Rodnan Skin Score; PH: pulmonary hypertension; PMI: primary myocardial involvement; SRC: scleroderma renal crisis; TFRs: tendon friction rubs; TLC: total lung capacity.
Demographic and clinical characteristics at baseline (Tables 1 and 2)
Group 1 (patients with lcSSc). ATA-lcSSc patients were more frequently male with a shorter time from RP to SSc onset (P < 0.0001) vs ACA-lcSSc, but similar to ANA-lcSSc patients (Table 1). In ATA-lcSSc patients, the median value of the modified Rodnan skin score (mRSS) was consistent with lcSSc at baseline [ 5 (IQR 2–8)] and at the end of follow-up [4 (IQR 0–6)]. At baseline, our group of interest had a higher frequency of increased CRP, articular tendon involvement [i.e. joints synovitis and tendon friction rubs (TFRs)] and muscular impairment (i.e. muscle weakness and elevated creatine kinase levels) than ACA-lcSSc patients but similar to ANA-lcSSc patients. The frequency of SRC, PH and PMI was similar among groups. In contrast, ILD occurred more frequently in ATA-lcSSc (46.3%) than in ANA-lcSSc (P = 0.004) and ACA-lcSSc (P < 0.0001). Restrictive lung disease was more frequent in ATA-lcSSc than in ACA-lcSSc patients (P < 0.0001) but was similar to ANA-lcSSc patients. The frequency of any major organ involvement was higher in ATA-lcSSc compared with ACA-lcSSc (P < 0.0001). The use of both glucocorticoids and immunosuppressants was higher in ATA-lcSSc than in ACA-lcSSc patients (P < 0.0001, for both), but was similar in ATA-lcSSc and ANA-lcSSc patients. Among ATA-lcSSc patients, methotrexate was the most frequently prescribed drug (28% of patients taking immunosuppressants), followed by azathioprine (19%) and mycophenolate mofetil (13%).
Group 2 (ATA-positive SSc patients). The percentage of females was higher and the time from RP to SSc onset was longer in ATA-lcSSc than in ATA-dcSSc patients (Table 2). An increase in serum inflammatory biomarkers, joint synovitis and TFRs was less frequently observed in ATA-lcSSc than in ATA-dcSSc patients, whereas the frequency of muscular impairment was similar in the two groups. At baseline, the frequency of SRC, PMI, PH and ILD (46.3% in lcSSc vs 49.5% in dcSSc) were similar between groups. Nevertheless, restrictive lung disease was less frequent in patients with ATA-lcSSc vs ATA-dcSSc (P < 0.0001), with higher values of FVC, total lung capacity (TLC) and diffusion capacity for carbon monoxide (DLCO) in the former. The occurrence of any major organ involvement was similar in both groups even though immunosuppressants (P = 0.029) were prescribed less frequently in lcSSc vs dcSSc patients.
Multivariable Cox regression models
The mean follow-up in the whole study population was 7.7 years (s.d. 3.5) and similar in all four groups, ranging from 7.2 years (s.d. 3.1) in ATA-lcSSc to 8.1 years (s.d. 3.9) in ACA-lcSSc, with a disease duration at last available follow-up ranging from 8.7 years (s.d. 3.2) to 9.5 (s.d. 4). A total of 136 patients (10.9%) died during follow-up: 16 (8.2%) ATA-lcSSc, 53 (9.9%) ACA-lcSSc, 6 (6.3%) ANA-lcSSc and 61 (14.4%) ATA-dcSSc. According to the clinical practice of expert centres, at least one HRCT was performed in 86% of patients with ATA-lcSSc, 86% with ATA-dcSSc and 74% with ACA-lcSSc and ANA-lcSSc.
Survival curves are reported in Fig. 1 and multivariable Cox regression models for the risk of developing major organ involvement and death are reported in Tables 3 and 4.
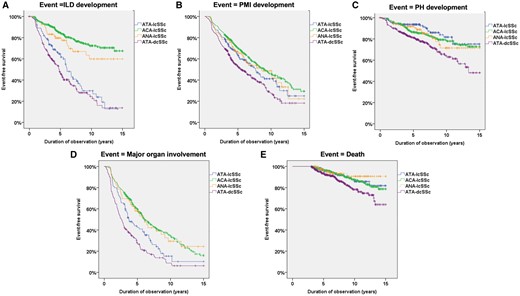
Kaplan–Meier survival curves for risk of major organ involvement and death in the four subsets
Survival curves indicating the risk of (A) ILD), (B) PMI, (C) PH, (D) any major organ involvement and (E) death in the four subsets: ATA-lcSSc, ACA-lcSSc, ANA-lcSSc and ATA-dcSSc.
Multivariable Cox regression models for the risk of major organ involvement in the limited forms
| Variables | HR | CI | P-value |
|---|---|---|---|
| ILD (n = 854, 178 with an event) | |||
| vs ACA-lcSSc | 4.55 | 3.16, 6.29 | <0.0001 |
| ANA-lcSSc | 2.56 | 1.51, 4.27 | <0.0001 |
| Male | 1.10 | 0.56, 1.71 | 0.735 |
| Age | 1.02 | 1.01, 1.04 | <0.0001 |
| Smoke ever | 0.93 | 0.59, 1.45 | 0.612 |
| PMI (n = 860, 336 with an event) | |||
| vs ACA-lcSSc | 1.37 | 1.05, 1.79 | 0.020 |
| ANA-lcSSc | 1.14 | 0.78, 1.69 | 0.479 |
| Male | 1.74 | 1.23, 2.46 | 0.001 |
| Age | 1.02 | 1.01, 1.03 | <0.0001 |
| Arterial hypertension | 1.25 | 0.96, 1.64 | 0.098 |
| BMI | 1.01 | 0.98, 1.05 | 0.387 |
| PH (n = 856, 120 with an event) | |||
| vs ACA-lcSSc | 1.06 | 0.65, 1.75 | 0.803 |
| ANA-lcSSc | 0.94 | 0.49, 1.83 | 0.866 |
| Male | 0.82 | 0.41, 1.65 | 0.058 |
| Age | 1.05 | 1.03, 1.07 | <0.0001 |
| Arterial hypertension | 1.77 | 1.19, 2.64 | 0.005 |
| Any major organ involvement (n = 860, 356 with an event) | |||
| vs ACA-lcSSc | 1.88 | 1.41, 2.49 | 0.0006 |
| ANA-lcSSc | 1.76 | 1.16, 2.69 | 0.008 |
| Male | 1.44 | 0.99, 2.08 | 0.072 |
| Age | 1.02 | 1.01, 1.03 | <0.0001 |
| Arterial hypertension | 1.19 | 0.90, 1.58 | 0.220 |
| Death (n = 860, 75 with an event) | |||
| vs ACA-lcSSc | 1.35 | 0.75, 2.38 | 0.311 |
| ANA-lcSSc | 1.63 | 0.62, 4.16 | 0.314 |
| Age | 1.08 | 1.06, 1.11 | <0.0001 |
| Male | 1.61 | 0.75, 3.45 | 0.208 |
Patients with an event already at baseline were excluded.
Significant P values (<0.05) are in bold. CI: confidence interval; HR: hazard ratio; ILD: interstitial lung disease; PMI: primary myocardial involvement; PH: pulmonary hypertension.
Multivariable Cox regression models for the risk of major organ involvement in ATA positive patients
| Variables | HR | CI | P-value |
|---|---|---|---|
| ILD (n = 617, 192 with an event) | |||
| vs ATA-dcSSc | 0.75 | 0.54, 1.05 | 0.092 |
| Male | 0.95 | 0.64, 1.39 | 0.781 |
| Age | 1.01 | 1.0, 1.02 | 0.05 |
| Smoke ever | 0.98 | 0.57, 1.69 | 0.954 |
| PMI (n = 619, 272 with an event) | |||
| vs ATA-dcSSc | 0.70 | 0.54, 0.92 | 0.011 |
| Male | 1.13 | 0.85, 1.49 | 0.409 |
| Age | 0.98 | 0.97, 0.99 | <0.0001 |
| Arterial hypertension | 1.05 | 0.76, 1.48 | 0.739 |
| BMI | 1.03 | 0.99, 1.06 | 0.075 |
| PH (n = 615, 116 with an event) | |||
| vs ATA-dcSSc | 0.43 | 0.27, 0.69 | <0.0001 |
| Male | 1.32 | 0.86, 2.01 | 0.196 |
| Age | 1.04 | 1.03, 1.06 | <0.0001 |
| Arterial hypertension | 1.18 | 0.75, 1.85 | 0.748 |
| Any major organ involvement (n = 619, 214 with an event) | |||
| vs ATA-dcSSc | 0.66 | 0.49, 0.88 | 0.006 |
| Male | 1.27 | 0.90, 1.78 | 0.171 |
| Age | 1.01 | 1.003, 1.02 | 0.008 |
| Arterial hypertension | 0.82 | 0.51, 1.29 | 0.391 |
| Death (n = 619, 77 with an event) | |||
| vs ATA-dcSSc | 0.57 | 0.33, 1.01 | 0.053 |
| Age | 1.05 | 1.03, 1.07 | <0.0001 |
| Male | 1.8 | 1.11, 2.91 | 0.01 |
Patients with an event already at baseline were excluded.
Significant P-values (<0.05) are in bold. CI: confidence interval; HR: hazard ratio; ILD: interstitial lung disease; PMI: primary myocardial involvement; PH: pulmonary hypertension.
ILD development. A total of 304 of 950 patients without ILD at baseline developed ILD during follow-up. ILD risk was nearly 5-fold higher in ATA-lcSSc patients than in ACA-lcSSc and 2.5-fold higher than in ANA-lcSSc (Table 3). In contrast, it was similar between ATA-lcSSc and ATA-dcSSc (Table 4).
ILD progression (Table 5; Supplementary Table S1 and S2, available at Rheumatology online). Among the 194 ATA-lcSSc patients, 143 (74%) had ILD ‘ever’ (i.e. at baseline or during follow-up). After the exclusion of patients with no available FVC at the ILD diagnosis or with only one FVC measurement after the ILD diagnosis, data on progression were available in 83 cases (58%). Among them, 29/83 (35%) had an FVC decline ≥10% and 48/83 (58%) had an FVC decline ≥5% (Supplementary Table S1, available at Rheumatology online).
Multivariable Cox regression models for the risk of ILD progression
| Variables | HR | CI | P-value |
|---|---|---|---|
| FVC decline ≥10% | |||
| Group 1: n = 196, 81 with an event | |||
| Group 2: n = 289, 138 with an event | |||
| vs ACA-lcSSc | 0.63 | 0.37, 1.08 | 0.093 |
| ANA-lcSSc | 0.86 | 0.42, 1.79 | 0.678 |
| Male | 0.93 | 0.43, 1.99 | 0.856 |
| Age | 1.01 | 0.98, 1.01 | 0.537 |
| Smoke ever | 1.17 | 0.60, 2.26 | 0.635 |
| FVC_0 | 1.02 | 1.01, 1.03 | 0.004 |
| IS_therapy_lung | 2.12 | 1.23, 3.65 | 0.007 |
| vs ATA-dcSSc | 0.61 | 0.40, 0.95 | 0.028 |
| Age | 1.00 | 0.99, 1.02 | 0.296 |
| Male | 1.09 | 0.71, 1.66 | 0.696 |
| Smoke ever | 1.32 | 0.77, 2.26 | 0.301 |
| FVC_0 | 0.99 | 0.98, 1.00 | 0.394 |
| IS_therapy_lung | 1.16 | 0.82, 1.65 | 0.402 |
| FVC decline ≥5% | |||
| Group 1: n = 196, 112 with an event | |||
| Group 2: n = 289, 189 with an event | |||
| vs ACA-lcSSc | 0.86 | 0.55, 1.35 | 0.500 |
| ANA-lcSSc | 1.25 | 0.68, 2.34 | 0.469 |
| Male | 0.95 | 0.52, 1.76 | 0.954 |
| Age | 0.99 | 0.98, 1.01 | 0.894 |
| Smoke ever | 1.03 | 0.54, 1.99 | 0.915 |
| FVC_0 | 1.01 | 0.99, 1.02 | 0.054 |
| IS_therapy_lung | 1.29 | 0.80, 2.07 | 0.286 |
| vs ATA-dcSSc | 0.73 | 0.51, 1.01 | 0.060 |
| Male | 1.12 | 0.77, 1.60 | 0.564 |
| Age | 1.00 | 0.99, 1.01 | 0.760 |
| Smoke ever | 0.98 | 0.56, 1.75 | 0.963 |
| FVC_0 | 0.99 | 0.99, 1.01 | 0.756 |
| IS_therapy_lung | 0.89 | 0.65, 1.22 | 0.474 |
FVC_0: FVC at ILD onset; IS_therapy_lung: immunosuppressants with efficacy on lung involvement (i.e. MMF, AZA, tocilizumab, rituximab, CYC).
Significant P-values (<0.05) are in bold. CI: confidence interval; FVC: forced vital capacity; HR: hazard ratio.
The risk of FVC decline ≥10% was similar in ATA-lcSSc and other limited forms but lower in ATA-lcSSc than in ATA-dcSSc patients. The risk of FVC decline ≥5% was similar between ATA-lcSSc and all the other subsets, including ATA-dcSSc patients (Table 5, Supplementary Table S2, available at Rheumatology online).
In all patients, the period of observation after ILD onset was 3.6 years (IQR 2–5.5) for an FVC decline ≥10% and 2.7 years (IQR 1.3–4.6) for an FVC decline ≥5%.
PMI. A total of 515 of 1000 patients without PMI at baseline developed PMI during follow-up. The risk of PMI in ATA-lcSSc was higher than in ACA-lcSSc but similar to that in ANA-lcSSc (Table 3). Patients with ATA-lcSSc had a lower risk of PMI vs ATA-dcSSc (Table 4).
PH. A total of 213 of 1118 patients without PH at baseline developed PH during follow-up. ATA-lcSSc patients had a risk of PH similar to both ACA-lcSSc and ANA-lcSSc patients but lower than ATA-dcSSc patients (Tables 3 and 4).
Any major organ involvement. A total of 486 of 712 patients without any major organ involvement at baseline developed it during follow-up. The risk of any major organ involvement in ATA-lcSSc was higher than in ACA-lcSSc and ANA-lcSSc (Table 3) and lower than in ATA-dcSSc (Table 4).
All-cause mortality (136 events). The risk of death from all causes in ATA-lcSSc patients was similar to that observed in ACA-lcSSc and ANA-lcSSc patients and tended to be lower than in ATA-dcSSc patients [HR 0.57 (95% CI 0.33–1.01), P = 0.053].
Discussion
Given the wide heterogenicity of SSc, several efforts have been made in the last few years to improve patient stratification, with a renewed interest in the potential role of SSc-specific autoantibodies in predicting outcome [1, 6, 33].
ATA has been traditionally associated with diffuse skin involvement, aggressive disease and poor prognosis. However, recent reports have highlighted a wide spectrum of disease severity among ATA-positive patients [34]. This might be due to the higher sensitivity of ACR/EULAR 2013 criteria in identifying less severe SSc forms and the different titre and Ig classes of ATA. Indeed, it has been observed that high titres of IgG and the presence of IgM ATA are associated with a more progressive disease phenotype [35, 36].
Although ATA-positive lcSSc patients may be considered as a non-classic SSc subset, they are reported in ∼10–11% of recent SSc cohorts [33]. We investigated the largest number of patients with ATA-lcSSc and early disease at baseline. This allowed us a more precise characterization and risk stratification of the ATA-lcSSc clinical phenotype over time compared with previous studies [13, 37]. We compared ATA-lcSSc patients with those affected with other limited forms (ACA-lcSSc and ANA-lcSSc) and with the ‘classical’ ATA-dcSSc subset. Our subclassification differs from previous studies [13, 14] where ATA- and ACA-positive or negative lcSSc and dcSSc patients were considered irrespective of other antibody specificities (e.g. anti-RNA polymerase III, anti-PM/Scl). Given the emerging prognostic role of some autoantibodies in SSc [38, 39] and the potential coexistence of ACA and ATA in the same patient [40], the inclusion or exclusion of a specific autoantibody reactivity might have a great influence on the patient’s characterization.
In contrast to Kranenburg et al. [14], we found a higher frequency of ILD at baseline in ATA-lcSSc vs other lcSSc groups, highlighting a very close association between ATA and ILD since the early stages of SSc. Even during follow-up, the risk of ILD development was similar in ATA-lcSSc patients and ATA-dcSSc, suggesting that all ATA-positive patients should be closely monitored for ILD over time, regardless of the skin subset, as has also been recommended by the recent European consensus on SSc-ILD [21].
In our study population, ATA-lcSSc appears to have a more inflammatory phenotype (i.e. elevated CRP, musculoskeletal involvement) than ACA-lcSSc, but similar to ANA-lcSSc-patients, where few data are available in the literature. These findings might help to identify lcSSc patients with ILD who may benefit from biologics. In fact, tocilizumab is more effective in ATA-positive vs ATA-negative dcSSc patients, raising the idea of investigating this drug in ATA-lcSSc and ANA-lcSSc patients [41].
The risk of PMI in ATA-lcSSc was between that of ACA-lcSSc and ATA-dcSSc, which may be expected since both ATA and dcSSc have been recognized as risk factors for PMI-SSc [42]. Probably due to the different definitions adopted, the PMI risk was higher in our ATA-lcSSc population than in other cohorts [33]. Similar to Kranenburg et al. [14] and Nythyanova et al. [33], we found that the risk of PH was similar among the limited forms irrespective of antibody specificity. On the other hand, the higher risk of PH in ATA-dcSSc vs ATA-lcSSc may be due to the more frequent PMI in the former, given the high prevalence of post-capillary PH vs PAH in SSc [43].
The overall survival rate in our ATA-lcSSc patients was similar to that of the other limited forms, confirming that ATA-positive patients may not invariably have a bad prognosis, as recently highlighted [33, 34]. Compared with dcSSc patients, we found a 15 year survival of 81% in ATA-lcSSc vs 64% in ATA-dcSSc. Interestingly, in the study by Perera et al. [35], published in 2007, 10 year mortality was good in ATA-lcSSc (86%) but remarkably poor in ATA-dcSSc (40%). Thus our results are probably due to the therapeutic advances in dcSSc management over the past 2 decades.
One of the most intriguing observations is the good survival rate of ATA-lcSSc patients despite their high frequency of ILD [14]. Due to the great heterogenicity of SSc-ILD severity and progression, and the evidence that nintedanib reduces the rate of FVC decline in patients with SSc-ILD and chronic progressive fibrosing ILD, the identification of an ILD progressive phenotype has become a priority in the research agenda [23]. To the best of our knowledge, this is the first study assessing the risk of progressive ILD in patients with ATA-lcSSc. At baseline, restrictive lung disease was less common in ATA-lcSSc vs ATA-dcSSc and FVC was higher in the former at the time of ILD diagnosis, suggesting a milder lung involvement in ATA-lcSSc at ILD onset. ATA-lcSSc patients had a risk of ILD progression based on an FVC decline ≥10% lower than that of ATA-dcSSc and similar to the other limited forms. Conflicting data have been reported on the role of ATA in predicting lung disease progression, with most studies evaluating FVC decline at 1 year [44]. A recent EUSTAR study [23] showed that a high skin score, but not positive ATA, was an independent predictor of FVC decline over 5 years. It has been argued that the cut-off ≥10% of FVC decline was derived from studies on idiopathic pulmonary fibrosis and may not be appropriate for SSc-ILD [45, 46]. By adopting the 5% cut-off, we identified twice as many cases of progressive ILD in ATA-lcSSc (59%), a proportion similar to that observed in ATA-dcSSc.
Besides ATA-lcSSc, our study provided new insights into the characterization and risk stratification of ANA-lcSSc patients: >40% had ILD over time and the severity of ILD as well as the risk of PH and PMI were similar to those of ATA-lcSSc. The EUSTAR group has recently developed recommendations for the annual monitoring of SSc, providing a common minimal core set of investigations for all SSc patients [47]. Due to the great heterogeneity of the disease, our findings could help to define a more tailored follow-up in different SSc subgroups.
Among the several strengths of our study, we used a large multicentre SSc cohort and included only patients with early disease at database entry, well-characterized skin involvement and autoantibody profile. The follow-up of at least 3 years allows us to minimize any misclassification of the cutaneous form, since the transition from lcSSc to dcSSc has been reported in the first 3 years of SSc in the great majority of cases [14, 48]; moreover, the percentage of transitions was low in our cohort, in line with other recent reports [46]. Unlike previous studies, we included several important confounders in the models for the risk of organ involvement, such as systemic arterial hypertension in the PMI model, given the importance of considering common cardiovascular comorbidities in the definition of SSc-PMI [49]. As a limitation of the study, the mortality risk may have been slightly underestimated, in particular in the ATA-dcSSc cohort; however, the early mortality in dcSSc patients is limited nowadays: 6% at 3 years in a recent SSc cohort [48]. Being a multicentre study, the autoantibody assays were not all done in the same laboratory, but all EUSTAR centres use standardized and internationally validated assays. Given the paucity of RHC data in the database, the presence of PH was also defined by TTE; however, the cut-off we adopted for a PH diagnosis was shown to be highly correlated with RHC [50]. Finally, since we considered FVC within 1 year from the ILD diagnosis as baseline, we cannot exclude that a few patients might have already progressed at that point. However, this reflects the fact that it is often not possible to perform pulmonary function tests soon after the radiological diagnosis in real-life settings. We did not consider severe GI involvement in the model for any major organ involvement, due to the lack of data to define it.
In conclusion, we provide a better understanding of the clinical phenotype and risk of major organ involvement in ATA-lcSSc patients. Due to the observed high risk of ILD, albeit with a lower risk of progression compared with ATA-dcSSc, our study supports careful screening for ILD in ATA-lcSSc both at baseline and during follow-up. A significant risk of cardiopulmonary involvement was also highlighted in ANA-lcSSc patients that deserves more investigations and may suggest close monitoring in these patients as well. Our study shed more light on the many faces of SSc and provides insights towards a more precise risk stratification of SSc patients.
Acknowledgements
EUSTAR collaborators: Giovanna Cuomo (Naples, Italy), Gianluca Moroncini (Ancona, Italy), Jiri Stork (Prague, Czech Republic), Fiorenzo Iannone (Bari, Italy), Ulrich Walker (Basel, Switzerland), Eugenia Bertoldo (Verona, Italy), Dorota Krasowska (Lublin, Poland), Maria João Salvador (Coimbra, Portugal), Mohammed Tikly (Johannesburg, South Africa), Eric Hachulla (Lille, France), Valeria Riccieri (Rome, Italy), Ami Sha (Baltimore, MD, USA), Ana Maria Gheorghiu (Bucharest, Romania), Cord Sunderkötter (Münster, Germany), Francesca Ingegnoli (Milan, Italy), Luc Mouthon (Paris, France), Vanessa Smith (Gent, Belgium), Francesco Paolo Cantatore (Foggia, Italy), Kilian Eyerich (Munich, Germany), Piotr Wiland (Wroclaw, Poland), Marie Vanthuyne (Brussels, Belgium), Branimir Anic (Zagreb, Croatia), Maria Üprus (Tallin, Estonia), Brigitte Granel (Marseille, France), Alessandra Vacca (Monserrato, Italy), Cristina-Mihaela Tanaseanu (Bucharest, Romania), Paloma García de la Peña Lefebvre (Madrid, Spain), Jean Sibilia (Strasbourg, France), Ira Litinsky (Tel Aviv, Israel), Lesley Ann Saketkoo (New Orleans, LA, USA), Eduardo Kerzberg (Buenos Aires, Argentina), Massimiliano Limonta (Bergamo, Italy), Doron Rimar (Haifa, Israel), Petros Sfikakis (Athens, Greece), Maurizio Cutolo (Genova, Italy), Patricia E. Carreira (Madrid, Spain), Rosario Foti (Catania, Italy), Srdan Novak (Rijeka, Croatia), Michele Iudici (Geneva, Switzerland), Mislav Radic (Split, Croatia), Raffaele Pellerito (Torino, Italy), Carlo Francesco Selmi Rozzano (Milan, Italy), Lidia P. Ananieva (Moscow, Russia), Gabriela Szücs (Debrecen, Hungary), Carlos de la Puente (Madrid, Spain), Ruxandra Maria Ionescu (Bucharest, Romania), Jörg Distler (Erlangen, Germany), Maria Rosa Pozzi (Monza, Italy), Juan Jose Alegre-Sancho (Valencia, Spain), Kristine Herrmann (Dresden, Germany), Ellen De Langhe (Leuven, Belgium), Sule Yavuz Altunizade (Istanbul, Turkey), Carolina de Souza Müller (Curitiba, Brazil), Svetlana Agachi (Chisinau, Republic of Moldova), Douglas Veale (Dublin, Ireland), Esthela Loyo (Santiago, Dominican Republic), Mengtao Li (Beijing, China), Edoardo Rosato (Rome, Italy), Britta Maurer (Bern, Switzerland), Ivan Castellví (Barcelona, Spain), François Spertini (Lausanne, Switzerland), Kamal Solanki (Hamilton, New Zealand), Nicoletta Del Papa (Milan, Italy), Gerard Espinosa (Barcelona, Spain), László Czirják (Pecs, Hungary), Bernard Coleiro (Balzan, Malta), Dominique Farge Bancel (Paris, France), Raffaele Pellerito (Torino, Italy), Christopher Denton (London, UK), Nemanja Damjanov (Belgrade, Serbia and Montenegro), Jörg Henes (Tübingen, Germany), Vera Ortiz Santamaria Granollers (Barcelona, Spain), Michaela Kohm (Frankfurt am Main, Germany), Bojana Stamenkovic (Niska Banja, Serbia and Montenegro).
Funding: No specific funding was received from any bodies in the public, commercial or not-for-profit sectors to carry out the work described in this article.
Disclosure statement: E.Z. has received speaker honoraria or consultancy fees from Actelion Pharmaceuticals, GlaxoSmithKline and Boehringer Ingelheim. J.A. had consultancy relationships or has received research funding from Actelion, Boehringer Ingelheim, Roche, Pfizer, Sanofi and Bristol-Myers Squibb. P.A. has received personal fees from Bristol-Myers Squibb and Boehringer Ingelheim and non-financial support from CSL Behring, SOBI, Janssen, Roche and Sanofi. A.M.H.V. had grant/research support from Boehringer Ingelheim and received speaker and personal fees from Boehringer Ingelheim, Roche, Actelion, MSD, Medscape and Bayer. O.D. had consultancy relationships and/or has received research funding from AbbVie, Acceleron Pharma, Amgen, AnaMar, Arxx Therapeutics, Baecon Discovery, Blade Therapeutics, Bayer, Boehringer Ingelheim, ChemomAb, Corbus Pharmaceuticals, CSL Behring, Galapagos NV, Glenmark Pharmaceuticals, GlaxoSmithKline, Horizon (Curzion) Pharmaceuticals, Inventiva, iQvia, Italfarmaco, iQone, Kymera Therapeutics, Eli Lilly, Medac, Medscape, Mitsubishi Tanabe Pharma, MSD, Novartis, Pfizer, Roche, Sanofi, Serodapharm, Topadur, Target Bioscience and UCB and a patent issued ‘mir-29 for the treatment of systemic sclerosis’ (US8247389, EP2331143). Y.A. had consultancy relationships and/or has received research funding from Actelion, Bayer, Boehringer Ingelheim, Genentech/Roche, Inventiva, Medsenic and Sanofi. The remaining authors have no competing interests to declare.
Data availability statement
The data that support the findings of this study are available upon reasonable request.
Supplementary data
Supplementary data are available at Rheumatology online.

Comments