


Abstract
The objectives of this study were (1) to explore US findings for muscle mass, muscle quality and muscle stiffness in SLE patients and healthy subjects; (2) to investigate the relationship between the US muscle findings and physical performance in SLE patients and healthy subjects.
Quadriceps muscle thickness was used for assessment of muscle mass, muscle echogenicity (using a visual semi-quantitative scale and grayscale analysis with histograms) for assessment of muscle quality, and point shear-wave elastography (SWE) for assessment of muscle stiffness in 30 SLE patients (without previous/current myositis or neuromuscular disorders) and 15 age-, sex- and BMI-matched healthy subjects. Hand grip strength tests and short physical performance battery (SPPB) tests were carried out in the same populations.
No difference was observed between SLE patients and healthy subjects for quadriceps muscle thickness (35.2 mm ±s.d. 6.8 vs 34.8 mm ± s.d. 6.0, respectively, P = 0.79). Conversely, muscle echogenicity was significantly increased in SLE patients (visual semi-quantitative scale: 1.7 ± s.d. 1.0 vs 0.3 ± s.d. 0.5, respectively, P < 0.01; grayscale analysis with histograms: 87.4 mean pixels ± s.d. 18.8 vs 70.1 mean pixels ± s.d. 14.0, respectively, P < 0.01). Similarly, SWE was significantly lower in SLE patients compared with healthy subjects {1.5 m/s [interquartile range (IQR) 0.3] vs 1.6 m/s (IQR 0.2), respectively, P = 0.01}. Muscle echogenicity was inversely correlated with grip strength (visual semi-quantitative scale, Rho: –0.47, P = 0.01; grayscale analysis with histograms, Rho: –0.41, p < 0.01) and SPPB (visual semi-quantitative scale, Rho: –0.50, P < 0.01; grayscale analysis with histograms Rho: –0,46, P < 0.01).
US assessment of muscle echogenicity and stiffness is useful for the early detection of muscle involvement in SLE patients.
The role of US in the assessment of muscle involvement in SLE patients has scarcely been explored.
US evaluation of muscle echogenicity and stiffness, but not US muscle mass, can discriminate between SLE patients and healthy subjects.
Multimodal US may improve the early identification of SLE patients with reduced muscle strength and physical performance.
Introduction
The musculoskeletal (MSK) system is frequently involved in patients with SLE [1]. The spectrum of MSK manifestations in SLE is broad and heterogeneous; SLE can affect the joints, tendons, muscles and bones [2]. In recent years, several imaging studies, especially of US and MRI, have explored the prevalence and clinical impact of MSK manifestations in patients with SLE [3, 4]. Most of these studies have focused on joints and soft tissues, while muscles have been poorly investigated [5, 6].
Muscle involvement in SLE has been traditionally linked to two main conditions: myositis (an inflammatory muscle disorder) and drug-induced myopathy [7, 8]. The clinical and imaging findings in SLE myositis are similar to those observed in PM, while the histologic findings are often less pronounced in SLE patients [9]. In a biopsy study on 55 unselected patients with SLE, lymphocytic vasculitis, myositis, and type II fibre atrophy were significantly increased in SLE patients in comparison with healthy controls [10]. Steroid-induced myopathy is a well-known complication of long-term steroid use in SLE patients. In this condition, muscle enzymes (e.g. creatine phosphokinase) are usually normal, while muscle biopsy may reveal type II atrophy, with less impact on type 1 or slow-twitch muscle fibres, without evidence of inflammation or necrosis (9). The potential value of imaging for the diagnosis of steroid-induced myopathy has scarcely been investigated [11].
Interestingly, recent studies have identified other pathological pathways that may potentially lead to muscle abnormalities (i.e. muscle loss, changes in muscle tissue composition, and reduced muscle strength) in patients with autoimmune or inflammatory conditions, mainly RA, but also SSc and SpA [12]. These pathological pathways may encompass physical inactivity, chronic inflammation (i.e. production of inflammatory cytokines, such as TNF-α or IL-6), reduced growth factor levels [e.g. insulin-like growth factor 1 (IGF-1)], and muscle tissue degradation secondary to cellular metabolic alterations (e.g. NF-kP pathway driven) [13].
The deterioration of skeletal muscle represents the organic substrate of sarcopenia, a muscle disease characterized by loss of muscle mass and strength, which is strongly associated with an increased risk of adverse outcomes, such as falls, frailty, fractures, hospitalization and mortality [14]. Sarcopenia is characterized by changes in muscle composition, such as marked fat and fibrous tissue infiltration, and alterations in innervation [15]. The early identification of muscle abnormalities in patients with rheumatic conditions (ideally before the development of an overt status of sarcopenia or cachexia) may raise important implications for the management of these patients (e.g. the adoption of regular exercise, use of medication and supplements) [16].
In this context, imaging has a potential key diagnostic role. CT, DXA and MRI are regarded as the reference tools for the evaluation of muscle changes. However, their use in clinical practice is limited by feasibility aspects, such as poor availability, cost and, in the case of CT and DXA, consideration of patient exposure to ionizing radiation [17, 18]. US can depict muscle anatomical details and it has been shown to be reliable in the detection of quantitative (i.e. reduced muscle mass/thickness) and qualitative muscle changes (i.e. increased muscle echogenicity due to fatty replacement/fibrosis of muscle tissue) in patients with or at risk of sarcopenia, such as elderly patients and patients with neuromuscular or rheumatic disorders [19, 20]. In addition, by evaluating muscle stiffness, US shear-wave elastography (SWE) is emerging as a promising tool for the assessment of muscle physiological and biomechanical status [21].
To our knowledge, only one US study has investigated muscle architecture changes in patients with SLE [22]. There are no studies examining US SWE. The objectives of this study were 2-fold: first, to compare the US findings for muscle mass, muscle quality and muscle stiffness in patients with SLE (without previous or current myositis or neuromuscular disorders) and healthy subjects and, second, to investigate the correlation between the different US modalities of muscle assessment, and their relationship with the SLE patients’ and healthy subjects’ physical performance.
Methods
Patients
SLE patients attending the out-patient clinic of the Rheumatology Unit of the ‘Carlo Urbani’ Hospital, Ancona (Italy), meeting the revised ACR/SLICC 2012 criteria [23], were consecutively enrolled from February to June 2021. Age-, sex- and BMI-matched healthy subjects (i.e. volunteer staff members from the ‘Carlo Urbani’ Hospital) were included as controls. The exclusion criteria were: age <18 years, current/previous inflammatory myositis or neuromuscular disorders, significant arthritis that could potentially impair patients’ physical performance and grip strength, and intense physical activity in the preceding 4 weeks.
Two clinical rheumatologists taking part in the study (R.D.A. and A.M.R.) collected the following data for the SLE patients: age, sex, BMI, physical exercise, current therapy with DMARDs, use of CSs, SLEDAI-2000 [24], Physician Global Assessment (0–3), SLICC-Frailty Index [25], Strength, Assistance with walking, Rising from a chair, Climbing stairs, and Falls (SARC-F) questionnaire (SARC-F ≥ 4: possible sarcopenia) [26], ESR, CRP, autoantibody profile, C3 and C4 levels, SLE clinical manifestations (e.g. MSK, mucocutaneous, vascular, neurological or renal involvement), and comorbidities. Physical exercise was self-reported by the participants of the study and expressed as number of hours of physical activity per week [27]. Participants were asked: ‘Do you usually perform physical exercise such as cycling, swimming, jogging, aerobics, football, tennis or a gym workout?’ Possible answers were: ‘no physical activity’; ‘mild’ (‘some but <1 h’); ‘moderate’ (‘≥1 h but <3 h’) and ‘intense’ (‘3 h or more’).
Muscle ultrasound
On the same day as the clinical evaluation, a rheumatologist with 10 years of experience in the use of MSK US (A.D.M.), blind to the SLE patients and healthy controls’ demographic and clinical data, carried out the US examinations of the quadriceps muscle bilaterally.
Quadriceps muscle mass was measured adopting the anterior superior iliac spine technique. A detailed description of this technique and its interobserver reliability have recently been published by our research group [28]. The rectus femoris and vastus intermedius muscle thicknesses, as well as their sum (i.e. quadriceps muscle thickness), were measured.
The echogenicity of the rectus femoris and vastus intermedius muscles was assessed using a modified version of the Heckmatt scale [29] developed by the current authors. This modified visual semi-quantitative scale grades muscle echogenicity from 0 to 3, where grade 0 = normal (i.e. normal hypoechoic muscle), 1 = mild (i.e. increased echogenicity in ≤ one-third of muscle tissue), 2 = moderate (i.e. increased echogenicity in > one-third but ≤ two-thirds of muscle tissue) and 3 = severe (i.e. increased echogenicity in > two-thirds of muscle tissue) (Fig. 1).
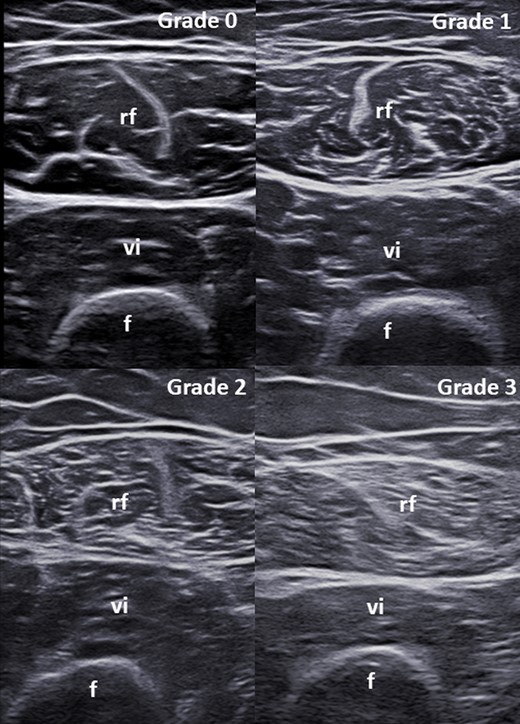
Modified version of the scale by Heckmatt et al. for the visual semi-quantitative assessment of muscle echogenicity
Grade 0 = normal (i.e. normal hypoechoic muscle); Grade 1 = mild (i.e. increased echogenicity in ≤ one-third of muscle tissue); Grade 2 = moderate (i.e. increased echogenicity in > one-third but ≤ two-thirds of muscle tissue); Grade 3 = severe (i.e. increased echogenicity in > two-thirds of muscle tissue). f: femur; rf: rectus femoris muscle; vi: vastus intermedius muscle.
Echo intensity was also determined as mean pixel grayscale intensity in the muscle by an independent rheumatologist (V.M.), blind to the clinical and sonographic data of the SLE patients and healthy subjects, using ImageJ (version 1.53e), which is a public-domain Java-based image processing and analysis program. This imaging software determines the grayscale intensity in a region of interest (ROI), utilizing the histogram function. The rectus femoris and vastus intermedius muscles were selected as ROIs to determine the mean pixel grayscale intensity. The mean echo intensity was expressed in values (i.e. mean pixels) between 0 (black) and 255 (white).
Point SWE measurements were made in four distinct muscle areas and repeated three times for each muscle area evaluated (Fig. 2). The median of the three measurements for each area was recorded as SWE velocity in units of metres per second (m/s), with corresponding IQRs.
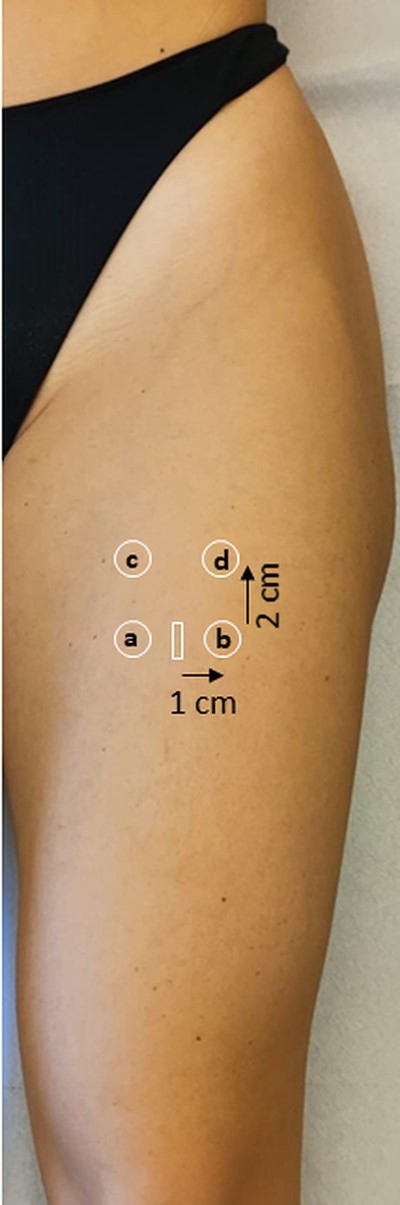
Scanning technique for the acquisition of shear-wave elastography images
Shear-wave elastography measurements were taken in four distinct muscle areas: two measurements were acquired at the level of the landmark for muscle thickness measurement (i.e. the midpoint between the ASIS and the upper pole of the patella, 1 cm medial and 1 cm lateral to the muscle central aponeurosis, ‘medial’ and ‘lateral’, respectively), and two measurements were acquired 2 cm proximally to them (‘upper medial’ and ‘upper lateral’, respectively). White rectangle: midpoint between the anterior superior iliac spine and the superior pole of the patella. a: ‘medial’ quadrant. b: ‘lateral’ quadrant’. c: ‘upper medial’ quadrant. d: ‘upper lateral’ quadrant.
Further information regarding the US scanning protocol, including reliability assessment of muscle echogenicity and SWE, have been reported in Supplementary Data S1, available at Rheumatology online.
Physical performance
SLE patients and healthy subjects underwent a hand grip strength test and SPPB test with an expert research assistant (S.F.). The hand grip strength was assessed using a cylindrically shaped grip device made of five force sensors (FSR-402) (Interlink Electronics, connected to an Arduino Mega 2560) [30]. Cut-offs for low grip strength indicating sarcopenia were established according to the European Working Group on Sarcopenia in Older People (EWGSOP) definitions [14]: <27 kg for men, <16 kg for women.
The SPPB is a well-established test for the evaluation of physical performances. SPPB scores range from 0 (worst performance) to 4 (best performance) for each test, with a score from 0 to 12 at patient level. The previously defined categories for SPPB were used: 0–3 = very low; 4–6 = low; 7–9 = moderate; >10 = high [31].
Ethical approval
This study was approved by the local ethics committee (CERM no. 155/2021). All individuals participating in the study provided written informed consent.
Statistical analysis
Continuous data were described as either medians with IQRs or means ± S.D.s. Categorical data were described as frequencies and/or corresponding percentages. Continuous data were compared using the Mann–Whitney U test. Spearman’s rank correlation was used to measure the association between the different US modalities of muscle assessment both at the thigh and patient/subject level, and between the US findings and the SLE patients; and healthy subjects’ physical performance (i.e. grip strength, SPPB) at patient/subject level.
P values <0.05 were considered significant. The US findings (i.e. muscle thickness, muscle echogenicity and SWE) and physical performance (i.e. grip strength and SPPB) were compared in SLE patients receiving and not receiving steroids. The interobserver agreement between two sonographers in the evaluation of the visual semi-quantitative scale for muscle echogenicity and SWE was calculated with unweighted kappa and linear weighted kappa and interpreted according to Landis and Koch [32]. Reproducibility analysis for ImageJ evaluations and SWE was assessed by computing 2-way, mixed, absolute agreement intraclass correlations (ICCs) with their 95% confidence intervals. ICC values can range from 0 (i.e. variability related to within-patient variability and error) to 1 (i.e. no within patient variability and error, perfect reliability). Statistical analysis was carried out using SPSS version 26.0.
Results
Patients
Thirty SLE patients and 15 age-, gender- and BMI-matched healthy subjects were included. The main demographic and clinical characteristics of the SLE patients and healthy subjects are reported in Table 1.
Demographic and clinical data for the SLE patients and healthy subjects.
| SLE patients (n = 30) | Healthy subjects (n = 15) | P-value | ||
|---|---|---|---|---|
| Age (mean ± s.d.) | 45.6 ± 13.7 | 42.3 ± 10.8 | 0.64 | |
| Gender (F/M) | 28/2 | 14/1 | 0.53 | |
| BMI (mean ± s.d.) | 24.8 ± 5.5 | 23.5 ± 3.8 | 0.84 | |
| Physical activity (yes) | 7 (23.3%) | 3 (20.0%) | 0.90 | |
| Mild | 2 (6.7%) | 0 | ||
| Moderate | 4 (13.3%) | 2 (13.3%) | ||
| Intense | 1 (3.3%) | 1 (6.7%) | ||
| SARC-F (mean ± s.d.) | 2.2 ± 2.1 | 0.3 (0.2) | <0.01 | |
| SARC-F ≥ 4 | 8 (26.7%) | 0 (0.0) | ||
| Disease duration (mean, years, ± s.d.) | 11.2 ± 8.7 | |||
| Autoantibody profile | ANA | 30 (100%) | ||
| Anti-dsDNA Ab | 15 (50.0%) | |||
| Anti-SSa Ab | 12 (40.0%) | |||
| Anti-U1RNP Ab | 10 (33.3%) | |||
| Anti-Sm Ab | 8 (26.7%) | |||
| Anti-SSb Ab | 4 (13.3%) | |||
| Anti-Ribosomal P protein Ab | 2 (6.7%) | |||
| Anti-topo-I Ab | 1 (3.3%) | |||
| Treatment | HCQ | 22 (73.3%) | ||
| MMF | 8 (26.7%) | |||
| BEL | 6 (20.0%) | |||
| MTX | 4 (13.3%) | |||
| AZA | 2 (6.7%) | |||
| RTX | 1 (3.3%) | |||
| CSs | 18 (60.0%) | |||
| Prednisone equivalents (mg) | 6.1 ± 3.2 | |||
| Laboratory | Raised ESR | 13 (43.3%) | ||
| Raised CRP | 7 (23.3%) | |||
| Low C3 level | 19 (63.3%) | |||
| Low C4 level | 15 (50.0%) | |||
| Clinical manifestations | MSK (i.e. synovitis/tenosynovitis) | 24 (80.0%) | ||
| Mucocutaneous | 16 (53.3%) | |||
| Renal | 8 (26.7%) | |||
| Haematological | 8 (26.7%) | |||
| Serositis | 6 (20.0%) | |||
| Ocular | 1 (3.3%) | |||
| APS | 3 (10.0%) | |||
| SLE disease activity (mean ± s.d.) | SLEDAI-2K | 4.4 ± 3.5 | ||
| PGA–VAS | 1.1 ± 0.6 | |||
| SLICC-FI | <0.03: robust | 1 (3.3%) | ||
| 0.03–0.10: relatively less fit | 7 (23.3%) | |||
| 0.10–0.21: least fit | 14 (46.7%) | |||
| >0.21: frail | 8 (26.7%) | |||
| Comorbidities | Diabetes | 2 (6.7%) | ||
| Dyslipidaemia | 5 (16.7%) | |||
| Hypertension | 4 (13.3%) | |||
| Osteoporosis | 4 (13.3%) |
Ab: antibodies; BEL: belimumab; F: female; M: male; MSK: musculoskeletal; PGA: physician global assessment; RTX: rituximab; SARC-F: strength-assistance in walking-rising from a chair-climbing stairs–falls; SLEDAI-2K: SLEDAI 2000; SLICC-FI: SLICC–Frailty Index; Sm: Smith; U1RNP: anti-RNP U1; VAS: visual analogue scale.
US muscle findings in SLE patients and healthy subjects
A total of 60 quadriceps muscles (i.e. 60 rectus femoris and 60 vastus intermedius muscles) and 30 quadriceps muscles (i.e. 30 rectus femoris and 30 vastus intermedius muscles) were scanned in 30 SLE patients and 15 healthy subjects, respectively.
As shown in Table 2, there was no statistically significant difference in the quadriceps muscle thickness between SLE patients and healthy subjects (35.2 mm ± s.d. 6.8 vs 34.8 mm ± s.d. 6.0, respectively, P = 0.79).
US muscle findings in SLE patients and healthy subjects
| SLE patients | Healthy subjects | P-value | ||||
|---|---|---|---|---|---|---|
| (n = 30) | (n = 15) | |||||
| Mean | ±S.D. | Mean | ±S.D. | |||
| Right (mm) | ||||||
| Muscle mass | Rectus femoris muscle thickness | 19.0 | 3.7 | 18.1 | 2.5 | 0.37 |
| Vastus intermedius muscle thickness | 16.6 | 6.4 | 17.1 | 4.6 | 0.88 | |
| Sum (i.e. quadriceps muscle thickness) | 35.4 | 6.8 | 35.2 | 5.7 | 0.97 | |
| Left (mm) | ||||||
| Rectus femoris muscle thickness | 18.6 | 3.5 | 18.0 | 3.1 | 0.52 | |
| Vastus intermedius muscle thickness | 16.5 | 4.6 | 16.5 | 4.8 | 0.85 | |
| Sum (i.e. quadriceps muscle thickness) | 35.1 | 6.9 | 34.5 | 6.5 | 0.77 | |
| Bilateral (mm) | ||||||
| Rectus femoris muscle thickness | 18.8 | 3.6 | 18.0 | 2.8 | 0.31 | |
| Vastus intermedius muscle thickness | 16.4 | 4.3 | 16.8 | 4.6 | 0.98 | |
| Sum (i.e. quadriceps muscle thickness) | 35.2 | 6.8 | 34.8 | 6.0 | 0.79 | |
| Muscle quality (muscle echogenicity) | Visual semi-quantitative scale (0–3) | |||||
| Right quadriceps muscle | 1.6 | 1.0 | 0.2 | 0.4 | <0.01 | |
| Left quadriceps muscle | 1.7 | 1.0 | 0.3 | 0.6 | <0.01 | |
| Bilateral quadriceps muscles | 1.7 | 1.0 | 0.3 | 0.5 | <0.01 | |
| Grayscale analysis with histograms (mean pixel intensity) | ||||||
| Right quadriceps muscle | 87.7 | 20.1 | 69.1 | 15.2 | <0.01 | |
| Left quadriceps muscle | 87.1 | 17.8 | 71.1 | 13.2 | <0.01 | |
| Bilateral quadriceps muscles | 87.4 | 18.8 | 70.1 | 14.0 | <0.01 | |
| Median | IQR | Median | IQR | |||
| SWE (m/s) | ||||||
| Muscle stiffness | ‘Medial’ (bilateral) | 1.5 | 0.2 | 1.6 | 0.3 | <0.01 |
| ‘Lateral’ (bilateral) | 1.5 | 0.3 | 1.7 | 0.3 | <0.01 | |
| ‘Upper medial’ (bilateral) | 1.5 | 0.2 | 1.6 | 0.3 | <0.01 | |
| ‘Upper lateral’ (bilateral) | 1.5 | 0.3 | 1.6 | 0.2 | <0.01 | |
| Right (patient level) | 1.5 | 0.3 | 1.6 | 0.2 | 0.01 | |
| Left (patient level) | 1.5 | 0.4 | 1.6 | 0.2 | 0.01 | |
| Bilateral (patient level) | 1.5 | 0.3 | 1.6 | 0.2 | 0.01 | |
Bold font indicates a significant result. IQR: interquartile range; SWE: shear-wave elastography.
On the other hand, a significant increase in quadriceps muscle echogenicity was observed in SLE patients in comparison with healthy subjects, both by the visual semi-quantitative scale (1.7 ± s.d. 1.0 vs 0.3 ± s.d. 0.5, respectively, P < 0.01) and by grayscale analysis with histograms (mean pixels: 87.4 ± s.d. 18.8 vs 70.1 ± s.d. 14.0, respectively, P < 0.01) (see also Supplementary Fig. S1, available at Rheumatology online).
SWE was significantly lower in SLE patients in comparison with healthy subjects [median 1.5 m/s (IQR 0.3) vs median 1.6 m/s (IQR 0.2), respectively, P = 0.01] (see also Supplementary Fig. S2, available at Rheumatology online). Fig. 3 shows representative US muscle echogenicity and SWE in SLE patients and healthy subjects.
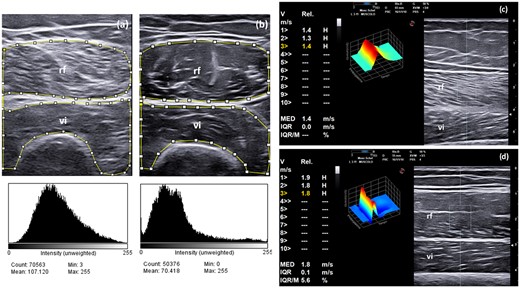
Muscle echogenicity (i.e. semi-quantitative evaluation and grayscale analysis with histograms) and SWE in SLE patients and healthy subjects
(a, b) An US transverse scan of the rectus femoris and vastus intermedius muscles shows different grades of echogenicity in an SLE patient (a) and in a healthy subject (b). The patient with SLE was given a score = 3 (i.e. increased muscle echogenicity in more than two-thirds of muscle tissue), while the healthy subject was given a score = 0 (i.e. normal hypoechoic muscle) according to the modified version of the scale by Heckmatt et al. for the visual semi-quantitative assessment of muscle echogenicity (see Fig. 1 for reference). The region of interest (ROI) for grayscale image analysis with histograms is included within the small squares and lines. (c, d) US longitudinal scan of the rectus femoris and vastus intermedius muscles using point shear-wave elastography (SWE). Note the reduced SWE values in the patient with SLE (1.4 m/s, IQR 0.0, Fig. 3c) in comparison with the healthy subject (1.8 m/s, IQR 0.1, Fig. 3d). These measurements were obtained in the ‘upper lateral’ quadrant of the rectus femoris muscle. The ROI for SWE measurement is defined by the rectangular area. V= velocity; Rel: reliability; IQR/M: interquartile range/median; rf: rectus femoris muscle; vi: vastus intermedius muscle.
No significant difference was observed in the US findings for SLE patients receiving steroids vs SLE patients not receiving steroids. There was a non-significant trend for an association between increased muscle echogenicity evaluated with the visual semi-quantitative scale and for steroids use (see Supplementary Data S1, available at Rheumatology online).
Correlations between the various US modalities of muscle assessment
As shown in Table 3, there was a significant correlation between the two US modalities for muscle echogenicity assessment, i.e. the visual semi-quantitative scale and the grayscale analysis with histograms (Rho: 0.71, P < 0.01), and an inverse correlation between these two US modalities and SWE (Rho: –0.70, P < 0.01 and Rho: –0.55, P < 0.01, respectively) in SLE patients and healthy subjects. Conversely, no significant correlation between muscle thickness, muscle echogenicity (neither using the visual semi-quantitative scale nor the grayscale analysis with histograms) and SWE was found.
Correlation between the different US modalities of muscle assessment (i.e. muscle mass measurement, muscle echogenicity, SWE) in SLE patients and healthy subjects
| Visual semi-quantitative scale | Grayscale analysis with histograms | SWE | |||
|---|---|---|---|---|---|
| RIGHT | Muscle thickness | Rho | –0.12 | –0.03 | 0.06 |
| P | 0.43 | 0.84 | 0.68 | ||
| Visual semi-quantitative scale | Rho | – | 0.65 | -0.67 | |
| P | <0.01 | <0.01 | |||
| Grayscale analysis with histograms | Rho | – | – | –0.47 | |
| P | <0.01 | ||||
| LEFT | Muscle thickness | Rho | –0.08 | 0.04 | 0.05 |
| P | 0.60 | 0.77 | 0.75 | ||
| Visual semi-quantitative scale | Rho | – | 0.66 | -0.64 | |
| P | <0.01 | <0.01 | |||
| Grayscale analysis with histograms | Rho | – | – | –0.48 | |
| P | <0.01 | ||||
| BILATERAL | Muscle thickness | Rho | –0.07 | 0.01 | 0.02 |
| P | 0.65 | 0.94 | 0.92 | ||
| Visual semi-quantitative scale | Rho | – | 0.71 | -0.70 | |
| P | <0.01 | <0.01 | |||
| Grayscale analysis with histograms | Rho | – | – | –0.55 | |
| P | <0.01 |
Bold font indicates a significant result. SWE: shear-wave elastography.
Physical performances and correlations with the US findings
SLE patients had lower grip strength in comparison with healthy subjects (26.2 ± s.d. 5.8 vs 32.3 ± s.d. 5.1), but this difference did not reach statistical significance (P = 0.12). One patient with SLE (3.3%), but none of the healthy subjects, had reduced grip strength according to the cut-offs for sarcopenia defined by the EWGSOP (i.e. <16 kg in females). The mean SPPB results were significantly lower in SLE patients in comparison with healthy subjects (10.1 ± s.d. 2.2 vs 12 ± s.d. 0.0, respectively, P < 0.01) (see also Supplementary Fig. S3, available at Rheumatology online).
In SLE patients and healthy subjects, there was a positive trend for an association between muscle thickness and grip strength (Rho: 0.28, P = 0.06), but no association between muscle thickness and SPPB (Rho: 0.06, P = 0.70) was observed. On the other hand, muscle echogenicity was inversely correlated with grip strength (visual semi-quantitative scale Rho: –0.47, P = 0.01; grayscale analysis with histograms Rho: –0.41, P < 0.01) and SPPB (visual semi-quantitative scale Rho: –0.50, P < 0.01; grayscale analysis with histograms Rho: –0.46, P < 0.01). No significant correlation was found between SWE and grip strength (Rho: 0.245, P = 0.10), but there was a positive trend for an association between SWE and SPPB that did not reach statistical significance (Rho: 0.28, P = 0.07).
No significant difference was observed in the physical performance of SLE patients receiving steroids vs that of SLE patients not receiving steroids (See the Supplementary Data S1, available at Rheumatology online).
Discussion
This study has investigated the value of US in the assessment of various aspects of muscle involvement (i.e. muscle mass, muscle quality and muscle stiffness) in SLE patients, in comparison with healthy subjects, and their correlations with muscle strength and physical performance. Low muscle strength and reduced physical performance represent two of the three criteria for the diagnosis of sarcopenia according to the EWGSOP and the Asian Working Group for Sarcopenia (ASWG) [14, 33]. Low muscle strength has also been shown to represent a potential indicator of physical disability in SLE patients [34], and it has been associated with a wide range of poor health outcomes, including cardiovascular events and premature mortality [35]. The results of the current study suggest that the US assessment of muscle echogenicity, a reliable surrogate of muscle quality [36], and/or muscle stiffness, could discriminate between SLE patients and healthy subjects and may improve the early identification of SLE patients with reduced muscle strength and physical performance.
Indeed, no significant difference in muscle mass (i.e. the traditional reference method for US muscle assessment in patients with or at risk of sarcopenia [37]) was observed between SLE patients and healthy subjects. Conversely, increased muscle echogenicity (evaluated semi-quantitatively and by grayscale analysis with histograms), as well as reduced SWE values, were found in SLE patients in comparison with healthy subjects. These findings have various possible interpretations, including the relatively young mean age of the SLE patients (45.6 years), which is by far younger than that of populations commonly included in studies evaluating sarcopenia. It is known that reduction in muscle mass is a process strongly associated with advanced age, and that it particularly increases after 65 years of age [38]. Interestingly, in the only study evaluating US muscle changes in patients with SLE [22], Kaya et al. showed an increase in muscle thickness in the vastus lateralis muscle in SLE patients in comparison with healthy controls, while no difference was observed in the thickness of the gastrocnemius muscle. Another possible interpretation could be that the included SLE patients had relatively well-preserved muscle strength. Although the SLE patients had a reduced hand grip strength in comparison with their healthy subject counterparts, this difference did not reach statistical significance, with only one SLE patient fulfilling the criteria of low muscle strength according to the EWGSOP [14]. Interestingly, studies in healthy young adults have demonstrated that changes in muscle quality may precede changes in muscle size, and the former may significantly impact on the muscle function and strength independently of any reduction in muscle mass [39, 40]. This might explain the observation of changes in muscle quality (i.e. increased muscle echogenicity), notwithstanding preserved muscle mass, associated with reduced physical performance (i.e. reduced grip strength and SPPB) in SLE patients and healthy subjects in the current study.
The healthy controls included in our study were all staff members of the hospital, and therefore active people with the ability to work. Although the level of physical activity did not differ between the SLE patients and the healthy subjects (see Table 1), whether the results obtained in the current study would be confirmed in a more sedentary population of healthy controls will need to be further investigated. Similarly, fatigue (a very common clinical manifestation in SLE, with a recognized potential impact on SLE patients’ muscle strength and physical performance) [41], as well as arthralgia, should be regarded as potential confounders for the participants’ grip strength test and SPPB.
In the current study, we have proposed a visual semi-quantitative scale for the measurement of muscle echogenicity, which is a modified version of the Heckmatt scale [29]. Whereas the Heckmatt scale measures the degree of muscle echointensity (i.e. normal, increased or markedly increased echogenicity), this modified scale grades echointensity abnormalities based on extent of muscle involved (i.e. less than a third, between one-third and two-thirds, or more than two-thirds of the muscle area). The measurement of muscle echogenicity based on the area of muscle involved as opposed to the degree of the echointensity change may present some pitfalls. For example, in patients with muscle atrophy, loss of contractile muscle tissue can lead to crowding of connective tissue and a seeming increase in echointensity. Therefore, further studies are needed to evaluate the applicability, validity and reliability of the modified semi-quantitative scale developed by the current authors.
The present results also highlight the promising value of SWE, a relatively new US technique that has demonstrated the ability to measure the stiffness of muscle tissue. Recent studies have demonstrated that SWE was able to detect abnormally reduced thigh stiffness in elderly people, as well as in patients with idiopathic inflammatory myositis [42], although this observation was not corroborated by other studies in patients with neuromuscular disorders or RA [43]. In the present study, SWE was able to discriminate the level of muscle stiffness in SLE patients from that in healthy subjects, with the former group showing significantly reduced SWE values compared with the latter. Interestingly, SWE was inversely associated with muscle echogenicity, both when evaluated by a visual semi-quantitative scale or by grayscale analysis with histograms (Table 3), thus suggesting a possible relationship between decreased muscle quality and increased muscle stiffness.
All proposed definitions for sarcopenia include the measurement of muscle mass. Indeed, a low muscle mass represents the condicio sine qua non for defining sarcopenia according to the EWGSOP and ASWG criteria [14, 33]. The current results suggest that US assessment of muscle echogenicity and stiffness may provide a quick and reliable differentiation between SLE patients with and without clinically relevant muscle involvement. Further studies are needed to evaluate the potential long-term benefits of lifestyle interventions (e.g. referral to dedicated physical programs, nutritional supplementation) on those patients with muscle involvement.
The current study has some limitations, the first being the relatively low number of SLE patients. Thus, further investigations in larger cohorts are desirable. Second, an external validation reference (e.g. histology or a reference imaging tool for the assessment of muscle involvement, such as MRI) could have provided a more comprehensive understanding of the US findings (e.g. differentiation between subclinical myositis and steroid myopathy, or sarcopenia) and therefore of their relevance in an asymptomatic population. In addition, the measurement of muscle enzymes would have facilitated the detection of subclinical myositis in SLE patients. Interestingly, no significant difference either in the US findings or in physical performance was observed when assessing SLE patients receiving steroids vs SLE patients not receiving steroids—only a tendency for increased muscle echogenicity (evaluated using the visual semi-quantitative scale) with use of steroids that did not reach statistical significance. These findings could be explained by the relatively low dose of prednisone (6.1 mg/day) of the included patients, and/or to the limited number of SLE patients. Third, the decision to adopt a pragmatic US scanning protocol that included only the evaluation of the quadriceps muscle might have led to under- or over-estimating the prevalence of muscle changes in SLE patients. Our aim was to propose a feasible and reproducible US scanning protocol that could be applied to a systemic condition, such as SLE, in which a homogeneous and broad involvement of muscle structures would be expected. The quadriceps muscle was chosen for its high reliability in several US studies [44, 45], and good correlation with reference imaging tools for the evaluation of muscle involvement, such as MRI or CT scan [46, 47], as well as with appendicular lean mass determined by DXA [48]. In addition, the quadriceps muscle represents one of the earliest targets for the development of age-related muscle wasting [49].
Following the EWGSOP and AWGS recommendations [14, 33], we adopted the hand grip test to measure muscle strength, as this test has been demonstrated to be reliable, and to correlate with muscle strength in other body compartments, therefore serving as an accurate surrogate for more complicated assessments of arm and leg strength [50]. The fact that physical performance tests were not performed at the level of the quadriceps muscle (e.g. knee flexion/extension torque) should be regarded as a limitation of the study, as this could have provided additional and more targeted information about the relationship between the US findings and muscle strength and function.
Conclusions
US evaluation of muscle echogenicity and stiffness, but not US muscle mass, can discriminate between SLE patients and healthy subjects. Multimodal US may be able to play a key role in the early identification of SLE patients with reduced muscle strength and impaired physical performance.
Acknowledgements
A.D.M. largely designed the study, carried out the US examinations, and wrote the manuscript. G.S. contributed to the design of the study and to development of the visual semi-quantitative scale for the assessment of muscle echogenicity. E.C. performed the statistical analysis. R.J.W., C.V.-E., E.F. and W.G. contributed to the analysis and interpretation of the data and the writing of the manuscript. R.D.A. and A.M.R. are the clinicians who collected the patients’ clinical information. V.M. performed the grayscale analysis with histograms for muscle echogenicity and contributed to the analysis of the data. F.S. contributed to the design of the study and to the analysis of the data. S.F. was a research assistant in the study and supervised the assessment of the SLE patients’ and healthy subjects’ physical performance. All co-authors contributed to critical revision of the manuscript and approved the final version for publication.
Funding: No specific funding was received from any bodies in the public, commercial or not-for-profit sectors to carry out the work described in this article.
Disclosure statement: R.J.W. has received honoraria from Abbvie, Novartis and GE for US-related educational activities. E.F. has received speaking fees from AbbVie, Amgen, BMS, Janssen, Lilly, Novartis, Roche, Pfizer and UCB, outside the submitted work. W.G. has received speaking fees from Celltrion and Pfizer, outside the submitted work. All of the other authors have declared no conflicts of interest.
Data availability statement
The data underlying this article will be shared upon reasonable request to the corresponding author.
Supplementary data
Supplementary data are available at Rheumatology online.

Comments