


Abstract
Muscle weakness in idiopathic inflammatory myopathies (IIMs) is conventionally assessed using manual muscle testing (MMT). However, more objective tools must be developed to accurately and reliably quantify muscle strength in myositis patients. Hand-held dynamometry (HHD) is a quantitative, portable device with reported reliability in neuromuscular disorders. Our aim was to assess the reliability, validity and responsiveness of HHD in myositis.
Myositis patients [DM, necrotizing myopathy (NM), PM and anti-synthetase syndrome] evaluated at the University of Pittsburgh myositis centre were prospectively enrolled. Each patient was assessed at 0, 3 and 6 months for validated outcome measures of myositis disease activity and physical function. At each visit, muscle strength was assessed using both MMT and HHD (Micro FET2, Hoggan Health Industries, Draper, UT, USA). The reliability, validity and responsiveness of the HHD was assessed using standard statistical methods.
Fifty IIM patients (60% female; mean age 51.6 years; 6 PM, 9 NM, 24 DM and 11 anti-synthetase syndrome) were enrolled. HHD showed strong test–retest intrarater reliability (r = 0.96) and interrater reliability (r = 0.98). HHD correlated significantly with the MMT score (r = 0.48, P = 0.0006) and myositis disease activity and functional measures. Longitudinal analysis showed a significant and strong association between the HHD and MMT as well as 2016 ACR/EULAR myositis response criteria (r = 0.8, P < 0.0001) demonstrating responsiveness. The mean effect size and standardized response mean of HHD was large: 0.95 and 1.03, respectively. MMT had a high ceiling effect compared with HHD.
HHD demonstrated strong reliability, construct validity and responsiveness in myositis patients. External validation studies are required to confirm these findings.
Manual muscle testing has limitations in strength assessment, including ceiling effect and poor responsiveness.
A hand-held dynamometry is a reliable and valid tool with good responsiveness to change in myositis.
A hand-held dynamometry could be an alternative to MMT in the assessment of muscle strength in myositis.
Introduction
The idiopathic inflammatory myopathies (IIMs) are heterogeneous disorders characterized by symmetrical proximal muscle weakness, elevated skeletal muscle enzymes, myopathic electromyography findings and inflammation in muscle tissue. Current treatment strategies include glucocorticoids alone or in combination with other immunosuppressive agents [1]. Six core set measures (CSMs) have been developed and validated by the International Myositis Assessment and Clinical Studies (IMACS) Group for use in clinical trials and practice [2]. These core set measures include serum creatine kinase (CK) level, patient- and physician-reported global disease activity, an extramuscular disease activity measure, manual muscle testing (MMT) and the HAQ disability index (HAQ-DI) as a patient-reported measure of physical function. Except for the MMT and CK, the CSMs (self- and physician-reported) are plagued by subjectivity and recall bias, which limits their usefulness in the accurate assessment of clinical change in myositis patients. Further, MMT grading is a semiquantitative measure suffering from subjectivity due to examiner variability, including experience and strength [3], poor sensitivity to change, a ceiling effect, patient motivation and cooperation and the presence of muscle atrophy [2–7]. Nevertheless, MMT has been the method of choice for assessing muscle strength in >90% of IIM clinical trials, as it is feasible, inexpensive, easily performed, requires no equipment and has adequate interrater and intrarater reliability and validity when performed by a trained examiner [8].
More objective and quantitative tools are necessary to measure muscle strength and limit the aforementioned examiner and patient bias to optimize the evaluation of treatment response in clinical trials and routine practice. A dynamometer is a quantitative tool used to assess muscle strength in several neuromuscular disorders. There are several types of dynamometers, including pull gauge, hand-held, handgrip and isokinetic. Isokinetic dynamometry is considered the gold standard for the evaluation of muscle strength. However, its use is limited due to expense and logistical issues such as time and space considerations. In contrast, hand-held dynamometry (HHD) is an inexpensive, compact and feasible alternative with reported reliability and validity in inclusion body myositis [9], Huntington’s disease [10], spinal muscular atrophy [11], tetraplegia [12], OA [13], critically ill patients [14] and acute phase stroke patients [15]. Further, HHD has been validated against the gold standard, isokinetic dynamometry [16, 17], supporting HHD as a practical alternative to isokinetic dynamometry.
Given these considerations and the need for objective tools to measure muscle strength in IIM, we investigated the reliability, validity and responsiveness of HHD as an objective outcome measure in patients with IIM by employing a longitudinal prospective study design.
Patients and methods
Patients
Patients with DM, PM, necrotizing myopathy (NM) or anti-synthetase syndrome were prospectively enrolled from the outpatient clinics of the University of Pittsburgh from February 2016 to April 2018. DM/PM patients were defined as definite or probable using the Bohan and Peter classification criteria [18, 19]. NM was defined by the presence of necrotizing myositis on muscle biopsy [20] and anti-synthetase syndrome was defined by the presence of an anti-synthetase autoantibody in the setting of arthritis, myositis and/or interstitial lung disease (ILD). Patients with conditions that can interfere with their physical function during the study period, including severe lower extremity OA, fibromyalgia, endocrinopathies and pregnancy, were excluded. Active ILD was defined as requiring an escalation of treatment for the management of ILD within last 6 months of study enrolment. The study was approved by the institutional review board of the University of Pittsburgh and all patients signed an informed consent prior to study participation.
Study design
This was a prospective, longitudinal observational study with three study visits: baseline and 3 and 6 months. Local subjects with inactive disease had an additional study visit at 1 month to assess test–retest reliability.
Measures
The six myositis core set measures collected at each visit included serum CK, manual muscle testing (MMT), patient and physician global disease activity, HAQ-DI and an assessment of extramuscular disease activity using the Myositis Disease Activity Assessment Tool (MDAAT). Three functional measures were also assessed at each visit, including the 6 min walk distance (6MWD), timed-up-and-go (TUG) and sit-to-stand (STS) tests. The 6MWD measures the distance an individual is able to walk over a total of 6 min on a hard, flat surface [21]. The TUG test assesses the functional mobility of the patient by measuring the time needed to stand up from a chair, walk 3 m, turn around, walk back to the chair and sit down [21]. Similarly, the STS test measures the number of times a patient can repeatedly stand up from a chair and sit back down in 30 s [21].
Response measures included patient-reported change, physician-reported change and 2016 ACR/EULAR clinical response groups with the total improvement score (TIS). Patient- and physician-reported change is a question that asks the patient and physician to report how the patient’s ability to carry out daily physical activities has changed compared with the baseline study visit. Seven possible responses include a lot better, moderately better, a little better, stayed the same, a little worse, moderately worse and a lot worse. Due to the small number of study subjects, a lot, moderately and a little better answers were designated as ‘improved’, while the remaining responses were designated as ‘worsened’. The TIS was obtained by the combination of absolute percentage changes in each of six IMACS core set measures, with ≥20 representing minimal, ≥40 moderate and ≥60 major ACR/EULAR clinical response groups [22].
Each patient was categorized as having active vs inactive muscle, skin and ILD by the physician at baseline.
Muscle strength was assessed using the Kendall scale and HHD [23], with the specific MMT assessing nine muscle groups (MMT-9) including the deltoid, bicep, quadricep, iliopsoas, hamstring, ankle dorsiflexor, wrist extensor, neck flexor and neck extensor. Each muscle was graded from 0 to 10, with 0 indicating no contractions felt in the muscle and 10 indicating normal muscle strength with the ability to hold position against strong pressure (range 0–80).
A Micro FET2 (Hoggan Health Industries, Draper, UT, USA) HHD was used to measure muscle strength (Supplementary Fig. 1, available at Rheumatology online). It is a portable, battery-operated device with a test range between 0.8 and 300 N. Two muscle groups were tested by HHD in each patient [bilateral shoulder abductors (deltoid) and hip flexors (iliopsoas)], as the goal was to develop a convenient and expedient outcome measure that can be done at every clinical visit. These muscle groups were selected because they include the most commonly affected muscle groups in myositis subjects. Each patient was tested in a single session and three measurements were recorded for each muscle group with 1–2 min of rest between attempts. Shoulder abduction was assessed with the patient in a sitting position with the shoulder abducted to 90°, elbow flexed at 90° and the dynamometer placed proximal to the elbow. Hip flexion was tested with the patient lying supine with the hip flexed to 30° and the knee extended (Supplementary Fig. 1, available at Rheumatology online) and the dynamometer placed proximal to the knee joint. During each test the patient was instructed to maintain the maximum effort against the device with an examiner trying to overcome the patient’s force [24]. No examiner had previous experience with an HHD, but all had a standard hands-on training prior to the study.
Test–retest reliability of mean scores of HHD
The final HHD score was obtained by averaging the HHD score of each muscle group [(HHDright shoulder abductor + HHDleft shoulder abductor + HHDright hip flexor + HHDleft hip flexor)/4]. Given that three measurements were recorded for each muscle group, two different HHD scores were obtained depending on the average (HHDAll-Mean) or highest (HHDAll-Max) of all three measurements for each muscle group. The selection of these muscle groups for testing was based on the following: the most commonly affected proximal muscle groups in IIM and ease of testing, and a single composite score including upper and lower extremities is desirable as an outcome measure similar to MMT.
Statistical analysis
Statistical analyses included reliability, validity and responsiveness as described below and were performed using GraphPad Prism (version 7.00 for Windows; GraphPad Software, San Diego, CA, USA) except for Cronbach’s α, standardized response mean (SRM) and effect size, which were calculated using SPSS (SPSS Statistics for Windows, version 17.0; SPSS, Chicago, IL, USA).
Reliability
The internal correlation was examined with Pearson correlation between HHD scores obtained from four different muscle groups (right and left shoulder abductors and hip flexors). Internal consistency was determined using Cronbach’s α coefficient designated as excellent (≥0.9), good (≥0.8), acceptable (≥0.7), questionable (≥0.6), poor (≥0.5) and unacceptable (<0.5). Intrarater reliability was assessed with both Pearson correlation and the intraclass correlation coefficient (ICC). The ICC was calculated for the following: between sessions with 30 day and 3 month intervals in patients with inactive disease and within the same clinic session with a 1–2 min interval between three test attempts. The first 10 patients enrolled in the study were tested by two examiners for assessment of interrater reliability. Reliability using the ICC was rated as excellent (>0.9), good (0.75–0.9), moderate (0.5–0.75) and poor (<0.5). Floor and ceiling effects were calculated as the frequency of patients receiving the highest or lowest possible score and were considered to be present if ≥15%. A floor effect refers to the inability to distinguish patients with a level of muscle strength below the lowest measured muscle strength, whereas a ceiling effect refers to a decreased ability to distinguish patients with a level of muscle strength above the highest measured muscle strength.
Validity
The construct validity of the HHD was assessed by Pearson correlation between the HHD score and key clinical and laboratory outcome measures in myositis. For convergent validity, we assessed the high correlations between HHD and MMT, muscle disease activity, physician-reported disease activity and functional measures. For divergent validity, we assessed for low correlations between HHD and extramuscular, pulmonary and cutaneous disease activity scores. As a measure of discriminant validity, the t test was used to evaluate the difference in HHD scores between patients with inactive/no muscle disease vs active muscle disease.
Responsiveness
The responsiveness of the HHD was assessed using Pearson correlations between relative percent changes in the HHD score and various myositis outcome measures, including MMT among patients with active disease and physician-reported change. The magnitude of correlation was defined as strong (r > 0.7), moderate (r ≥0.4–≤ 0.7) and poor (r < 0.4) [25]. The SRM (mean difference between baseline and follow-up visits divided by s.d.paired difference) and effect size (mean difference between baseline and follow-up HHD divided by s.d.pooled) were calculated as measures of responsiveness. The interpretation of the magnitude of the effect size was done using Cohen’s arbitrary criteria as follows: small (0.2), moderate (0.5) and large (0.8) [26]. A paired t test was used to determine the significance of the HHD score change over time within each clinical response group. The minimal clinically important difference (MCID) was calculated using an anchor-based approach. A range of MCIDs were obtained and an average of MCIDs was calculated for the final MCID. Physician-reported change and the ACR/EULAR clinical response groups and HAQ-DI were used as anchors for the anchor-based approach.
Results
Patients
Fifty myositis patients (average enrolment age 51.6 years, 60% female) were enrolled (Table 1). The average age at diagnosis was 48.6 years and most patients (94%) were Caucasian. There were 24 DM, 6 PM, 9 NM and 11 with the anti-synthetase syndrome (without clinical myositis). Among 50 patients there were 8 myositis patients with anti-synthetase antibodies (Table 1). Overall, 76% of patients had myositis-specific or associated autoantibody positivity. Inactive and active patients were included, with 64% having active muscle disease, 24% with active ILD and 22% with active skin disease. Most patients completed the 3 and 6 month follow-up visits (88% and 78%, respectively).
Baseline clinical characteristics of 50 enrolled patients in the study
| Variables | Values |
|---|---|
| Diagnosis, n | 6 PM, 9 NM, 24 DM, 11 anti-synthetase syndrome (without myositis; 8 myositis patients with AS antibody) |
| Age at enrolment, years, mean (s.d.) | 51.6 (14.9) |
| Disease duration, years, mean (s.d.) | 3.0 (4.2) |
| Gender, female/male, n | 30/20 |
| Ethnicity, Caucasian/African American/Asian, n | 47/2/1 |
| Autoantibodies, n/N (%) | 38/50 (76) |
| MSA, n/N (%) | 33/50 (66) |
| Jo-1 | 11 |
| SRP | 5 |
| TIF-1γ | 4 |
| Mi-2 | 4 |
| Pl-12 | 3 |
| Pl-7 | 1 |
| EJ | 2 |
| OJ | 1 |
| MDA5 | 1 |
| SAE | 1 |
| MAA, n/N (%) | 5/50 (10%) |
| RO52 | 3 |
| RO60 | 2 |
| Groups, n (%) | |
| Active muscle disease | 32 (64) |
| Active ILD | 12 (24) |
| Active skin disease | 11 (22) |
| Myositis outcome measures, mean (s.d.) | |
| Physician global disease activity | 3.5 (2.4) |
| MMT-9 (maximum score of 80) | 73.9 ( 8.7) |
| Extramuscular disease activity | 2.1 (1.9) |
| Creatine kinase (U/L) | 1152 (12 396) |
| HAQ-DI | 0.8 (0.8) |
| Patient global disease activity | 4.2 (2.8) |
| Muscle disease activity | 2.2 (2.4) |
| Myositis global damage score | 0.7 (1.1) |
| Pulmonary disease activity | 0.8 (1.7) |
| Cutaneous disease activity | 0.7 (1.3) |
All global activity and damage scores are rated on a 10 cm visual analogue scale of the MDAT and myositis damage index (MDI); MAA: myositis-associated antibodies; MSA: myositis-specific antibodies.
HHDAll-Mean and HHDAll-Max had similar correlations with the core set and functional measures. Among 46 patients with at least two assessments for left deltoid muscle strength at baseline, only 10 demonstrated a decrease with subsequent measurements and the decrease averaged only 16% ( 7) from the first recorded HHD score. Further, 29 of 46 subjects had a lower score on the second attempt, with an average of only a 10% (s.d. 6.9) decrease from the first attempt. Therefore HHDAll-Mean was used for the remaining analyses, given its more common use in the published literature [27–32] and similar correlation coefficients with the other outcome measures compared with HHDAll-Max (Supplementary Table 1, available at Rheumatology online). For the remainder of the article, HHD indicates HHDAll-Mean.
HHD did not correlate with age (r = −0.05, P = 0.7) and BMI (r = 0.08, P = 0.5). HHD was non-significantly higher in males than females [184.1 (s.d. 133.6) vs 146.5 (90.1), P = 0.08]. Similarly, males had higher HHD results than females in subjects with a normal MMT [HHD in males 278.3 (s.d. 103) vs females 232.9 (122.7), P = 0.1].
Reliability
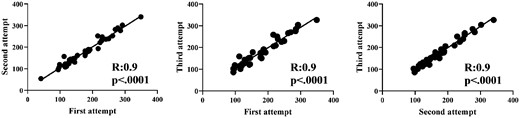
Intrarater reliability of HHD among the three test attempts done within the same clinical session was strong (r = 0.9, P < 0.0001 for all three correlations) with an excellent ICC [0.97 (CI 0.96, 0.98), P < 0.0001] (Fig. 1). Similarly, the average HHD scores for individual muscle groups (deltoid and iliopsoas) also showed strong intrarater reliability (data not shown). Test–retest reliability for patients who had repeated measurements done 1 month apart (n = 19) was strong (r = 0.93, P < 0.0001) with an excellent ICC [0.92 (CI 0.82, 0.97), P < 0.0001]. Test–retest reliability for inactive disease patients (n = 17) who had repeated measurements done 3 months apart was also strong (r = 0.81, P = 0.001) with a good ICC [0.81 (CI 0.47, 0.94), P < 0.0001). The interrater reliability between two examiners was strong (r = 0.98, P < 0.0001) with good to excellent ICCs for average and individual muscle groups (>0.88 for all, P < 0.001). The internal consistency assessment of HHD was excellent with Cronbach’s α coefficient of 0.947.
Validity
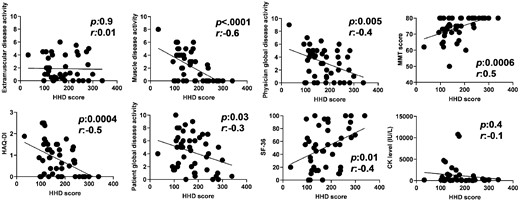
At baseline, HHD showed significant and moderate to strong correlations with the MMT score, muscle disease activity and physician global disease activity, but not with cutaneous and extramuscular disease activity (Fig. 2, Table 2). In addition, HHD correlated significantly with all the patient-reported outcome measures that were evaluated, including the HAQ-DI score, patient global disease activity and the 36-item Short Form Health Survey (Table 2). Similarly, HHD correlated significantly with all the functional measures evaluated: STS, TUG, and 6MWD (Table 2). However, HHD demonstrated no correlation with serum CK levels (r = −0.13, P = 0.39) in all patients. Average HHD scores for individual muscle groups (deltoid and iliopsoas) also showed similarly strong correlations with the MMT score of the same muscle groups, muscle disease activity and physician global disease activity, as well as all the functional measures (data not shown).
Correlations with mean score of HHD and six myositis core set measures and muscle disease activity measure
Correlation between baseline and relative percent change in HHD and MMT over 6 months and the myositis outcome measures
| Variables | HHD baseline | MMT baseline | HHD percent change | MMT percent change | ||||
|---|---|---|---|---|---|---|---|---|
| r | P-value | r | P-value | r | P-value | r | P-value | |
| Core set measures | ||||||||
| Patient global disease activity | −0.30 | 0.03 | −0.58 | <0.0001 | −0.20 | 0.4 | −0.11 | 0.6 |
| Physician global disease activity | −0.40 | 0.005 | −0.49 | 0.0002 | −0.61 | 0.007 | −0.45 | 0.02 |
| HAQ-DI | −0.49 | 0.0004 | −0.69 | <0.0001 | −0.58 | 0.01 | −0.46 | 0.02 |
| Extramuscular disease activity | −0.01 | 0.9 | −0.04 | 0.7 | −0.34 | 0.1 | −0.37 | 0.07 |
| MMT | 0.48 | 0.0006 | N/A | N/A | 0.66 | 0.002 | N/A | N/A |
| CK level (IU/l) | −0.13 | 0.4 | −0.20 | 0.1 | −0.25 | 0.3 | −0.21 | 0.37 |
| Other measures | ||||||||
| SF-36 physical function | −0.37 | 0.01 | −0.46 | 0.001 | −0.71 | 0.004 | −0.73 | 0.0005 |
| Pulmonary disease activity | −0.37 | 0.008 | −0.25 | 0.07 | −0.17 | 0.4 | −0.17 | 0.4 |
| Cutaneous disease activity | −0.15 | 0.3 | 0.03 | 0.8 | −0.21 | 0.3 | −0.10 | 0.6 |
| Muscle disease activity | −0.59 | <0.0001 | −0.68 | <0.0001 | −0.68 | 0.001 | −0.45 | 0.03 |
| Functional measures | ||||||||
| STS | 0.56 | <0.0001 | 0.59 | <0.0001 | 0.30 | 0.2 | 0.45 | 0.03 |
| TUG | −0.36 | 0.01 | −0.46 | 0.0008 | −0.27 | 0.2 | 0.97 | −0.007 |
| 6MWD | 0.44 | 0.002 | 0.48 | 0.0005 | 0.36 | 0.1 | 0.24 | 0.2 |
SF-36: 36-item Short Form Health Survey.
HHD was significantly higher in patients with inactive/no muscle disease as compared with patients with active muscle disease {median 237 [interquartile range (IQR) 184.7–281.9] vs 137.7 [115.4–178.2], P = 0.0003} (Supplementary Fig. 2, available at Rheumatology online), indicating good discriminant validity. Similar results were seen when males and females were evaluated separately (data not shown).
Responsiveness
The relative percent change in HHD over 6 months showed a significant correlation with the key core set measures of MMT, physician global disease activity and HAQ-DI. As expected, the relative percent change in HHD did not show correlations with changes in CK and extramuscular global disease activity (Table 2). The median improvement of 20.7% in HHD was congruent with the median improvement of 6.6% in MMT, 26.1% in HAQ-DI and 58.3% in physician global disease activity (Table 3). Average HHD scores for individual muscle groups (deltoid and iliopsoas) also showed similar results (data not shown).
Relative change in myositis outcome measures over 6 months in patients with physician-reported change
| Outcome measures | Median (IQR) |
|---|---|
| Relative change in HHD, % | 20.7 (5.1 to 71.9) |
| Relative change in physician global disease activity, % | −58.3 (−77.8 to −36) |
| Relative change in MMT, % | 6.6 (0 to 13) |
| Relative change in HAQ-DI, % | −26.1 (−58.5 to 0) |
| Relative change in patient global disease activity, % | −13.3 (−40.6 to 10.9) |
| Relative change in CK, % | −28.3 (−69.5 to 25.4) |
| Relative change in SF-36 physical function, % | 69.3 (6.4 to 200) |
| Relative change in STS, % | 21.4 (8.3 to 50) |
| Relative change in TUG, % | −17 (−20.7 to −3.1) |
| Relative change in 6MWD, % | 8.7 (0.2 to 37.9) |
| Total improvement score, % | 45 (25 to 60) |
SF-36: 36-item Short Form Health Survey.
Importantly, the relative percent change in HHD showed a significant correlation with the TIS (r = 0.8, P < 0.0001) as well as significant differences between physician-reported change (improved vs no change; P = 0.002) and 2016 ACR/EULAR clinical response groups (no improvement vs improvement; P < 0.0001), indicating good responsiveness (Supplementary Fig. 3, available at Rheumatology online).
The patients who had clinical improvement (n = 15) also had a significant increase over time in HHDAll-Mean (P < 0.0001), while patients with stable disease (n = 15) had no significant change in HHDAll-Mean over 6 months (P = 0.81).
The effect size of HHD was large, at 0.78 for 3 months and 0.95 for 6 months in physician-reported clinical response groups (Table 4), indicating sensitivity to change. Similarly, the SRM was also high, at 1.03 for 3 months and 1.19 for 6 months in physician-reported clinical response groups.
Mean change, standardized response mean, effect size and mean and median percent change of HHD in various clinical response groups
| Variables | HHD | |||||
|---|---|---|---|---|---|---|
| n | Mean change | SRM | Effect size | Median change, % | Mean change, % | |
| 0–6 months | ||||||
| Physician change groups | ||||||
| Improved | 15 | 55.5 | 1.1 | 0.9 | 29.8 | 45.3 |
| Unchanged | 15 | 8.8 | 0.1 | 0.1 | 0.7 | 7.1 |
| Worse | 2 | −36.3 | −8.2 | −0.2 | −20.7 | −20.7 |
| ACR/EULAR groups | ||||||
| No improvement | 16 | −3.7 | −0.07 | −0.05 | −9.8 | −2.5 |
| Minimal improvement | 7 | 28.1 | 0.9 | 0.5 | 5.9 | 18 |
| Moderate improvement | 4 | 86.9 | 3.1 | 1.6 | 53.0 | 61.2 |
| Major improvement | 5 | 81.8 | 1.9 | 2.5 | 80.5 | 80.8 |
| 0–3 months | ||||||
| Physician change groups | ||||||
| Improved | 17 | 44.3 | 1.03 | 0.7 | 18.7 | 30.2 |
| Unchanged | 9 | 7.8 | −0.2 | −0.1 | −8.7 | −0.6 |
| Worse | 3 | −20.3 | −0.5 | −0.1 | −14.8 | −16.2 |
| ACR/EULAR groups | ||||||
| No improvement | 11 | −29.3 | 0.01 | 0.01 | −0.7 | 3.3 |
| Minimal improvement | 9 | 38.0 | 0.6 | 0.6 | 15.1 | 18.5 |
| Moderate improvement | 4 | 36.3 | 1.5 | 1.5 | 43.9 | 39.6 |
| Major improvement | 2 | 53.8 | 1.03 | 1.03 | 45.0 | 45 |
MCID for absolute change. The average HHD change over 3 and 6 months for each physician change category and ACR/EULAR clinical response group is shown in Table 4. The mean HHD change for a one-category shift in physician-reported groups was 32.33 and 45.94 over 3 and 6 months, respectively. The mean HHD change for a one-category shift in ACR/EULAR clinical response groups was 28.86 and 31.92 over 3 and 6 months, respectively. Each of these results was considered as an independent estimate of MCID and the average MCID was calculated as 34.76 and was considered the final MCID. The estimated MCID for the HAQ-DI has been reported as 0.22 [9]. Using the HAQ-DI as an anchor, the MCID at 3 and 6 months was 36.66 and 34.72, respectively, demonstrating a similar average MCID of 35.69.
MCID for relative percent change. For calculation of the average clinically meaningful percent change in HHD, we applied a similar strategy as above. The mean percent change for physician-reported and ACR/EULAR clinical response groups is shown in Table 4. The mean percent change for a one-category shift in physician-reported change groups was 23.27 and 33.05 for 3 and 6 months, respectively. The mean percent change for a one-category shift in ACR/EULAR clinical response groups was 13.99 and 27.79 for 3 and 6 months, respectively. Each of these results were considered as an independent estimate of MCID for relative percent change and the average was calculated as 24.52 and was considered the final MCID.
Comparison of HHD and MMT
HHD and MMT showed similar baseline cross-sectional correlations with the core set measures and functional measures (Table 2). HHD scores that corresponds to different MMT groups are summarized in Supplementary Table 2, available at Rheumatology online.
Both HHD and MMT did not have floor effects (both 2%). However, the MMT demonstrated a ceiling effect at 46% (vs 2% in HHD). Twenty-three of 50 patients (46%) had a normal MMT (score = 80) at the baseline visit. However, even these patients with a ‘normal’ MMT had significant variability in HHD scores [median 231 (IQR 97.5–277.2)] as well as in other patient-reported or functional outcome measures, including HAQ-DI score [0 (IQR 0–0.3)], patient global disease activity [2 (IQR) 0.5–4], STS [13 (IQR 11–18)], TUG [6.4 (IQR 5–7.2)] and 6MWD [840 m (IQR 690–1005)].
Regarding differentiation of inactive and active muscle disease, both MMT and HHD showed significant differences between these groups; however, the median score difference between the groups was smaller for MMT [73 (IQR 66.5–75) vs 80 (80–80)] as compared with HHD [137 (IQR 115.4–178.2) vs 237 (184.7–281.9); Supplementary Fig. 2, available at Rheumatology online].
HHD showed a median 29.8% increase in physician-reported improved categories (vs 8.3% in MMT), a 3.3% decrease in unchanged subjects (vs 0% in MMT) and a 20% decrease in worsening groups (vs 0% in MMT) (Table 4). HHD showed a median 9.8% decrease in no (vs 0% in MMT), 5.9% increase in minimal (vs 0% in MMT), 53% increase in moderate (vs 6.6% increase in MMT) and 80.5% increase in major ACR/EULAR clinical response groups (vs 19% increase in MMT) (Table 4). The TIS correlated strongly with both relative percent change in MMT (r = 0.81, P < 0.0001) and HHD (r = 0.82, P < 0.0001).
Discussion
Quantifying muscle strength is a key measure in the clinical assessment of myositis both in clinical practice and clinical trials and the accurate assessment of treatment response in IIM requires precise, quantitative tools. This study demonstrated excellent internal consistency, strong intra- and interrater reliability, moderate to strong convergent and discriminant validity and good responsiveness of HHD as a measure of muscle strength in myositis patients.
In our study, we used HHDAll-Mean (calculated as the average of three measurements for each muscle group) for our analyses even though the HHDAll-Max showed similar psychometric properties. In previous studies assessing HHD, single trial [33, 34], highest [35, 36] and the average of multiple trials [27–32] were all used for estimating the strength of each muscle group. The average of three trials was found to have higher reliability than a single trial [median ICC 0.96 (IQR 0.75–0.99) vs 0.91 (0.49–0.99)] [37]. One can argue that the highest of the three measurements (HHDAll-Max) may represent a more accurate estimate of muscle strength than the average of the three attempts, given potential muscle fatigue with repeated attempts. However, only 20% of the study subjects had a decrease with each attempt, with only a 16% decrease between the first and third attempts. Thus we demonstrated that the effect of muscle fatigue on subsequent measurements was minimal and did not have a significant impact on subsequent muscle strength measurements. In amyotrophic lateral sclerosis (ALS) clinical trials employing HHD as a secondary outcome, each muscle group was tested twice and if the variability was >15%, then a third evaluation was done [38]. In our study, in patients with a lower score on the second attempt compared with the first attempt, the score on the third attempt and the average of the first and second attempts were not significantly different (156.5 vs 165.2). This means that obtaining a third attempt vs using the average of the first two attempts yielded similar results.
There are two techniques to measure muscle strength using HHD, termed ‘make’ and ‘break’. The make technique requires the examiner to hold the device steady while the subject provides resistance against the device with maximal force (isometric contraction). The break technique requires the examiner to overcome the maximal force generated by the subject (concentric contraction), thus resulting in higher dynamometry numbers compared with the make technique. Studies show that intra- and interrater reliability of both techniques are similarly high, with ICCs ranging between 0.91 and 0.97 [12]. In our study, we used the break technique given the scores obtained with break technique are closer to scores obtained with fixed dynamometry [29, 31, 32].
The reliability of HHD in IIM was studied using the same HHD device, test type and device position for shoulder assessment that we utilized [39]. Similar to our results, the intrarater reliability of HHD measured by the same provider within 1 week was shown to be good for shoulder abduction, with an ICC of 0.86, and excellent for total score, with an ICC of 0.92. Interrater reliability of HHD measured by a different provider within 1 h in our study was shown to be good for shoulder abduction, with an ICC of 0.7, and excellent for total score, with ICC of 0.94. These results of intra- and interrater reliability of HHD in IIM are concordant with our results.
To our knowledge, the MCID for HHD-measured muscle strength has not been reported in neuromuscular diseases before. We used the physician-reported and ACR/EULAR clinical response groups along with a previously published MCID of the HAQ-DI as clinically important anchors and propose an MCID for HHD to be 35 N and minimal clinically important percent difference to be 25% in patients with IIM.
In our study, we also compared the psychometric properties of MMT and HHD as measures of muscle strength. MMT and HHD correlated strongly with each other, similar to previous studies [40, 41]. Both showed similarly good construct validity with moderate–strong correlations with key myositis core set measures. However, MMT was noted to have a high ceiling effect (46% vs 2% with HHD), as shown previously [39, 42]. Subjects with a normal MMT had a significant range of myositis disease activity, as indicated by the variability in their HAQ score, patient-reported global disease activity and functional measures. These findings confirm the ceiling effect of the MMT and support the observation that subjects with the maximum score on MMT indeed have muscle weakness that was not captured by the MMT. This is supported by another study that showed 28–41% of participants with normal MMT scores had muscle weakness detected by isokinetic dynamometry [43]. Similarly, HHD has shown measurable weakness in knee extensors of patients with OA that was not detectable by MMT [13]. These results suggest that MMT has limited sensitivity in detecting mild weakness and/or mild improvement that may result in inaccurate assessment and misclassification of subjects regarding treatment response in clinical trials.
Regarding responsiveness, we showed that HHD has good responsiveness to clinical change given the large effect size and SRM, as well as moderate–strong correlations of relative percentage changes of HHD with changes observed in many key myositis outcome measures. Most importantly, HHD showed a strong correlation with the TIS (i.e. 2016 ACR/EULAR myositis response criteria). Further, the median percent change in HHD was considerably higher than the change in MMT in patients with physician-reported improvement (29.8% vs 8.3%), indicating a higher sensitivity to change with HHD. In a study of inclusion body myositis patients, a home exercise program improved strength in the knee, hip, shoulder and elbow muscles detected by HHD, while MMT using the Medical Research Council scale remained unchanged [44]. Another study assessing the efficacy of rituximab in refractory myositis patients demonstrated a significant 93% decrease in CK levels and significant decreases in ESR and CRP levels and median corticosteroid dose, while muscle strength improved significantly by 21% with HHD and non-significantly by 6% using MMT [45]. These results further highlight a lack of sensitivity to change using MMT, a critical factor in the accurate assessment of muscle strength in therapeutic trials. Given the high ceiling effect and poor responsiveness to clinical change using MMT, we recommend the use of HHD in future clinical trials as a key outcome measure. HHD is already being used as a key outcome measure in clinical trials of ALS and other neuromuscular disorders, with standardized training of testers and a standardized protocol for strength measurement [46, 47].
There are important considerations in using HHD, including the cost of the device, the variability among different hand-held dynamometers and the variability in examiner technique. Several studies demonstrated that the evaluator’s strength may affect the reliability and magnitude of muscle strength measured by HHD [48–50]. For example, one study of three examiners with different strength abilities tested muscle strength in the same three muscle groups of 27 healthy adults [48]. Differences among examiners were statistically significant and were highest in knee extensors, which were the strongest muscles examined. However, weaker muscle groups had excellent inter- and intrarater reliability despite differences in the strength of examiners. Thus the examiner strength may not be a significant factor but may be more relevant in patients with clinically inactive muscle disease or examination of relatively stronger muscle groups such as knee extensors. Moreover, even though normative data for HHD are available for each muscle group [24], the type and position of the device, the technique of testing (i.e. make vs break) and the lack of reported cut-offs for each strength category are further mitigating factors that may make it difficult to interpret the score, decreasing comparability between studies. Nevertheless, HHD appears to be a robust tool to assess muscle strength in both clinical practice and experimental myositis trials if adherence to a standardized protocol (i.e. device type, testing procedure, examiner training) is achieved as reported in other neuromuscular diseases [4, 38]. Large observational studies with individuals with a wide range of muscle strength are needed to define normal values as well as cut-offs for weakness categories (mild, moderate and severe).
There are several limitations of our study. Despite being prospective, our cohort was rather small and heterogeneous, limiting our recommendation to suggest HHD for assessing strength in subjects with varying degrees of muscle strength. Moreover, due to the lack of healthy controls, we cannot suggest normative data using the device and technique that we used. All evaluators were strong males, so we cannot assess the interrater reliability of male vs female examiners or weaker vs stronger evaluators.
In conclusion, this study demonstrates that HHD has good reliability, validity and responsiveness to clinical change in patients with myositis. To our knowledge, this is the first study reporting validity, responsiveness and MCID of HHD in inflammatory myopathy. We suggest larger studies addressing the limitations noted above to provide the requisite external validity necessary to move this field forward in accurately assessing muscle strength in clinical trials.
Funding: This work was supported by a Myositis Association research grant to R.A.
Disclosure statement: The authors declare no conflicts of interest.
Supplementary data
Supplementary data are available at Rheumatology online.
References

Comments