


Abstract
A North American registry of JDM patients was examined for frequency of and factors associated with corticosteroid discontinuation, complete clinical response and remission.
We evaluated probability of achieving final corticosteroid discontinuation, complete clinical response and remission in 307 JDM patients by Weibull time-to-event modelling; conditional probability of complete clinical response and remission using Bayesian network modelling; and significant predictors with multivariable Markov chain Monte-Carlo Weibull extension models.
The probability of corticosteroid discontinuation was 56%, complete clinical response 38% and remission 30% by 60 months after initial treatment in 105 patients. The probability of remission was conditional on corticosteroid discontinuation and complete clinical response. Photosensitivity, contractures and a longer time to complete clinical response were predictive of the time to final corticosteroid discontinuation. Anti-MJ (NXP2) autoantibodies and a Northwest residential geoclimatic zone were predictive of shorter time to complete clinical response, while dysphonia, contractures, an increase in medications within 24 months and a longer time to corticosteroid discontinuation were associated with longer time to complete clinical response. Anti-p155/140 (TIF1) autoantibodies, an increase in medications within 12–24 months, or longer times to corticosteroid discontinuation and complete clinical response were associated with longer time to remission.
JDM patients achieve favourable outcomes, including corticosteroid discontinuation, complete clinical response and remission, although timelines for these may be several years based on time-dependent analyses. These outcomes are inter-related and strong predictors of each other. Selected clinical features and myositis autoantibodies are additionally associated with these outcomes.
JDM patients achieved positive outcomes, including corticosteroid discontinuation, complete clinical response and remission after several years.
Anti-NXP2 autoantibodies and Northwest geoclimatic zone were associated with shorter times to complete clinical response.
Anti-TIF1 autoantibodies and increased medications within 12–24 months were associated with longer t imes to remission.
Introduction
JDM is a systemic autoimmune disease associated with muscle and skin inflammation, phenotypes defined by myositis-specific autoantibodies (MSA) [1, 2], and, for some patients, severe disability and decreased quality of life. Daily oral corticosteroids are the mainstay of treatment, with methotrexate, intravenous methylprednisolone and/or IVIG [3, 4] used as combination therapy to decrease the cumulative corticosteroid doses. Factors associated with positive patient outcomes in JDM are not well understood, limiting new therapy development.
The International Myositis Assessment and Clinical Studies Group (IMACS) adapted consensus criteria for myositis complete clinical response and remission, signifying clinical remission on and off therapy, respectively [5]. Complete clinical response has been defined as clinically inactive disease (no signs of disease activity based on clinical features and laboratory testing) for at least six continuous months on treatment, and remission as clinically inactive disease for at least six continuous months off all treatment [6].
Little is known about the frequency of complete clinical response and remission in JDM patients and factors associated with these outcomes. The median time to remission was 4.7 years in a single-centre study, and persistent cutaneous manifestations after diagnosis have been associated with a longer time to achieve remission [7]. In a Taiwanese study, 19.4% of JDM patients achieved clinical remission and estimated median time to achieve clinical remission was 8.4 years; associated factors included female gender and possibly negative Gower’s sign and photosensitivity at disease onset [8]. In a retrospective study of 41 juvenile idiopathic inflammatory myopathy patients with a median of 16.7 years’ follow-up, those with more severe rashes, contractures, arthritis, vasculopathy and antinuclear autoantibodies were less likely to achieve disease quiescence [9].
The purpose of this study was to evaluate the frequency of and time to complete clinical response and remission as positive outcomes in a large North American JDM registry. We also examined final discontinuation of corticosteroid therapy as another outcome of interest. Our goal was to identify factors associated with these outcomes, and to examine the relationship of the three outcomes to each other.
Patients and methods
From 1989 to 2015, we enrolled 400 patients with probable or definite JDM by Bohan and Peter criteria in institutional review board-approved natural history protocols at the National Institutes of Health or Food and Drug Administration. All patients were diagnosed prior to age 18. MSA and myositis associated autoantibodies were tested by standard immunoprecipitation and immunoprecipitation–immunoblot methods [10, 11]. The treating physician completed a questionnaire including demographics, clinical features, laboratory data, environmental factors and outcomes [12–15]. The definitions of illness severity at onset and symptom scores were as previously described [10, 12, 14]. In this analysis, we included 307 patients who had ≥6 months of adequate treatment data, with the enrolling physician retrospectively completing a standardized questionnaire of all courses of medications received, their dates of initiation and termination, and their associated clinical and laboratory responses [13, 16–18]. We excluded patients with unavailable (n = 13) or insufficient treatment data [medication(s), dosage(s) and/or treatment timelines were unknown (n = 34)], unknown outcomes (n = 15), or follow-up duration <6 months (n = 31).
The time from initiation of either oral prednisone or intravenous methylprednisolone to final discontinuation of all corticosteroid therapy was defined as final corticosteroid discontinuation. We used the IMACS criteria for complete clinical response and remission [6], with the treating physician observing ≥6 months of inactive disease, including normal or stable strength, no active skin rashes, no other signs of active disease and normal levels of serum muscle enzymes. Medication escalation was defined as an increase of therapy due to clinical or laboratory evidence of increased disease activity resulting in the addition of a new medication or an increase in the dose of an existing medication by ≥25%. We used this outcome as a surrogate for disease flare.
Statistical methods
First, we determined the probability of and the median time to achieve each outcome using the Kaplan–Meier model and a two-parameter Weibull distribution, including measures of model prediction uncertainty (both frequentist and Bayesian measures). Patient observations were censored at the last clinical observation, in those cases in which the patient did not achieve the end point under evaluation. Weibull models were fitted using Markov chain Monte Carlo (MCMC) methods [19].
Second, we examined the conditional relationship among the three clinical outcomes by Bayesian network analysis, which uses a cyclic directed graph structure to examine the probabilistic relationships among linked outcomes [20]. We evaluated the probability that remission is achieved (or not achieved) conditional on final corticosteroid discontinuation and complete clinical response being achieved (or not achieved). The conditional linkages among the three nodes form the Bayes networks. In this analysis, all the nodes are linked based on the assumed causal relationships in the diagram. For each node, we defined the conditional probability table, which can be considered a discretized probability distribution. We used only two states for each node, achieved or not achieved.
Third, we evaluated predictors associated with corticosteroid discontinuation, complete clinical response and remission using MCMC Weibull univariable models. Predictors analysed were features associated with each outcome in prior reports [7–9, 14, 21–29] (Table 1). This included corticosteroid discontinuation and complete clinical response to test as predictors of remission. In evaluating the relative goodness-of-fit of alternative models, we used a model assessment method called the deviance information criterion (DIC) [30]; those with the lowest DIC values were selected as the best fit models. The parameter posterior distribution and associated credible intervals were used to assess the uncertainty of model parameters. Bayesian credible intervals (90%) are reported. Only variables significantly associated with corticosteroid discontinuation, complete clinical response and remission in univariable modelling that met these parameter credible intervals were retained for multivariable models. In the multivariable analysis, MCMC Weibull methods were used to model the time to achieve corticosteroid discontinuation, complete clinical response and remission. A smaller DIC, after adjusting for the number of model parameters, indicates better model fit. We also observed the degree of uncertainty in model parameters, and the probability that model parameters were different than zero. Models with all parameters different from zero were selected. Higher estimate values indicate a stronger relative influence in the model. Mean values >0 indicate a positive association and <0 indicate a negative association with the outcome. We performed analyses using SAS Enterprise Guide, version 4.3 and JMP for Windows, version 11.0.0 (SAS Institute Inc., Cary, NC, USA).
Patient characteristics in 307 patients with JDM in the present study
| Patient characteristic | Value |
|---|---|
| Year of diagnosis, median (IQR) | October 1994 (July 1992–October 2001) |
| Follow-up duration from diagnosis, median (IQR), months | 42.5 (22.1–73.6) |
| Delay to diagnosis, median (IQR), months | 3.9 (1.8–7.2) |
| Age at first treatment, median (IQR), years | 7.2 (4.6–10.6) |
| Female gender, n (%) | 213 (69.4) |
| Race/ethnicity, n (%) | |
| Caucasian | 217 (70.7) |
| African American | 32 (10.4) |
| Hispanic | 17 (5.5) |
| Other | 41 (13.4) |
| ANA positive (n = 288), n (%) | 206 (71.5) |
| Myositis autoantibodies (n = 305)a, n (%) | |
| Any MSA | 247 (81.0) |
| Any MSA with any MAA | 19 (6.2) |
| Anti-p155/140 (TIF1) | 118 (38.7) |
| Anti-MJ (NXP2) | 86 (28.2) |
| Anti-MDA5 | 25 (8.2) |
| Other MSAs (ARS, Mi-2, HMGCR) | 18 (5.9) |
| Any MAA | 29 (9.5) |
| MSA/MAA negative | 47 (15.4) |
| Onset severity, n (%) | |
| Mild | 34 (11.1) |
| Moderate | 188 (61.2) |
| Severe/very severe | 85 (27.7) |
| Clinical features (ever present), n (%) | |
| Any GI, pulmonary, or cardiac signs/symptoms | 234 (76.2) |
| Joint contractures | 183 (59.8) |
| Photosensitivity | 151 (50.3) |
| Arthritis | 144 (46.9) |
| Distal weakness (n = 296) | 136 (45.9) |
| Any pulmonary or cardiac signs/symptoms | 126 (41.0) |
| Dysphagia | 121 (39.4) |
| Weight loss | 107 (34.9) |
| Dysphonia | 101 (33.1) |
| Calcinosis | 93 (30.3) |
| Any GI/cutaneous ulceration | 62 (20.2) |
| Lipodystrophy | 28 (9.1) |
| Interstitial lung disease | 15 (4.9) |
| Organ symptom score at diagnosis, median (IQR) | |
| Total symptom score at diagnosis | 0.23 (0.15–0.32) |
| Muscle symptom score | 0.33 (0.25–0.5) |
| Skin symptom score | 0.28 (0.17–0.35) |
| Skeletal symptom score | 0.5 (0–0.5) |
| Constitutional symptom score | 0.25 (0.25–0.5) |
| Gastrointestinal symptom score | 0 (0–0.11) |
| Pulmonary symptom score | 0 (0–0.17) |
| Cardiac symptom score | 0 (0–0) |
| Highest values of serum muscle enzymes, median (IQR), U/l | |
| CK | 721 (282–3593) |
| Aldolase | 11.7 (8.1–19.2) |
| AST | 83 (47–161) |
| ALT | 71 (34–133) |
| LDH | 430 (299–690) |
| Environmental factors within 6 months diagnosis, n (%) | |
| Documented infection | 59 (19.2) |
| Site of infection | |
| Respiratory | 43 (14.0) |
| Mucocutaneous | 4 (1.3) |
| Gastrointestinal | 7 (2.3) |
| Immunization | 56 (18.2) |
| Medication received | 48 (15.6) |
| History of sun exposure | 24 (7.8) |
| UV index in 30 days before illness onset based on residential locationb, n (%) | |
| Average UV index, median (IQR) | 4.4 (2.1–6.2) |
| Highest UV index, median (IQR) | 6.7 (3.4–8.6) |
| United States geoclimatic zone at illness onset based on residential location (n = 283)b, n (%) | |
| Northeast | 82 (29.0) |
| South | 41 (15.5) |
| Northwest | 37 (13.1) |
| Central | 35 (12.4) |
| Southeast | 30 (10.6) |
| West | 22 (7.8) |
| East north central | 19 (6.7) |
| Southwest | 9 (3.2) |
| West north central | 5 (1.8) |
| Hawaii | 2 (0.7) |
| Alaska | 1 (0.4) |
| History of hospitalization (n = 298), n (%) | 161 (54.0) |
| History of wheelchair use (n =303), n (%) | 49 (16.2) |
| History of device use (n = 302), n (%) | 27 (8.9) |
| Medication received, n (%) | |
| Oral prednisone | 305 (99.3) |
| Methotrexate | 216 (70.4) |
| i.v. methylprednisolone | 173 (56.4) |
| Antimalarial drugs | 149 (48.5) |
| i.v. immunoglobulin | 117 (38.1) |
| Other DMARDs | 62 (20.2) |
| Cytotoxic/biologics | 38 (12.4) |
| Time from first symptoms to first treatment, median (IQR), months | 4.0 (2.0–8.0) |
| History of medication escalation within 18 months of treatment initiation, n (%) | 128 (41.7) |
Variables in this table were as defined in prior studies [10–12, 16]. aFor this study, MSA and MAA were examined separately. Other MSAs included: anti-Mi-2 (n = 9), anti-ARS (n = 7), anti-HMGCR (n = 2). MAAs present in the population included: anti-Ro (n = 15), anti-PM-Scl (n = 7), anti-U1RNP(n = 4), anti-SUMO (n = 1), anti-Th (n = 1), anti-U3RNP (n = 1) and anti-U5RNP (n = 1). bUV index in 30 days before illness onset and US geoclimatic regions at illness onset were as defined in prior study [13] based on National Oceanic and Atmospheric Administration (NOAA) definitions and data. US geoclimatic zones defined by NOAA at https://www.ncdc.noaa.gov/monitoring-references/maps/us-climate-regions.php, (ftp://ftp.cpc.ncep.noaa.gov/long/uv/cities). ALT: alanine aminotransferase; AST: aspartate aminotransferase; ARS: aminoacyl-transfer RNA synthetase; CK: creatine kinase; GI: gastrointestinal; HMGCR: 3-hydroxy-3-methyl-glutaryl-coenzyme A reductase; IQR: interquartile range; i.v.: intravenous; LDH: lactate dehydrogenase; MAAs: myositis associated autoantibodies; MDA5: melanoma differentiation-associated protein 5; MSAs: myositis specific autoantibodies; NXP2: nuclear matrix protein 2; TIF1: transcriptional intermediary factor 1; UV: ultraviolet.
Results
Patient characteristics and their medications received are shown in Table 1. Patients had 42.5 months median follow-up from diagnosis. Of the MSAs, 38.5% had anti-p155/140 (TIF1), 28% had anti-MJ (NXP2) and 8.2% had anti-MDA5 autoantibodies. The prevalence of symptoms was similar in patients with shorter and longer follow-up (data not shown), except for calcinosis and lipodystrophy, which were more prevalent in patients with longer follow-up (greater than the median of 42 months), thus excluding these variables from examination as predictors of the outcomes. Ninety-nine per cent received oral prednisone, 70% methotrexate, 56% intravenous methylprednisolone, 38% IVIG and 20% other disease-modifying anti-rheumatic drugs (Table 1).
One hundred and ninety-one of the 307 patients (62.2%) achieved at least one of the outcomes among final corticosteroid discontinuation, complete clinical response and remission, ever during observation. Fifty-six per cent of patients discontinued corticosteroid treatment, 38% achieved complete clinical response and 30% achieved remission by 60 months from the start of treatment using Weibull modelling (Table 2). Ninety-nine patients (32.2%) achieved complete clinical response and 49 patients (49.5%) achieved remission after complete clinical response, whereas 31 patients (10.1%) achieved remission directly without complete clinical response first. One hundred and seventy-seven patients (57.7%) did not achieve complete clinical response or remission, remaining active at a median of 42 months at last follow-up. The proportion of patients achieving each of these outcomes at specified times showed similar trends in the Weibull distribution as the observational probability by Kaplan–Meier survival analysis (Table 3). Time to 50% probability of achieving corticosteroid discontinuation, complete clinical response and remission was 51, 82 and 92 months by Weibull distribution, respectively. We estimated the time to corticosteroid discontinuation at 86 months after treatment initiation, similar to the observation period of a Canadian longitudinal cohort [28], and found 74% achieved corticosteroid discontinuation.
The probability of achieving final corticosteroid discontinuation, complete clinical response and remission at specific time points after treatment initiation by Weibull distribution for 307 patients with JDM
| Time point, months | Total number of patients available, n (%) | Final corticosteroid discontinuation, % | Complete clinical response, % | Remission, % |
|---|---|---|---|---|
| 12 | 278 (90.6) | 9.6 | 7.0 | 3.3 |
| 24 | 222 (72.3) | 21.9 | 15.1 | 8.9 |
| 36 | 177 (57.6) | 34.2 | 23.1 | 15.6 |
| 48 | 135 (44.0) | 45.6 | 30.6 | 22.8 |
| 60 | 105 (34.2) | 55.6 | 37.7 | 30.2 |
Data are reported out to 60 months, due to large number of patients lost to follow-up after that time.
The probability of achieving final corticosteroid discontinuation, complete clinical response and remission at specific time points after treatment initiation by Kaplan–Meier survival analysis for 307 patients with JDM
| Time point, months | Total number of patients available, n (%) | Final corticosteroid discontinuation, % | Complete clinical response, % | Remission, % |
|---|---|---|---|---|
| 12 | 278 (90.6) | 6.1 | 4.8 | 1.0 |
| 24 | 222 (72.3) | 22.9 | 21.2 | 7.2 |
| 36 | 177 (57.6) | 42.2 | 27.6 | 23.2 |
| 48 | 135 (44.0) | 51.6 | 34.6 | 32.0 |
| 60 | 105 (34.2) | 58.1 | 38.7 | 38.3 |
Data are reported out to 60 months, due to large number of patients lost to follow-up after that time.
By Bayesian network analysis, complete clinical response is dependent upon corticosteroid discontinuation: the probability of attaining first complete clinical response, given final corticosteroid discontinuation, was 47%, whereas when corticosteroid discontinuation was not attained, the probability of achieving complete clinical response was 18% (Fig. 1). This analysis also demonstrated an association between final corticosteroid discontinuation and first complete clinical response with first remission. When both corticosteroid discontinuation and complete clinical response were achieved, the probability of achieving remission was 66%. When neither corticosteroid discontinuation nor complete clinical response was achieved, the probability of achieving first remission was 3.5%. If either corticosteroid discontinuation or complete clinical response was achieved, the probability of achieving remission was intermediate between these values (Fig. 1).
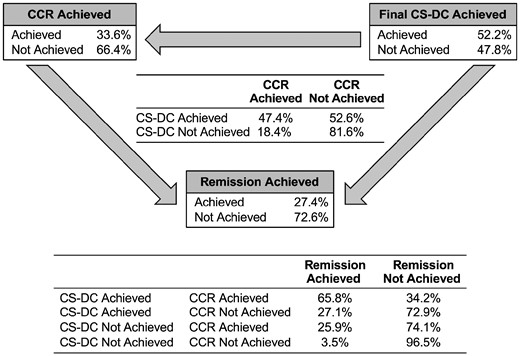
Conditional probability of achievement of complete clinical response and remission of 307 patients with JDM by Bayesian network analysis
As demonstrated in the diagram by arrows, the direction of the relationships among the three nodes defines the conditionality of the model. Note that we assumed that the probability that complete clinical response (CCR) is achieved (or not) is conditional on final corticosteroid discontinuation (CS-DC) being achieved (or not). The conditional linkages among the three nodes form the Bayes networks. Here, all the nodes are linked based on the assumed causal relationships shown in the diagram. For each node, the conditional probability table (CPT) is defined.
We evaluated factors associated with the time to achieve each outcome (Table 4). In univariable analysis, anti-NXP2 autoantibodies and a Northwest residential geoclimatic zone were associated with a shorter time to complete clinical response and remission, while cutaneous ulcers were associated with a shorter time to remission. Several variables were associated with longer times to achieve all three outcomes: the presence of any MSA along with a MAA, symptoms of dysphonia and photosensitivity, as well as a medication escalation within 12, 18 or 24 months after treatment initiation. A time to corticosteroid discontinuation greater than the median was associated with longer time to complete clinical response and remission. A longer time to complete clinical response was associated with longer time to corticosteroid discontinuation and remission, and a longer time to remission was associated with longer time to corticosteroid discontinuation and complete clinical response. Joint contractures and the presence of a MAA were associated with longer times to corticosteroid discontinuation and complete clinical response. Anti-TIF1 autoantibodies, dysphagia, as well as pulmonary, cardiac and/or gastrointestinal symptoms were associated with longer times to corticosteroid discontinuation and remission. An infection within 6 months of illness onset, notably of respiratory origin, and a Southeast residential geoclimatic zone were associated with longer times to corticosteroid discontinuation and remission. The Northeast residential zone and an immunization within 6 months of illness onset were associated with longer times to complete clinical response. Weight loss, higher serum aldolase, a history of hospitalization and wheelchair use were predictors of longer times to remission.
Univariable predictors of time to final corticosteroid discontinuation, complete clinical response and remission by Weibull modelling
| Variable | Time to corticosteroid discontinuation, median (90% CL), months | Time to complete clinical response, median (90% CL), months | Time to remission, median (90% CL), months | |
|---|---|---|---|---|
| Variables associated with shorter time to outcomes | ||||
| South residential geoclimatic zone | Present | 30 (24,39) | ||
| Absent | 58 (52,66) | |||
| Anti-MJ (NXP2) autoantibodies | Present | 68 (53,87) | ||
| Absent | 97 (81,120) | |||
| Northwest residential geoclimatic zone | Present | 41 (31,57) | 61 (49,79) | |
| Absent | 95 (80,115) | 104 (90,124) | ||
| Cutaneous ulcer | Present | 44 (31,65) | ||
| Absent | 100 (88,116) | |||
| Variables associated with longer time to outcomes | ||||
| Any MSA and any MAA | Present | 116 (75,200) | 198 (107,289) | 200 (120,280) |
| Absent | 51 (46,57) | 82(71,96) | 90 (80, 103) | |
| Dysphonia | Present | 70 (57,87) | 145 (106,200) | 163 (122,197) |
| Absent | 49 (43,56) | 72 (62,86) | 80 (71,93) | |
| Photosensitivity | Present | 71 (60,83) | 110 (90,142) | 117 (99,144) |
| Absent | 44 (38,51) | 69 (58,86) | 78 (67,94) | |
| Medication escalation within 24 months after initial treatmenta | Present | 70 (60,84) | 125 (99,163) | 145 (117,188) |
| Absent | 44 (38,51) | 64 (54,77) | 72 (63,84) | |
| Greater than median time to corticosteroid discontinuationb | Present | 109 (91,131) | 127 (110,149) | |
| Absent | 55 (46,69) | 52 (46,60) | ||
| Greater than median time to complete clinical responseb | Present | 67 (59,76) | 122 (107,144) | |
| Absent | 37 (32,43) | 49 (42, 57) | ||
| Greater than median time to remissionb | Present | 68 (60,77) | 97 (81,116) | |
| Absent | 34 (29,40) | 63 (51,83) | ||
| Joint contracture | Present | 63 (54,72) | 103 (85,131) | |
| Absent | 45 (39,53) | 69 (56,87) | ||
| Any MAA | Present | 90 (63,136) | 177 (108,246) | |
| Absent | 51 (45,56) | 79 (68,93) | ||
| Anti-p155/140(TIF1) autoantibodies | Present | 74 (62,88) | 121 (100,151) | |
| Absent | 45 (40,51) | 82 (71,96) | ||
| Dysphagia | Present | 70 (59,86) | 145 (113,197) | |
| Absent | 47 (42,54) | 79 (69,92) | ||
| Any pulmonary or cardiac signs/symptoms | Present | 67 (56,80) | 128 (104,161) | |
| Absent | 47 (42,54) | 78 (68,91) | ||
| GI, pulmonary or cardiac signs/symptoms | Present | 63 (56,72) | 115 (99,137) | |
| Absent | 36 (30,44) | 57 (47,70) | ||
| Respiratory infection within 6 months of illness onset | Present | 83 (62,116) | 163 (110,216) | |
| Absent | 51 (45,57) | 88 (78,103) | ||
| Any infection within 6 months of illness onset | Present | 81 (64,107) | 156 (115,197) | |
| Absent | 49 (44,55) | 84 (74,97) | ||
| Southeast residential geoclimatic zone | Present | 83 (62,118) | 167 (112,224) | |
| Absent | 50 (45,56) | 86 (76,100) | ||
| Northeast residential geoclimatic zone | Present | 122 (87,177) | ||
| Absent | 74 (63,89) | |||
| Immunization within 6 months of illness onset | Present | 200 (119,200) | ||
| Absent | 79 (68,93) | |||
| Weight loss | Present | 131 (103,175) | ||
| Absent | 84 (73,97) | |||
| Highest aldolase > 11.7 U/l | Present | 125 (101,160) | ||
| Absent | 76 (66,91) | |||
| History of hospitalization | Present | 126 (102,161) | ||
| Absent | 77 (66,92) | |||
| History of wheelchair use | Present | 165 (113,217) | ||
| Absent | 89 (78,102) | |||
The values provided in the table represent the expected time in months when final corticosteroid discontinuation, first complete clinical response, or first remission will be achieved. The expected time is defined as the month with a 50% chance of occurrence (i.e. the month where the end point will be achieved for the average patient). The 10% and 90% credible intervals are also provided in parentheses. Medication escalation within 12 or 18 months after initial treatment was similarly associated with longer times to corticosteroid discontinuation, complete clinical response and remission (data not shown). bTime to corticosteroid discontinuation, complete clinical response, and remission are based on observed patient information (Table 3), and are not model based. CL: credible limit; GI: Gastrointestinal; MAA: myositis-associated autoantibodies; MSA: myositis-specific autoantibodies.
Other variables, including race, gender, age, illness severity at onset, delay to diagnosis, other geoclimatic regions, gastrointestinal infection, ultraviolet light index based on the residential location prior to diagnosis, highest serum creatine kinase or other serum muscle enzyme (ALT, LDH) values, antinuclear antibodies, anti-MDA5 autoantibodies, total or organ-specific sign/symptom scores at diagnosis, interstitial lung disease, arthritis, distal weakness, number of hospitalizations or use of devices, were not associated with the times to achieve any of the three outcomes. In multivariable modelling (Table 5), median time to complete clinical response was the strongest predictor of time to final corticosteroid discontinuation, while photosensitivity and joint contractures were also predictors. The Northwest geoclimatic residential zone and anti-NXP2 autoantibodies were associated with shorter time to complete clinical response, while dysphonia, median time to corticosteroid discontinuation, medication escalation within 24 months after initial treatment and joint contractures were associated with a longer time to complete clinical response. For remission, median time to corticosteroid discontinuation or complete clinical response, medication escalation within 12–24 months of treatment initiation and anti-p155/140 (TIF1) autoantibodies were associated with longer time to remission.
Markov chain Monte Carlo multivariable Weibull models of time to achieve final corticosteroid discontinuation, complete clinical response and remission
| Variable | Estimate (95% CI) |
|---|---|
| Time to final corticosteroid discontinuation (n = 276) | |
| Intercept | 3.58 (3.34, 3.80) |
| Greater than median time to complete clinical response | 0.70 (0.62, 0.78) |
| Photosensitivity | 0.35 (0.12, 0.58) |
| Joint contracture | 0.29 (0.07, 0.51) |
| Time to complete clinical response (n = 278) | |
| Intercept | 4.07 (3.75, 4.40) |
| Northwest residential geoclimatic zone | −0.73 (−1.12, −0.34) |
| Anti-MJ (NXP2) autoantibody positive | −0.51 (−0.83, −0.19) |
| Dysphonia | 0.60 (0.20, 1.00) |
| Greater than median time to corticosteroid discontinuation | 0.40 (0.08, 0.73) |
| Medication escalation within 24 months after initial treatment | 0.38 (0.04, 0.72) |
| Joint contracture | 0.37 (0.05, 0.69) |
| Time to remission (n = 301) | |
| Intercept | 3.65 (3.46, 3.85) |
| Greater than median time to complete clinical response | 0.63 (0.40, 0.86) |
| Greater than median time to corticosteroid discontinuation | 0.46 (0.22, 0.69) |
| Medication escalation within 24 months after initial treatmenta | 0.34 (0.10, 0.59) |
| Anti-p155/140 (TIF1) autoantibody positive | 0.20 (−0.03, 0.42) |
The higher absolute mean value indicates a stronger relative influence in the model. Mean values less than zero indicate a shorter time to achieve the outcome, and mean values greater than zero indicate a longer time to achieve the outcome. Only variables with parameter credible intervals that did not overlap zero were retained in the models. The multivariable models shown have the lowest deviance information criterion values.
aMedication escalation within 12 or 18 months after initial treatment was similarly associated with time to remission in the multivariable model, but not with time to complete clinical response (data not shown).
Discussion
We evaluated the frequency, timelines and factors associated with important positive outcomes in JDM patients, including final corticosteroid discontinuation, complete clinical response and remission, which have not been previously well documented. Long-term outcome studies in JDM have focused on poor outcomes, such as disease damage, chronic illness course, mortality and calcinosis [14, 21, 22, 27, 29, 31].
We reported that at least one favourable long-term outcome, among corticosteroid discontinuation, complete clinical response or remission, was obtained in 62% of JDM patients with a median observation period of 42 months. We found the median time to achieve final corticosteroid discontinuation was 51 months, 82 months for complete clinical response and 92 months for remission. Our estimated probability of 74% of patients achieving final corticosteroid discontinuation at 86 months after treatment initiation was slightly lower than, but comparable to, that observed in a national JDM cohort from Canada, in which 85% of patients had withdrawn corticosteroids at that follow-up duration [28]. In single-centre studies, the median observed time to remission was 38–56 months [7, 32], which was shorter than in our study. However, these observational studies do not provide a time-dependent analysis that adjusts for patient censoring. Also, given some patients in our studies had refractory disease with long follow-up times, they may have contributed towards increases in the times to these outcomes. Our study was retrospective, in which patients enrolled over several decades and received care in multiple centres, with variation among treating physicians [18, 33].
Considering patients’ strong interest in achieving inactive disease and discontinuing therapy, the outcomes of final corticosteroid discontinuation, complete clinical response and remission are particularly meaningful. Validated criteria for clinically inactive disease for JDM have been developed [34, 35]. However, they represent a single time point, not an extended period of time. Complete clinical response and remission have been defined as clinically inactive disease for at least six continuous months on or off all treatment, a timeframe that was determined through consensus of myositis experts to be clinically appropriate [6]. The duration that adequately represents clinically inactive disease in defining remission will require further evaluation.
We also showed that these three outcomes are interdependent and have a strong conditional probability, which has not previously been demonstrated, but is logical. From the Bayesian network analysis, which provides insight into the causal linkages among the three clinical outcomes, and the MCMC Weibull modelling, remission was strongly linked to the achievement of final corticosteroid discontinuation and complete clinical response. Complete clinical response was also strongly linked to corticosteroid discontinuation, in that a significant percentage of patients who did not achieve corticosteroid discontinuation also did not achieve complete clinical response. Using these modelling approaches, we were able to provide evidence for these concepts previously developed through consensus [5, 6].
We assessed the factors associated with the time to achieve each outcome. The only factors we identified that were associated with shorter times to achieve some of these outcomes included anti-NXP2 autoantibodies and a Northwest geoclimatic zone based on residential location at illness onset. Other factors were associated with longer times to achieve these outcomes, including certain illness features previously associated with more severe disease [9, 14, 21, 24, 31, 36], anti-TIF1 autoantibodies, medication escalation within 12–24 months from treatment start, as well as attainment of each outcome. We confirmed joint contractures to be associated with a lower likelihood of corticosteroid discontinuation or complete clinical response [37]. Previous reports also found prolonged skin rashes, male gender, more severe weakness, arthritis and anaemia as additional factors associated with a longer time or lower likelihood to achieve remission [7–9]. From the randomized trial of new-onset JDM patients who received prednisone alone or in combination with methotrexate or ciclosporin, responders within 2 months of treatment, older age at illness onset, and combination therapy of prednisone and methotrexate were good predictors of the achievement of clinical remission and prednisolone discontinuation [38].
We found geoclimatic zones based on residential location at illness onset and certain MSAs as novel factors that impact these outcomes. The association with geoclimatic zone may be related to a co-association with anti-TIF1 autoantibodies [15], environmental exposures that may differ by regions such as has been seen with ultraviolet radiation, vitamin D and outcomes of multiple sclerosis [39], due to geographic variations in access to health care and impact on outcomes [40]. It is also possibly not related to geoclimatic variables, but rather to centre effects or variation in treatment practices or reporting biases. Some MSAs (anti-NXP2) were associated with more favourable outcomes (shorter times to complete clinical response), while anti-TIF1 autoantibodies were strongly associated with a longer time to remission. These data contrast to the UK JDM registry, in which the likelihood of remaining on treatment is more strongly linked to muscle histopathology than the presence of MSAs [26]. We did not have access to muscle histopathology in this study, and the UK study examined the achievement of treatment discontinuation at a single point in time.
While anti-TIF1 autoantibodies were also predictive of a chronic illness course [14, 37, 41, 42], a chronic illness course and corticosteroid discontinuation, complete clinical response or remission appear to be distinct. A chronic course of illness has been associated with severe illness at onset, including a higher symptom burden and higher skin activity at diagnosis, residential ultraviolet light exposure at illness onset, delay to treatment and additional MSAs, but these factors were not predictors of corticosteroid discontinuation, complete clinical response or remission [14, 23].
We used Weibull modelling to estimate the time to achieve each outcome in this large North American JDM registry population, and found it to be comparable to Kaplan–Meier time-to-event analysis. However, the Kaplan–Meier method is limited in its ability to adjust survival for covariates, whereas Weibull survival models impose the assumption of exponential survival, but allow the expected variance of survival to change over time and adjust for censoring [43]. In this study, in which the number of patients and the follow-up duration are limited, theoretical survival curves (Weibull modelling) have more flexibility than cumulative survival (Kaplan–Meier), and use of this methodology enhanced our discovery of factors associated with these outcomes [43].
This study has some limitations, including the use of retrospective natural history data, without specific serial evaluation, and the diagnoses of JDM patients spanned three decades, over which time the treatment of JDM changed and may have therefore impacted some of the outcomes in this report. Small sample sizes also precluded evaluation of some MSAs, such as anti-Mi-2 and anti-synthetase autoantibodies. Calcinosis and lipodystrophy impact outcomes of JDM, and patients with longer follow-up had a higher prevalence of these features. Some patients who achieved the outcomes may not have developed calcinosis or lipodystrophy before they were lost to follow-up. Therefore, we excluded these from our analysis. Importantly, we did not evaluate the influence of therapies on these outcomes, because the treatment data are not controlled, are highly variable [18] and would require propensity score adjustment, which we plan to address in a future study.
We conclude that JDM patients achieve positive outcomes, including corticosteroid discontinuation, complete clinical response and remission, although timelines for these may be prolonged and fewer patients achieve complete clinical response or remission than corticosteroid discontinuation. These outcomes are inter-related and strong predictors of each other. Anti-NXP2 autoantibodies and a Northwest geoclimatic zone are associated with shorter times to complete clinical response, while certain clinical features, anti-TIF1 autoantibodies and escalation of medications are associated with longer times to achieve these outcomes. Future studies must examine such factors in considering the impact of treatment in the outcome of JDM patients.
Contributing authors are listed at the end of the manuscript.
Acknowledgements
We thank Drs Peter Grayson and Pravitt Gourh for critical reading of the manuscript. All authors were involved in drafting the article or revising it critically for important intellectual content, and all authors approved the final version of the article to be submitted. T.K., W.W.H., A.M.H., M.M.W. and L.G.R.: study conception and design. T.K., N.B., I.N.T. and L.G.R.: acquisition of data. T.K., W.W.H., A.M.H., M.M.W. and L.G.R.: analysis and interpretation of data.
Members of the Childhood Myositis Heterogeneity Study Group who participated in the current study: Bita Arabshahi, Lilliana Barillas, Kaleo Ede, Barbara Anne Eberhard, Terri H. Finkel, Robert C. Fuhlbrigge, Harry L. Gewanter, Ellen A. Goldmuntz, Beth Gottlieb, Hilary M. Haftel, William Hannan, Michael Henrickson, Anna Jansen, James Jarvis, Olcay Y. Jones, Ankur Kamdar, Ildy M. Katona, Yukiko Kimura, Bianca A. Lang, Carol B. Lindsley, Katherine L. Madson, Andrew L. Mammen, Gulnara Mamyrova, Frederick W. Miller, Stephen R. Mitchell, Kabita Nanda, Terrance O’Hanlon, Judyann C. Olson, Elif A. Oral, Lauren M. Pachman, Murray H. Passo, Maria D. Perez, Donald A. Person, Iago Pinal-Fernandez, Linda I. Ray, Robert M. Rennebohm, Rafael F. Rivas-Chacon, Tova Ronis, Adam Schiffenbauer, Bracha Shaham, David D. Sherry, Sangeeta H. Sule, Robert P. Sundel, Scott A. Vogelgesang, Carol A. Wallace, Patience H. White, Lan Wu, Richard M. Yeker and Lawrence S. Zemel.
Disclosure statement: I.T. is a consultant to the Oklahoma Medical Research Foundation Clinical Immunology Laboratory regarding myositis autoantibody testing.
Funding: This research was supported in part by the Intramural Research Program of the National Institute of Environmental Health Sciences (project ES 101074 and ES101081, T.K., N.B. and L.R.) and National Institute of Arthritis and Musculoskeletal and Skin Diseases (M.W.), National Institutes of Health, and a statistical support contract with Social & Scientific Systems, Inc. (HHSN273201600011C). T.K. was supported by a research fellowship of The Myositis Association and by Tokyo Women’s Medical University. N.B. received support through the Cure JM Foundation.

Comments