


Abstract
To compare the cytokines involved in the development of macrophage activation syndrome (MAS) in different background rheumatic diseases and to identify serum biomarkers for MAS diagnosis.
Serum neopterin, IL-6, IL-18 and soluble TNF receptor (sTNFR) type I (sTNFR-I) and type II (sTNFR-II) levels were determined using ELISA in 12 patients with SLE, including five with MAS; 12 patients with JDM, including four with MAS; 75 patients with Kawasaki disease (KD), including six with MAS; and 179 patients with systemic JIA (s-JIA), including 43 with MAS. These results were compared with the clinical features of MAS.
Serum neopterin, IL-18 and sTNFR-II levels were significantly higher during the MAS phase than during the active phase in patients with all diseases. Furthermore, serum sTNFR-I levels were significantly higher during the MAS phase than during the active phase in patients with SLE, KD and s-JIA. Receiver operating characteristic (ROC) curve analysis revealed that serum sTNFR-I levels for SLE, serum IL-18 levels for JDM, and serum sTNFR-II levels for KD and s-JIA had the highest areas under the ROC curve. Serum levels of these cytokines were significantly and positively correlated with serum ferritin levels.
Overproduction of IFN-γ, IL-18 and TNF-α might be closely related to the development of MAS. Serum levels of sTNFR-I for SLE, IL-18 for JDM, and sTNFR-II for KD and s-JIA might be useful diagnostic markers for the transition from active phase to MAS.
The overproduction of IFN-γ, IL-18 and TNF-α might be commonly related to MAS development.
Serum sTNFR-I/IL-18/sTNFR-II levels are useful for the diagnosis of MAS in SLE/JDM/KD and s-JIA.
Introduction
Macrophage activation syndrome (MAS) is a life-threatening complication of rheumatic diseases that is clinically characterized by fever, hepatosplenomegaly, lymphadenopathy, profound depression of all three blood-cell lines, altered liver function, intravascular coagulation and central nervous system dysfunction [1]. MAS is most often complicated in children with systemic JIA (s-JIA) and occurs in ∼10% of the patients with s-JIA [1, 2]. Furthermore, subclinical or occult MAS may occur in as many as 40% of the patients with s-JIA [2]. However, MAS has also been observed in patients with other rheumatic diseases [3–6]. The prevalence of MAS complicating SLE is 4–9% [4]. The estimated incidence of MAS associated with Kawasaki disease (KD) has been reported to be 1.1–1.9% [5, 6]. Furthermore, MAS occurs in JDM patients, although it is less common [7].
The hallmark of MAS is an uncontrolled immune response involving continual activation and expansion of T lymphocytes and macrophages, resulting in marked hypercytokinaemia [1]. Massive hypercytokinaemia is strongly associated with MAS pathogenesis; however, whether pathogenesis and the kinetics of cytokine release are common to or different in each rheumatic disease remains poorly understood.
MAS diagnosis is challenging as it may mimic the clinical features of the underlying disease or be confused with an infectious complication. It is essential to differentiate MAS from these conditions for selecting the appropriate therapeutic approach. However, there are currently no definitive serum biomarkers for establishing MAS diagnosis.
In this study, to clarify which cytokines are involved in MAS development in different background rheumatic diseases, serum cytokine levels were determined, including neopterin, IL-6, IL-18, and soluble TNF (sTNFR) types I and II, in patients with MAS associated with SLE, JDM, KD and s-JIA, and their serum cytokine profiles were compared. Furthermore, to identify promising serum biomarkers for MAS diagnosis, we compared the accuracy of serum biomarkers for MAS diagnosis in patients with each disease.
Methods
Patients and samples
Serum neopterin, IL-18, IL-6, and sTNFR-I and II levels were determined in 13 SLE patients, including five with MAS; in 12 JDM patients, including four with MAS; in 75 KD patients, including six with MAS; and in 179 s-JIA patients, including 43 with MAS. This study used data on the levels of serum sTNFR-II from eight patients with SLE, including four with MAS, and serum neopterin, IL-18, IL-6, and sTNFR-I and II levels from 63 KD patients and 121 s-JIA patients in previous studies [8–10]. The clinical characteristics of MAS patients are shown in Table 1, and the clinical characteristics of the patients with each disease in the acute and MAS phases are presented in Supplementary Tables S1–S4, available at Rheumatology online.
Clinical characteristics of the patients with macrophage activation syndrome
| Characteristic | SLE (n = 5) | JDM (n = 4) | KD (n = 6) | s-JIA (n = 43) |
|---|---|---|---|---|
| Age at disease onset, median (range), years | 15 (5–15) | 7 (4–11) | 6 (1–12) | 4 (0–15) |
| Sex, male/female, n | 0/5 | 1/3 | 5/1 | 15/28 |
| Clinical symptoms, n (%) | ||||
| Fever | 5 (100) | 4 (100) | 5 (83) | 39 (100) |
| Rash | 2 (40) | 1 (25) | 3 (50) | 24 (62) |
| Lymphadenopathy | 0 (0) | 0 (0) | 3 (50) | 11 (28) |
| Hepatomegaly | 0 (0) | 0 (0) | 0 (0) | 6 (16) |
| Splenomegaly | 0 (0) | 0 (0) | 0 (0) | 4 (11) |
| Serositis | 2 (40) | 0 (0) | 0 (0) | 3 (9) |
| CNS disease | 0 (0) | 0 (0) | 1 (17) | 0 (0) |
| Bleeding | 0 (0) | 0 (0) | 0 (0) | 0 (0) |
| Laboratory findings, median (range) | ||||
| Platelets, ×109/l | 58 | 180 | 118 | 125 |
| (12.8–103) | (91–275) | (91–262) | (50–276) | |
| Ferritin, ng/ml | 5766 | 1579 | 4394 | 8146.2 |
| (328–28 212) | (1326.4–8062) | (524–21 231) | (729.6–68 310) | |
| AST, IU/l | 149 | 62 | 159 | 166 |
| (51–338) | (40–1154) | (57–1152) | (39–2211) | |
| Fibrinogen, mg/dl | 175 | 447 | 179 | 259.5 |
| (81–281) | (420–511) | (113–356) | (77–465) | |
| TG, mg/dl | 212 | 116 | 94 | 158 |
| (203–255) | (94–118) | (63–133) | (81–563) | |
| Treatment, n | ||||
| Predonisolone | 1 | 2 | 2 | 21 |
| Dexamethasone | 1 | 0 | 1 | 0 |
| Cyclosporine | 1 | 0 | 0 | 6 |
KD: Kawasaki disease; s-JIA: systemic JIA; AST: aspartate aminotransferase; TG: triglyceride
SLE was diagnosed according to the American College of Rheumatology criteria [11]. JDM was diagnosed according to Bohan and Peter [12]. KD patients fulfilled classic clinical criteria [13] and s-JIA was diagnosed based on the criteria established by the International League of Associations for Rheumatology [14]. MAS diagnosis was based on Ravelli’s criteria for s-JIA [15], Parodi’s criteria for SLE [16], and each physician’s judgement for KD and JDM. All patients with MAS complicating JDM or KD presented high fever with extremely elevated levels of serum ferritin and thrombocytopenia and/or elevated levels of transaminases. These patients were treated with corticosteroid and cyclosporine soon after the diagnosis of MAS. Serum samples were obtained from each patient at the active or MAS phase. All samples in active phase were obtained at the time of diagnosis or disease flare when the patients had clinical symptoms including fever. All samples in MAS phase were obtained at the diagnosis of MAS. Serum was separated from the cells, divided into aliquots, frozen and stored at −80°C until analysis. This study was approved by the Institutional Review Board of Kanazawa University, and all participants provided written informed consent.
Measurement of serum cytokine levels
Serum neopterin, IL-6, IL-18, sTNFR-I and sTNFR-II levels were determined using ELISA according to the manufacturer’s instructions (neopterin: IBL, Hamburg, Germany; IL-18: MBL, Nagoya, Japan; IL-6, sTNFR-I and sTNFR-II: R&D Systems, Minneapolis, MN, USA).
Neopterin is produced by activated monocytes/macrophages from guanosine triphosphate (GTP) via GTP cyclohydrolase I [17]. Its activity is greatly enhanced by IFN-γ, which is the most potent inducer of neopterin production [17]. Measuring neopterin levels is advantageous over measuring IFN-γ levels because IFN-γ quickly binds to target structures or is neutralized by soluble receptors; conversely, neopterin is biochemically inert and stable in serum [18]. Therefore, we measured serum neopterin levels instead of IFN-γ.
Measuring sTNFR-I and II has some advantages over measuring TNF-α. TNF-α is rapidly cleared from the circulation and is frequently undetectable; however, sTNFR-I and II are very stable in stored serum [19]. Furthermore, serum sTNFR-I and II levels correlate well with those of TNF-α [20, 21]. Therefore, we measured serum sTNFR-I and II levels instead of TNF-α levels.
Statistical analysis
Statistical analysis was performed using GraphPad Prism 7 software (GraphPad Software, San Diego, CA, USA). Data were summarized as median and range. Comparisons between several groups were performed using one-way analysis of variance with Tukey’s multiple comparison test. Within-group comparisons were performed using the Mann–Whitney U-test. Correlations were expressed using Spearman’s rank correlation coefficient. P < 0.05 denoted statistical significance.
Results
Serum cytokine levels in patients with MAS in different background rheumatic diseases
Serum neopterin levels at the time of MAS diagnosis were commonly and significantly higher in patients with SLE [median (range): 70 (30–220) nmol/l)], JDM [41.3 (39–47) nmol/l], KD [45.8 (29–72) nmol/l] and s-JIA [56 (13.3–240) nmol/l] than in those with active-phase SLE [19 (7.7–60.5) nmol/l; P< 0.05], JDM [11.5 (3.8–40) nmol/l; P < 0.05], KD [17.1 (3.8–71) nmol/l; P < 0.001] and s-JIA [12.6 (1.6–78) nmol/l; P < 0.001] (Fig. 1A).
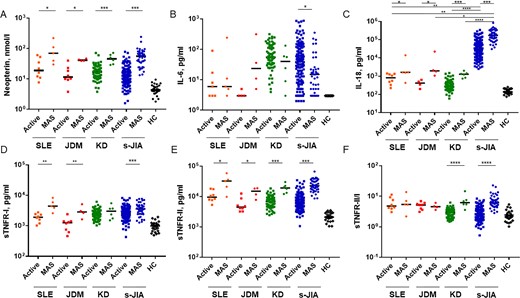
Comparison of serum cytokine levels in patients with macrophage activation syndrome in different rheumatic diseases
(A) Neopterin, (B) IL-6, (C) IL-18, (D) sTNFR-I, (E) sTNFR-II and (F) sTNFR-II/I ratio. The bars represent median values. The detection limit of the ELISA for neopterin, IL-18, IL-6, sTNFR-I and sTNFR-II were 3.7 nmol/l, 12.5 pg/ml, 3 pg/ml, 7.8 pg/ml, 7.8 pg/ml, respectively. Statistically significant differences between each patient group are shown as *P < 0.05, **P < 0.01, ***P < 0.001. Active, active phase; HC: healthy controls; KD: Kawasaki disease; MAS: macrophage activation syndrome; s-JIA: systemic JIA; sTNFR: soluble tumour necrosis factor receptor.
Serum IL-6 levels during MAS diagnosis were significantly lower in patients with s-JIA [15 (3–352) pg/ml] than in those with active-phase s-JIA [39.5 (3–870) pg/ml; P < 0.05; Fig. 1B]. In contrast, serum IL-6 levels during MAS diagnosis were significantly higher in patients with JDM [23.5 (5–313.7) pg/ml] than in those with active-phase of JDM [3 (3–5) pg/ml], although this was not statistically significant (Fig. 1B). There were no differences in serum IL-6 levels between the MAS and active phases in patients with SLE [MAS: 6 (3–242) pg/ml; active: 4.5 (3–90) pg/ml] and KD [MAS: 40 (3–132) pg/ml; active: 55 (4–316) pg/ml; Fig. 1B].
Serum IL-18 levels during MAS diagnosis were commonly and significantly higher in patients with SLE [1640 (430–14 100) pg/ml], JDM [1970 (1073–22 500) pg/ml], KD [1290 (740–2000) pg/ml] and s-JIA [172 000 (30 500–830 000) pg/ml] than in those with active-phase SLE [825, 225–1410) pg/ml; P < 0.05], JDM [425, 200–640) pg/ml; P < 0.05], KD [284 (60–1520) pg/ml; P < 0.001)] and s-JIA [31 150 (2510–340 000) pg/ml; P < 0.001; Fig. 1C]. Furthermore, serum IL-18 levels were significantly higher in patients with s-JIA in the MAS phase than in those with other diseases (SLE: P < 0.01; JDM: P < 0.05; KD: P < 0.0001) as well as in the active phase (SLE: P < 0.01; JDM: P = 0.0793; KD: P < 0.0001).
Serum sTNFR-I levels during MAS diagnosis were significantly higher in patients with SLE [4440 (2600–8300) pg/ml], JDM [2850 (1640–5100) pg/ml] and s-JIA [3600 (1280–7700) pg/ml] than in those with active-phase SLE [1910 (1020–2760) pg/ml; P < 0.01], JDM [1260 (460–2400) pg/ml; P < 0.01] and s-JIA [2500 (430–8250) pg/ml; P < 0.001; Fig. 1D]. There were no differences in serum sTNFR-I levels between the MAS and active phases in patients with KD [MAS: 3005 (1520–5500) pg/ml; active: 2425 (1030–6200) pg/ml; Fig. 1D].
During MAS diagnosis, serum sTNFR-II levels were commonly and significantly higher in patients with SLE [32 000 (9750–58 300) pg/ml], JDM [14 950 (7730–18 700) pg/ml], KD [18 950 (12 060–30 000) pg/ml] and s-JIA [22 500 (8600–66 300) pg/ml] than in those with active-phase SLE [9450 (5300–18 000) pg/ml; P < 0.05], JDM [4455 (3190–12 500) pg/ml; P < 0.05], KD [6800 (2430–18 400) pg/ml; (P < 0.001] and s-JIA [5850 (1060–34 300) pg/ml; P < 0.001; Fig. 1E].
Serum sTNFR-II/I ratios during MAS diagnosis were significantly higher in patients with KD [6.185 (3.57–14.67)] and s-JIA [6.125 (2.833–22.71)] than in those with active-phase KD [3.032 (1.469–6.216); P < 0.0001] and s-JIA [2.465 (0.5255–8.395); P < 0.0001; Fig. 1F]. In contrast, there were no differences in serum sTNFR-II/I ratios between the MAS and active phases in patients with SLE [MAS: 5.424 (2.196–13.77); active: 4.767 (3.043–11.25)] and JDM [MAS: 4.573 (3.569–6.111); active: 5.209 (3.106–6.935); Fig. 1F].
Comparison of serum biomarkers for the diagnosis of MAS in different background rheumatic diseases
As illustrated in Table 2, receiver operating characteristic (ROC) curve analysis to compare the accuracy of serum biomarkers for MAS diagnosis revealed that the cut-off value ratios of neopterin, IL-18, IL-6, sTNFR-I, sTNFR-II and sTNFR-II/I were 26.0 nmol/l, 1380 pg/ml, 4 pg/ml, 2510 pg/ml, 19 500 pg/ml and 5.277, respectively, for SLE; 31.0 nmol/l, 856.5 pg/ml, 4 pg/ml, 1530 pg/ml, 10 165 pg/ml and 4.961, respectively, for JDM; 28.6 nmol/l, 720 pg/ml, 61 pg/ml, 3635 pg/ml, 11 780 pg/ml and 5.196, respectively, for KD; and 23.8 nmol/l, 71500 pg/ml, 24 pg/ml, 3105 pg/ml, 14 000 pg/ml and 4.299, respectively, for s-JIA. The areas under the ROC curve values of neopterin, IL-18, IL-6, sTNFR-I, sTNFR-II and sTNFR-II/I ratios were 0.875, 0.850, 0.6125, 0.975, 0.900 and 0.575, respectively, for SLE (Table 2 and Fig. 2A); 0.938, 1.000, 0.9688, 0.9688, 0.906 and 0.5625, respectively, for JDM (Table 2 and Fig. 2B); 0.948, 0.962, 0.6643, 0.6095, 0.974 and 0.9857, respectively, for KD (Table 2 and Fig. 2C); and 0.937, 0.897, 0.6636, 0.6989, 0.956 and 0.9316, respectively, for s-JIA (Table 2 and Fig. 2D). From ROC curve analysis, the most useful candidate marker for predicting MAS development was serum sTNFR-I levels in SLE patients, serum IL-18 levels in JDM patients, sTNFR-II/I ratio in KD patients and serum sTNFR-II levels in s-JIA patients.
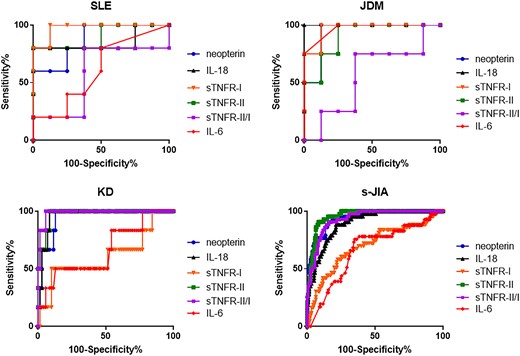
Receiver operating characteristic curves of serum cytokine levels
(A) SLE, (B) JDM, (C) Kawasaki disease and (D) systemic JIA. KD: Kawasaki disease; s-JIA: systemic JIA; sTNFR: soluble TNF receptor.
Receiver operating characteristic curve analysis of serum biomarkers for the diagnosis of macrophage activation syndrome
| SLE | JDM | KD | s-JIA | |||||
|---|---|---|---|---|---|---|---|---|
| AUC | Cut-off value | AUC | Cut-off value | AUC | Cut-off value | AUC | Cut-off value | |
| Neopterin, nmol/l | 0.875 | 26 | 0.938 | 31 | 0.948 | 28.6 | 0.937 | 23.8 |
| IL-18, pg/ml | 0.85 | 1380 | 1 | 856.5 | 0.962 | 720 | 0.897 | 71500 |
| IL-6, pg/ml | 0.6125 | 4 | 0.9688 | 4 | 0.6643 | 61 | 0.6636 | 24 |
| sTNFR-I, pg/ml | 0.975 | 2510 | 0.9688 | 1530 | 0.6095 | 3635 | 0.6989 | 3105 |
| sTNFR-II, pg/ml | 0.9 | 19 500 | 0.906 | 10 165 | 0.974 | 11 780 | 0.956 | 14000 |
| sTNFR-II/I | 0.575 | 5.277 | 0.5625 | 4.961 | 0.9857 | 5.196 | 0.9316 | 4.299 |
AUC: area under the receiver operating characteristic curve; KD: Kawasaki disease; s-JIA: systemic JIA; sTNFR: soluble TNF receptor.
Serum ferritin levels are clinically used as indicators of disease activity in MAS. Therefore, we assessed the correlation between serum cytokine levels and serum ferritin levels (Fig. 3; Supplementary Figs S1–S4, available at Rheumatology online). As shown in Fig. 3A, serum sTNFR-I levels were positively correlated with serum ferritin levels in patients with SLE (r = 0.6484, P < 0.0194). Serum IL-18 levels were also positively correlated with serum ferritin levels in patients with JDM (r = 0.8801, P = 0.0006; Fig. 3B). sTNFR-II/I ratio was not significantly correlated with serum ferritin levels in patients with KD (Supplementary Fig.S3, available at Rheumatology online). In contrast, serum sTNFR-II levels, which had the second highest areas under the ROC curve in patients with KD (Table 2), were positively correlated with serum ferritin levels in patients with KD (r = 0.3205, P < 0.05; Fig. 3C). Additionally, serum sTNFR-II levels were positively correlated with serum ferritin levels in patients with s-JIA (r = 0.6032, P < 0.0001; Fig. 3D).
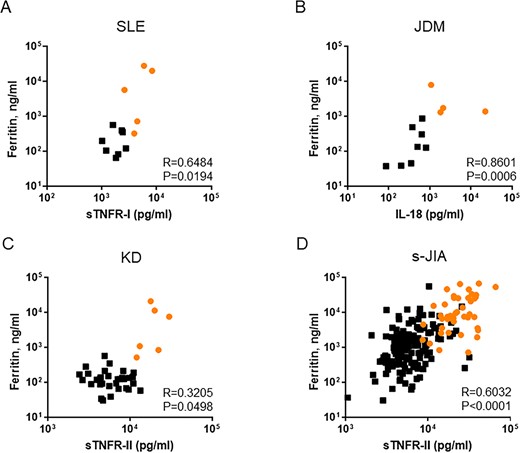
Correlation between serum ferritin levels and serum cytokine levels in each rheumatic disease
(A) SLE, (B) JDM, (C) Kawasaki disease and (D) systemic JIA. Orange circles indicate the values in the MAS phase. KD: Kawasaki disease; MAS: macrophage activation syndrome; s-JIA: systemic JIA; sTNFR: soluble TNF receptor.
Discussion
Massive hypercytokinaemia is a characteristic feature of MAS. Recent studies revealed that the overproduction of IFN-γ, IL-18 and TNF-α is closely associated with the pathogenesis of MAS complicating s-JIA [22–28]. However, the importance of these cytokines in the pathogenesis of MAS complicating other rheumatic diseases is unclear. The present study’s comparison of serum cytokine profiles in patients with MAS complicating SLE, JDM, KD and s-JIA revealed that serum neopterin, IL-18 and sTNFR-II levels were significantly higher in MAS than in the active phase of each disease, indicating that the overproduction of IFN-γ, IL-18 and TNF-α might be a common finding in the pathogenesis of MAS in different background rheumatic diseases.
IFN-γ plays a pivotal role in primary haemophagocytic lymphohistiocytosis (HLH) pathogenesis. High circulating IFN-γ levels are found in patients with primary HLH and infection-related secondary HLH [29–31]. High circulating IFN-γ levels are also observed in animal models of primary HLH [32]. Recent reports revealed that serum IFN-γ- and IFN-γ-induced chemokine levels are also markedly elevated; these levels are significantly correlated with disease activity in MAS complicating s-JIA and SLE [22, 23]. Furthermore, in a MAS animal model, serum ferritin levels were significantly correlated with CXCL9 mRNA levels in the liver and spleen [22]. In this study, serum neopterin levels were also significantly elevated in patients with JDM and KD. Altogether, these findings indicate that IFN-γ-mediated T cell–macrophage activation plays a pivotal role in MAS pathogenesis as well as in other HLH.
IL-18 has been described as an IFN-γ-inducing factor mainly produced by activated macrophage lineage cells [33, 34]. We previously reported that the serum IL-18 levels increased in active s-JIA [24, 25]. These levels increased further in patients with s-JIA-associated MAS [24, 25]. Furthermore, recent studies revealed that high free IL-18 levels (i.e. IL-18 not bound to IL-18 binding proteins) increased the risk of developing MAS [26, 27]. In this study, the significant elevation of serum IL-18 levels in MAS compared with the active phase was a common finding in each rheumatic disease. However, serum IL-18 levels were significantly elevated in patients with s-JIA compared with other rheumatic diseases. These results indicate that the role of IL-18 in the pathogenesis of MAS might be different in s-JIA from in other rheumatic diseases, although IL-18 overproduction might play an important role in the pathogenesis of MAS complicating various rheumatic diseases.
IL-18 has been shown to play a pathogenic role in dermatomyositis. Recent studies demonstrated elevated serum IL-18 levels in patients with myositis and IL-18 expression in the muscle tissues of myositis patients [35, 36]. Furthermore, serum IL-18 levels were increased and closely associated with severe complications, including fatal and rapidly progressive interstitial pneumonia in patients with JDM and adult dermatomyositis [35, 37]. Additionally, previous reports confirmed that serum IL-18 levels were significantly increased in MAS complicating JDM [7]. Consistent with this report, the current study demonstrated that serum IL-18 levels were significantly elevated in patients with MAS complicating JDM. From these findings, serum IL-18 levels might be useful markers for the disease activity of JDM and MAS.
TNF-α is another important cytokine for MAS pathogenesis [28, 38, 39]. In this study, serum sTNFR-I levels were significantly higher in the MAS phase than in the active phase in SLE, KD and s-JIA. Serum sTNFR-II levels were also significantly higher in the MAS phase than in the active phase not only in SLE, KD and s-JIA but also in patients with JDM. These findings suggest that TNF-α overproduction might play an important role in MAS pathogenesis.
In this study, ROC curve analysis revealed that serum sTNFR-I levels for SLE, and serum sTNFR-II levels for s-JIA had the highest areas under the ROC curve. Serum sTNFR-II levels for KD had the second highest areas under the ROC curve, which was almost equal to the highest value of sTNFR-II/I. Furthermore, serum levels of these cytokines were significantly and positively correlated with serum ferritin levels. From these findings, serum sTNFR-I levels for SLE, and sTNFR-II for KD and s-JIA might be useful diagnostic markers for transition from the active phase to MAS.
This study has some limitations. First, only a small sample size of SLE, JDM and KD patients was investigated. Second, it was limited by the use of a physician’s diagnosis for MAS due to the absence of a gold standard for the diagnosis of MAS complicating JDM and KD. Future studies with large sample sizes may help to define the true value of diagnostic markers.
In conclusion, IFN-γ, IL-18 and TNF-α overproduction might be closely related to MAS development. Serum sTNFR-I levels for SLE, IL-18 for JDM, and sTNFR-II for KD and s-JIA might be useful diagnostic markers for the transition from the active phase to MAS.
Acknowledgements
We thank Ms Harumi Matsukawa and Ms Mizue Mizuno for technical assistance.
Funding: This work was supported by the Japan Society for the Promotion of Science (JAPS) KAKENHI (18K07786 and 26461571).
Disclosure statement: The authors have declared no conflicts of interest.
Supplementary data
Supplementary data are available at Rheumatology online.

Comments