


Abstract
To examine all-cause and cardiovascular disease (CVD) mortality in consecutive cohorts of patients with incident RA, compared with population comparators.
The Oslo RA register inclusion criteria were diagnosis of RA (1987 ACR criteria) and residency in Oslo. Patients with disease onset 1994–2008 and 10 matched comparators for each case were linked to the Norwegian Cause of Death Registry. Hazard ratios for all-cause and CVD mortality were calculated for 5, 10, 15 and 20 years of observation using stratified cox-regression models. Mortality trends were estimated by multivariate cox-regression.
443, 479 and 469 cases with disease incidence in the periods 94–98, 99–03 and 04–08 were matched to 4430, 4790 and 4690 comparators, respectively. For cases diagnosed between 1994 and 2003, the all-cause mortality of cases diverged significantly from comparators after 10 years of disease duration [hazard ratio (95% CI) 94–98 cohort 1.42 (1.15–1.75): 99–03 cohort 1.37 (1.08–1.73)]. CVD related mortality was significantly increased after 5 years for the 94–98 cohort [hazard ratio (95% CI) 1.86 (1.16–2.98) and after 10 years for the 99–03 cohort 1.80 (1.20–2.70)]. Increased mortality was not observed in the 04–08 cohort where cases had significantly lower 10-year all-cause and CVD mortality compared with earlier cohorts.
All-cause and CVD mortality were significantly increased in RA patients diagnosed from 1994 to 2003, compared with matched comparators, but not in patients diagnosed after 2004. This may indicate that modern treatment strategies have a positive impact on mortality in patients with RA.
Patients diagnosed with RA in the period 1994–2003 had significantly increased mortality compared with controls.
Mortality was not significantly increased in patients diagnosed with RA in the period 2004–2008.
The risk of mortality for those diagnosed with RA before 2004 was increased throughout the observation period.
Introduction
RA is a chronic, systemic disease characterized by joint inflammation and in some cases, extra-articular manifestations. The mortality rate in patients with RA has in meta-analyses been estimated to be increased by 50–60%, compared with that of the general population [1, 2]. About 40% of the deaths in the cohorts included in the meta-analyses were due to cardiovascular disease (CVD), which was the most frequent cause of death [1]. Recent studies suggest that RA patients are still not benefitting fully from the declining mortality rate observed in the general population [3–5].
The RA treatment strategy has changed dramatically over the past two decades and the importance of early and intensive therapy and frequent assessments, in order to achieve a predefined treatment target and minimize joint damage, has become increasingly recognized [6–8]. The current EULAR recommendations for the treatment of early arthritis advocate rapid referral to a specialist, a minimum of 50% reduction in clinical disease activity after 3 months of treatment and a treatment goal of remission by 6 months [9]. These ambitious goals have been facilitated by the increased use of methotrexate and the introduction of TNF-α inhibitors from the turn of the century [10]. There is, however, a lack of knowledge concerning the effect of the change in treatment strategy on mortality.
The Oslo RA Register (ORAR) contains a large and representative cohort of individuals with RA [11]. Patients included in the register were treated according to the prevailing recommendations at the time of disease onset, and have thus been subjected to change in treatment practices during the longitudinal follow-up.
The objective of this matched case-cohort study was to examine the longitudinal trends in all-cause and CVD mortality in consecutive incidence cohorts of RA patients with disease onset between 1994 and 2008, compared with population comparators in the same geographical area.
Methods
The Oslo RA Register
The ORAR was established in 1994, the inclusion criteria were a diagnosis of RA according to the 1987 ACR criteria [12] and a residential address in Oslo, Norway [11]. The RA diagnosis was reviewed by a medical doctor at the time of inclusion in the register, which was at the end of each calendar year. Patients gave their written informed consent according to the Declaration of Helsinki prior to data collections. Patients who were deceased during the first year after RA diagnosis were therefore not included in the register for administrative reasons. Disease onset was defined as the year when patients fulfilled the classification criteria for RA [12], and patients were classified as seropositive if rheumatoid factor (IgM) and/or anti-citrullinated peptide antibody levels were above the normal range on routine testing. Over the study period, from 1994 to 2009, a total of 3489 patients were included in the ORAR. For the current analysis, patients were grouped into three incidence cohorts according to the time of disease onset: 94–98, 99–03, 04–08. The following patients were not included in the study: 162 patients had refused linkage with external registers, 62 patients did not have a specified date of disease onset and 23 patients could not be identified by a personal identification number. The ORAR and the linkage study were approved by the Norwegian Regional Committee for Medical and Health Research Ethics South East (reference numbers 267/93, 2009/1583).
Successive case-comparator cohorts
We identified 443 (94–98), 479 (99–03) and 469 (04–08) eligible cases for the three incidence cohorts. All adult inhabitants of Oslo in the years 1996, 2001 and 2006 (median year of disease onset in each incidence cohort) were identified by Statistics Norway. As cases were not registered in the ORAR if they were deceased during the first year after disease debut, we also excluded control subjects who were deceased within the first 12 months after registration. We then randomly selected 10 comparators for each case. Most cases (1002 of 1391, 72.0%) were matched at baseline with ten randomly chosen comparators of the same age in months, gender and area of residence. Cases who did not live in Oslo at the time of disease onset (98, 7.1%) were matched with comparators of the same gender, age in months, and with area of residence chosen at random. The remaining cases (291, 20.9%) were residents in Oslo at the time of disease onset, but a sufficient number of matched comparators could not be identified in the same area of residence. These cases were matched with randomly identified comparators of the same age, gender and from residential areas of similar socio-demographic characteristics. The socio-demographic profile of each borough of Oslo in 2008 is published by Statistics Norway. The profile is based on several parameters, including the number of inhabitants of each borough receiving social benefits [13].
Linkage to national registers
Cases and comparators were linked to the Norwegian Cause of Death Register (NCDR) and the National Database of Education (NDE) using individual unique personal identification numbers. Exclusion criteria were prior refusal to linkage of data with other registers, or lack of personal identification number. The survival period was calculated from 1 January in the year of disease debut and until the date of death. Data from the NCDR were available until the end of 2015 and therefore cases with a disease debut in the years 1997–8 and their matched controls were excluded from the analyses of 20-year follow-up for the 94–98 cohort. Similarly, cases with a disease debut in the years 2002–3, and their matched controls, were excluded from the analyses of 15-year follow-up and cases with at disease debut in the years 2007–8, and their matched controls were excluded from the analyses of 10-year follow-up.
Norwegian death certificates are filled out by the attending physician, and causes of death were classified using the International Classification of Diseases version 10 during the study period. According to the NCDR guidelines, the immediate cause of death should be listed first. Thereafter, the underlying cause of death or any external factors contributing to a mortal injury should be listed. Any conditions that may have contributed to death are listed subsequently according to declining importance.
Death from CVD was defined as a death where a diagnosis of coronary heart disease, cerebrovascular disease, peripheral vascular disease or heart failure was listed as the immediate, underlying or contributing cause of death. International Classification of Diseases version 10 codes used to identify CVD deaths are listed in Supplementary Table S1, available at Rheumatology online.
The NDE provided information concerning education (highest attained level) and residential area (current and past borough of residence).
Statistics
Baseline demographics were compared between incident RA cases and comparators in each cohort using χ2 tests or independent samples Student’s t test as appropriate. The number of deaths from all-causes and CVD were compared between cases and comparators over 5-year intervals of follow-up by χ2 tests. Kaplan–Meyer curves of survival were plotted for all-cause and CVD-mortality over at 10-year follow-up.
Matched case-comparator cox-regression
Cumulative all-cause and CVD mortality over 5, 10, 15 and 20 years of observation were determined in cox-regression models stratified by each matched case-comparator group, and adjusted for the highest attained level of education. All-cause mortality and death from CVD were the dependent variables in separate analyses.
Contemporary all-cause and CVD mortality in the period 2011–2015 for each incidence cohort was similarly estimated in stratified cox-regression models adjusted for education. For these analyses, each case who had survived up until the start of the observation period was matched to 10 surviving comparators.
Multivariate cox-regression analyses
Trends in mortality between cases in different incidence cohorts were explored in multivariate cox-regression analyses. All-cause and CVD mortality were the dependent variables in separate models. All models were adjusted for age and gender, and residential area, highest level of education and RF/ACPA status were entered successively into the models. Variables that were related to the outcome (P <0.10) were entered into the multivariate model, and removed successively until all remaining variables were significantly related to the outcome. Possible interactions between the variables were explored.
Results
The baseline demographics of the three incidence cohorts are presented in Table 1. The median age of the three cohorts ranged from 55.6–57.8 years. The percentage of females was also comparable between cohorts and ranged from 72–75%. The level of education in both cases and comparators was higher in the 04–08 cohort than in the earlier cohorts.
Baseline demography and mortality of cases vs comparators for three consecutive RA incidence cohorts
| Cohort | Incidence 1994–1998 | Incidence 1999–2003 | Incidence 2004–2008 | |||
|---|---|---|---|---|---|---|
| Cases | Comparators | Cases | Comparators | Cases | Comparators | |
| Number | 443 | 4430 | 479 | 4790 | 469 | 4690 |
| Age median (range) | 57.8 (18.2–80.8) | 57.8 (18.2–80.8) | 55.6 (18.1–80.8) | 55.6 (18.1–80.8) | 56.1 (18.2–80.9) | 56.1 (18.2–80.9) |
| Female gender n (%) | 325 (73.4) | 3250 (73.4) | 359 (75.0) | 3590 (75.0) | 336 (71.6) | 3360 (71.6) |
| Years of observation | 6225 | 73 035 | 5644 | 65 738 | 379 | 44 946 |
| Disease onset (median year) | 1997 | — | 2001 | — | 2006 | — |
| RF/ACPA pos n (%) | 188 (43.4) | — | — | — | 324 (69.5) | — |
| Higher education n (%) | 197 (44.5) | 1906 (43.0) | 238 (49.7) | 2452 (51.2) | 237 (50.5) | 2717 (57.9) |
| Deaths at 5 years n (%) | 40 (9.0) | 338 (7.6) | 30 (6.3) | 231 (4.8) | 25 (5.3) | 248 (4.1) |
| Deaths at 10 years n (%)a | 104 (23.5) | 772 (17.4)* | 82 (17.1) | 594 (12.4)* | 40 (12.7) | 536 (11.4) |
| Deaths at 15 years n (%)b | 157 (35.4) | 1243 (28.1)* | 86 (29.2) | 1012 (21.2)* | — | — |
| Deaths at 20 years n (%)c | 96 (44.7) | 1700 (38.4) | — | — | — | — |
| CVD deaths 5 years n (%) | 21 (4.7) | 115 (2.6)* | 8 (1.7) | 64 (1.3) | 6 (1.3) | 61 (1.3) |
| CVD deaths 10 years n (%)a | 41 (9.3) | 266 (6.0)* | 29 (6.1) | 160 (3.3)* | 9 (2.9) | 137 (2.9) |
| CVD deaths 15 years n (%)b | 59 (13.3) | 449 (10.1)* | 29 (9.8) | 285 (6.0)* | — | — |
| CVD deaths 20 years n (%)c | 44 (20.5) | 597 (13.5)* | — | — | — | — |
10 years follow-up for 2004–2008 cohort only available for 313 patients
15 years follow-up for 1999–2003 cohort only available for 185 patients.
20 year follow-up for 1994–1998 cohort only available for 186 patients.
*P<0.05.
CVD: cardiovascular disease; Higher education: College or university education.
All-cause mortality
For the 94–98 and 99–03 cohorts, there were a significantly higher number of deaths in cases compared with comparators after 10 years and more of disease duration (Table 1). Kaplan–Meyer curves for 10-year all-cause mortality for cases and comparators in each cohort are shown in Fig. 1. In stratified cox-regression analyses adjusted for education, the 10-year hazard ratio (HR) for all-cause mortality was significantly greater for cases compared with comparators for the 94–98 and 99–03 cohorts (Table 2). The estimates for the stratified adjusted models for 5, 10, 15 and 20 years of follow-up are presented in Fig. 3 and unadjusted and adjusted models are presented in Supplementary Table S2, available at Rheumatology online.
Predictors of ten-year all-cause and CVD mortality in cases
| Dependent variables | 10-year all-cause mortality | 10-year CVD mortality | ||
|---|---|---|---|---|
| Variables | Univariate models | Multivariate models | Univariate models | Multivariate models |
| HR (CI) | HR (CI) | HR (CI) | HR (CI) | |
| Age, years | 1.12 (1.10, 1.14)** | 1.11 (1.10, 1.13)** | 1.14 (1.11, 1.17)** | 1.14 (1.10, 1.17)** |
| Female vs male | 0.65 (0.50, 0.86)* | 0.59 (0.44, 0.79)** | 0.68 (0.49, 1.08) | 0.60 (0.37, 0.98)* |
| RF/ACPA positive | 0.96 (0.74, 1.25) | 0.86 (0.54, 1.35) | ||
| Level of education (high vs low) | 0.80 (0.70, 0.91)* | 0.81 (0.71, 0.92)* | 0.79 (0.63, 0.98)* | 0.80 (0.65, 0.1.00)* |
| Area of residence (non-affluent vs affluent) | 1.06 (0.94, 1.18) | 1.04 (0.86, 1.26) | ||
| Cohort comparison: | ||||
| 2001 vs 1996 | 0.85 (0.64, 1.14) | 0.86 (0.64, 1.15) | 0.79 (0.49, 1.27) | 0.80 (0.49, 1.28) |
| 2006 vs 1996 | 0.59 (0.41, 0.85)* | 0.61 (0.42, 0.88)* | 0.35 (0.17, 0.73)* | 0.36 (0.18, 0.75)* |
Adjusted and multivariate cox-regression models.
In univariate models, all variables were adjusted for age and gender.
Stratified analyses in cases and comparators matched for age, gender and borough of residence.
*P<0.05;
**P<0.001.
CVD: cardiovascular disease; HR: hazard ratio.
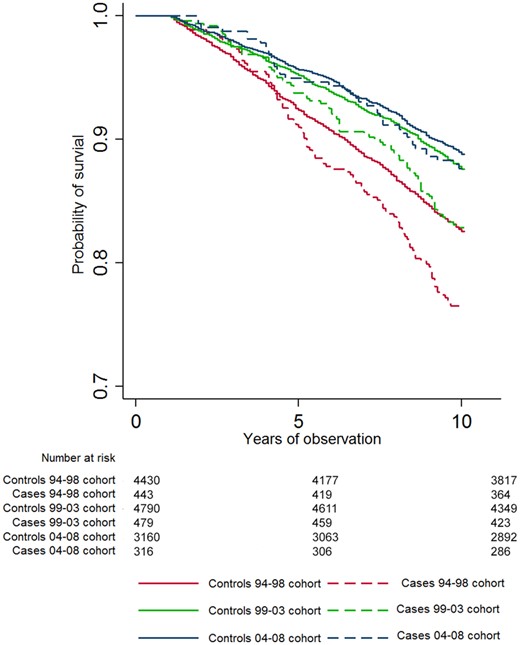
Kaplan–Meyer survival curves
All-cause mortality over 10 years.
CVD mortality
A significantly increased number of deaths were observed in cases compared with comparators after 5 years and more of disease duration for the 94–98 cohort, and after 10 years of disease duration for the 99–03 cohort (Table 1). Kaplan–Meyer curves of 10-year CVD mortality for cases and comparators in each cohort are shown in Fig. 2. In stratified cox-regression analyses adjusted for education, the 10-year HR for CVD mortality was significantly higher for cases compared with comparators for both the 94–98 and the 99–03 cohorts (Table 2).
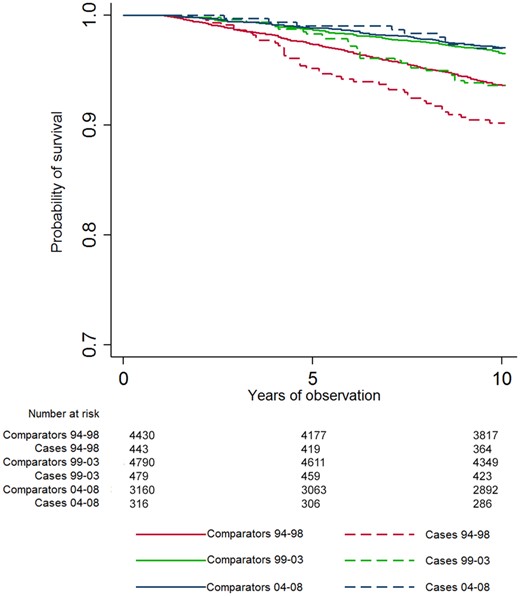
Kaplan–Meyer survival curves
CVD mortality over 10 years. CVD: cardiovascular disease.
The estimates of the stratified adjusted models for 5, 10, 15 and 20 years of follow-up are presented in Fig. 3, and unadjusted and adjusted models are presented in Supplementary Table S3, available at Rheumatology online.
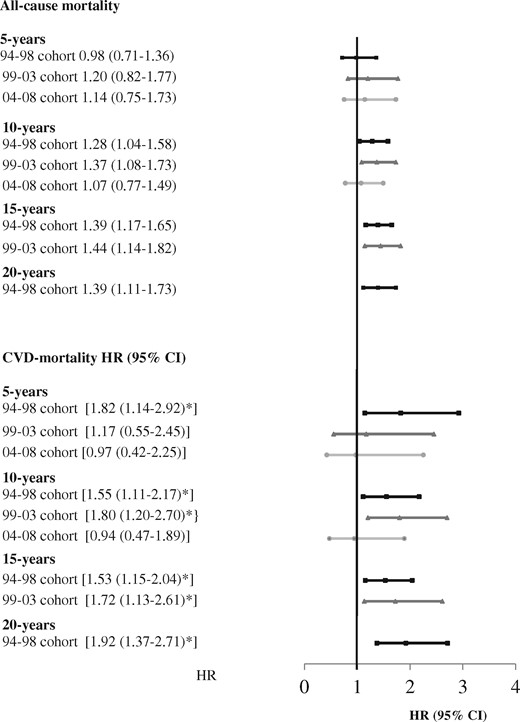
Mortality of cases vs comparators for three consecutive RA cohorts
Stratified analyses in cases and comparators matched for age, gender and borough of residence. Estimates are adjusted for highest attained level of education. HR: hazard ratio; 94–98 cohort: disease debut 1994–1998; 99–03 cohort: disease debut 1999–2003; 04–08 cohort: disease debut 2004–2008.
Contemporary mortality
In the analyses of 5-year survival in the period 2011–2015, there was a significantly increased risk of all-cause mortality and CVD mortality of cases, compared with comparators, for the 94–98 and 99–03 cohorts (Fig. 4). The mortality rate of cases diagnosed after 2004 was not significantly increased in this time period. The 5-year mortalities in the period 2011–2015 are presented in Supplementary Table S4, available at Rheumatology online.
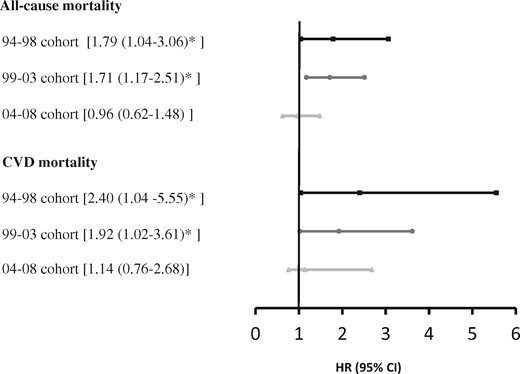
All-cause and CVD mortality for cases vs comparators in the period 2011–15
All-cause mortality of cases compared to comparators in the period 2011–2015 for three cohorts. Stratified analyses in cases and comparators matched for age, gender and borough of residence. Estimates are adjusted for highest attained level of education. CVD: cardiovascular disease; HR: hazard ratio; 94–98 cohort: disease debut 1994–1998; 99–03 cohort: disease debut 1999–2003; 04–08 cohort: disease debut 2004–2008.
Trends in mortality
Increasing age, male gender, low level of education, deprived area of residence and RA were predictors for increased 10-year all-cause and CVD mortality in the final multivariate cox regression analyses. All-cause and CVD mortality were significantly higher in the 94–98 cohort compared with the 04–08 cohort (Table 2).
Discussion
This matched case-cohort study demonstrates a significantly increased all-cause and CVD mortality in individuals diagnosed with RA in the period 1994–2003, compared with population comparators matched for age, gender and area of residence. All-cause and CVD mortality were not significantly increased over the 10-year follow-up in patients diagnosed after 2004. These results indicate that in the era of modern RA treatment, the disease may no longer entail an increased risk of mortality.
Disease activity is known to be a risk factor for mortality and CVD risk in RA patients [1, 14, 15], and from the start of this century, a more aggressive approach to the treatment of RA has been advocated, focusing on early DMARD treatment and defined treatment targets. The strategy was exemplified in the ARTIC trial [16], which gave a 53% rate of DAS sustained remission at 16–24 months [17]. Real-life register data have also indicated that the implementation of modern strategies results in more patients reaching remission at 6 months [10], and less frequent disease flares [18]. A Swedish register linkage study describes a comparable decline in mortality both for RA cases and comparators in successive incidence cohorts spanning from 1997 to 2015, but this group did not find a secular trend of declining HR for mortality over time [19]. Three groups working on data from the United Kingdom describe a decline in mortality in RA patients diagnosed in recent years and followed for a maximum of 8 years, but the mortality rates of patients remain significantly greater than that of the comparators [5, 20, 21]. In a Canadian study of incident cases of RA there was, however, no increased mortality, neither all-cause nor cause specific, for those diagnosed in the period 2001–2006 and followed for 5 years until December 2010, in contrast to patients diagnosed in the period 1996–2000 [22]. It is relevant to note that the mortality rate of the ORAR population significantly diverged from that of the comparators in the period between 5 and 10 years after disease onset. To our knowledge we are the first group to report on a normalization of the 10-year all-cause mortality in successive incidence cohort of RA patients. A study by Uhlig et al. [23] demonstrated that the longitudinal health status of patients included in the ORAR has improved in the period 1994–2004, and the authors suggest that early access to aggressive treatment is the likely explanation. The ORAR’s urban single-centre setting is a unique feature of this study, and one that differentiates it from studies recruiting from multiple rural and urban sites. In recent times the general practitioners in Oslo have increasingly been informed of the importance of early referral to the Department of Rheumatology and the referral process has been simplified to promote rapid access. Unfortunately, we do not have information regarding symptom duration prior to referral, but one may speculate that the urban location of our hospital has facilitated a close communication with primary health care services and an earlier referral of patients, in agreement with a treat-to-target strategy.
When comparing the HR for all-cause mortality between RA patients in consecutive incidence cohorts, we found that patients diagnosed after 2004 had significantly lower risk of death compared with those diagnosed in the period 1994–1998 in non-standardized analyses. Previously, no significant change in the excess mortality for patients with RA has been reported between 2001–2002 and 2014–2015 [24]. Also, a meta-analysis of eight longitudinal studies following patients from 1955 until 2007, with a mean patient follow-up of between 5.6 and 17.1 years, did not find a significant reduction in the standardized mortality rate over the period of observation [25].
A decline in the mortality from myocardial infarction in successive RA cohorts was reported already in 2004 [26], and has of course also been evident in the general population [27]. The decline has been confirmed in later studies [28, 29]. A systematic literature review and meta-analysis published in 2015 confirmed a reduced risk of CV events in patients with RA treated with TNF-α inhibitors and MTX, whereas use of corticosteroids and non-steroidal anti-inflammatory drugs increased the risk of CV events [30]. We found an increased mortality from CVD for the patients with incident disease in the period 1994–2003, but not in cases with disease onset later than 2004. Patients diagnosed between 2004 and 2008 also had significantly lower risk of CVD mortality, compared with patients diagnosed in the period 1994–1998. Interestingly, Aga et al. have reported that during the time-period of ORAR enrolment (94–09) there has been a significant reduction in disease duration prior to initiation of both MTX monotherapy and TNF-α inhibitors [10] in Norway. This study also found a decline in the proportion of patients using prednisolone as a co-medication to MTX after 6 months of disease duration. The change in treatment practice is in accordance with the updated treatment recommendations, which emphasize the importance of starting therapy with DMARDs immediately after diagnosing RA [9]. In parallel with the introduction of the intensified approach to treating RA, there has also been a national move to improve the management of CVD risk in patients with RA, also in accordance with EULAR recommendations [31].
In agreement with previous analyses from ORAR, ACPA status was not a significant predictor of mortality and there was no evidence of a RF/ACPA status being an effect modifier for trends in mortality [32]. Both RF and ACPA have been found to be predictors of mortality in other studies, but the findings have been inconsistent [1, 19].
Our study shows the importance of considering the current mortality of patients with RA separately for patients with recent disease onset and for those who have lived with RA for many years. Although our study finds that patients diagnosed after 2004 do not have a statistically increased risk either for all-cause or for CVD mortality, the mortality for patients diagnosed prior to 2004 remained higher in the period 2011–15 when modern treatment practices had been implemented. Although we were not able to adjust for the difference in disease duration between the cohorts, all patients included in the analyses did have a disease duration of more than five years.
The limitations of this study are the relatively small cohorts and the fact that we do not have information on baseline disease activity and use of medication. The study relies on linkage data from NCDR while an autopsy study of a Norwegian population has indicated an underreporting of ischaemic heart disease as an underlying cause of death [33]. All patients in the ORAR were diagnosed by a rheumatologist after referral and it is possible that patients who were suffering from other illnesses were not referred to the rheumatology department. We do however also acknowledge that patients who died within the first year after diagnosis were not registered in the ORAR for practical reasons.
The strengths of this study are the matched case-cohort design building on the consecutive inception of patients with RA in the ORAR at Diakonhjemmet Hospital, but the single-centre data-collection may also limit its generalizability. The unique national identification number of each patient has allowed linkage of the ORAR, NDE and NCDR. Cases and comparators were thus matched on area of residence at the time of disease onset, in addition to age and gender, and adjusted for education, and we believe that some of the major sources of potential bias have been accounted for in the main analyses.
In conclusion, RA patients with disease incidence in the period 1994–2003, but not 2004–2008 had increased all-cause and CVD related mortality after 10 years of disease duration, compared with the general population. The risk of mortality continues to be increased for patients with long-standing disease, but our findings may indicate that modern treatment strategies have a positive impact on all-cause and CVD mortality in patients with more recent disease onset.
Acknowledgements
S.A.P.: conceived the idea, performed data synthesis and data analyses and wrote the paper. S.L.: contributed to idea development, assisted in data analyses, contributed in writing the paper and approved the final version. J.S.: contributed to idea development, gave statistical support in the data analyses, contributed in writing the paper and approved the final version. C.A.: contributed to idea development, performed dataset synthesis, contributed in writing the paper and approved the final version. K.A.: contributed to idea development, defined CVD outcomes, contributed in writing the paper and approved the final version. E.A.H.: contributed to idea development, assisted in data analyses, contributed in writing the paper and approved the final version. T.K.K.: contributed to idea development, established the register, assisted in data analyses, contributed in writing the paper and approved the final version. T.U.: contributed to idea development, established the register, assisted in data analyses, contributed in writing the paper and approved the final version. Diakonhjemmet Hospital has a patient panel where patients with all inflammatory joint diseases are represented. The members of the panel are involved in the planning of studies and creation of patient registers.
Funding: The data collection in ORAR was supported in part by grants from the Research Council of Norway, the Lions Clubs International MD 104 Norway, the Norwegian Women's Public Health Association, the Trygve Gythfeldt, and Wife Legacy, the Grethe Harbitz Legacy, and the Marie and Else Mustad Legacy. S.A.P. was funded by the Norwegian Extra Foundation for Health and Rehabilitation through EXTRA funds.
Disclosure statement: S.A.P. reports personal fees from Lily, personal fees from Novartis, outside the submitted work. E.A.H. reports personal fees from Pfizer, personal fees from UCB, personal fees from Eli Lilly, personal fees from Celgene, personal fees from Janssen-Cilag, outside the submitted work. T.K.K. reports personal fees from Abbvie, personal fees from Biogen, personal fees from Celltrion, personal fees from Egis, personal fees from Eli Lilly, personal fees from Hospira, personal fees from MSD, personal fees from Mylan, personal fees from Novartis, personal fees from Oktal, personal fees from Orion Pharma, personal fees from Pfizer, personal fees from Roche, personal fees from Sandoz, personal fees from Sanofi, personal fees from UCB, outside the submitted work.
References
Statistics, Norway, 2010. www.ssb.no/hjulet/2008-10-17-04.html (June 2010, date last accessed).

Comments