


Abstract
Rho of Plant (ROP) GTPases function as molecular switches that control signaling processes essential for growth, development, and defense. However, their role in specialized metabolism is poorly understood. Previously, we demonstrated that inhibition of protein geranylgeranyl transferase (PGGT-I) negatively impacts the biosynthesis of monoterpene indole alkaloids (MIA) in Madagascar periwinkle (Catharanthus roseus), indicating the involvement of prenylated proteins in signaling. Here, we show through biochemical, molecular, and in planta approaches that specific geranylgeranylated ROPs modulate C. roseus MIA biosynthesis. Among the six C. roseus ROP GTPases (CrROPs), only CrROP3 and CrROP5, having a C-terminal CSIL motif, were specifically prenylated by PGGT-I. Additionally, their transcripts showed higher expression in most parts than other CrROPs. Protein–protein interaction studies revealed that CrROP3 and CrROP5, but not ΔCrROP3, ΔCrROP5, and CrROP2 lacking the CSIL motif, interacted with CrPGGT-I. Further, CrROP3 and CrROP5 exhibited nuclear localization, whereas CrROP2 was localized to the plasma membrane. In planta functional studies revealed that silencing of CrROP3 and CrROP5 negatively affected MIA biosynthesis, while their overexpression upregulated MIA formation. In contrast, silencing and overexpression of CrROP2 had no effect on MIA biosynthesis. Moreover, overexpression of ΔCrROP3 and ΔCrROP5 mutants devoid of sequence coding for the CSIL motif failed to enhance MIA biosynthesis. These results implicate that CrROP3 and CrROP5 have a positive regulatory role on MIA biosynthesis and thus shed light on how geranylgeranylated ROP GTPases mediate the modulation of specialized metabolism in C. roseus.
Introduction
Madagascar periwinkle (Catharanthus roseus) is a tropical plant of the Apocynaceae family, producing a large palette of specialized metabolites called monoterpene indole alkaloids (MIA). It is the best-characterized MIA-producing plant species, and some of the MIA produced by this plant have immense therapeutic value. For instance, ajmalicine and serpentine, mainly produced by the roots of C. roseus, are used in the treatment of hypertension and cardiovascular diseases (Kostin et al. 1986), and most importantly, heterodimer bisindole alkaloids vinblastine and vincristine mostly accumulated in leaves have been used as antineoplastic agents (Hodes et al. 1960; Cardinali et al. 1963). The formation of MIA in C. roseus leaves is a highly complex process involving more than 50 biosynthetic steps. These steps are distributed across various cell layers of the leaf and involve different pathway enzymes, transcription factors (TFs), intra-/intercellular signaling molecules, and transporters (Zhao et al. 2013) (Supplementary Fig. S1). The MIA biosynthesis in C. roseus is under the regulation of diverse TFs, which include Octadecanoid-Responsive Catharanthus AP-2 domain (ORCA; Menke 1999; Van Der Fits and Memelink 2001; Li et al. 2013 a, 2013b; Paul et al. 2017), basic helix-loop-helix (bHLH) factor (MYC2; Zhang et al. 2011), WRKY (Suttipanta et al. 2011), and bHLH iridoid synthesis (BIS; Van Moerkercke et al. 2015; 2016). In addition, MIA biosynthesis is also shown to be affected by mitogen-activated protein kinase (MPK3; Raina et al. 2013). Further, the expression of TFs and genes involved in MIA biosynthesis is induced upon exposure to methyl jasmonate (MeJA)—a phytohormone involved in defense against necrotrophs and herbivores (Aerts et al. 1994; Zhou and Memelink 2016). Though most of the pathway genes (PGs) and various transcriptional regulators involved in MIA biosynthesis have been functionally characterized, factors involved upstream of the jasmonate-mediated signaling cascade are yet to be identified.
It is a well-known phenomenon that when plants come in contact with elicitors, signaling cascades are activated, leading to the production of secondary metabolites (Zhao et al. 2005). As a primary response to elicitors, there must be a direct and swift signaling cascade that operates before the activation of gene transcription to regulate the biosynthesis of specialized metabolites (Huchelmann et al. 2014). Post-translational modifications (PTMs) of proteins play an important role in the activation of the signaling cascade and have been implicated in the regulation of a number of metabolic processes. PTMs of the proteins are catalyzed by the enzymatic reaction that covalently attaches small chemical groups such as phosphate (phosphorylation), methyl (methylation), acetyl (acetylation), and peptides like ubiquitin (ubiquitination). In addition, protein prenylation involving farnesylation and geranylgeranylation are also important PTMs in plants. While protein farnesylation involves the activity of protein farnesyltransferase (PFT) that catalyzes the transfer of a C15 farnesyl moiety to the Cys residue of a protein with a C-terminal CaaX motif (C = Cys; a = aliphatic; X = Met, Gln, Ala, Cys, or Ser), protein geranylgeranylation is carried out by protein geranylgeranyl transferase (PGGT-I), which transfers the C20 geranylgeranyl lipid moiety to the target proteins (Zhang and Casey 1996; Crowell 2000; Crowell and Huizinga 2009). This lipid modification plays a crucial role in activating the signaling cascade required for various plant processes, including abscisic acid (ABA) and auxin signaling (Johnson et al. 2005), and regulation of the cell cycle (Etienne-Manneville and Hall 2002). Besides, studies have indicated the involvement of protein geranylgeranylation in the regulation of specialized metabolism in some plants. In C. roseus cells, inhibition of protein geranylgeranylation negatively impacted some genes involved in the MIA pathway, resulting in reduced accumulation of ajmalicine (Courdavault et al. 2005, 2009; Simkin et al. 2013). Similarly, inhibition of geranylgeranylation by the monoterpene S-carvone or GGti-2133 (specific inhibitor of geranylgeranylation) suppressed cellulase-induced production of sesquiterpene phytoalexin capsidiol in tobacco (Nicotiana tabacum), implicating the involvement of geranylgeranylation in regulation of sesquiterpene biosynthesis (Huchelmann et al. 2014). In a recent study, we have demonstrated that the specific silencing and overexpression of CrPGGT-I_β or geranylgeranyl diphosphate synthase 2 (CrGGPPS2 that provides geranylgeranyl moiety to CrPGGT-I_β) in C. roseus leaves resulted in respective down- and upregulation of MIA biosynthesis, thus establishing the importance of geranylgeranylation in MIA formation (Kumar et al. 2020). All these above studies clearly indicate that geranylgeranylation of certain yet-to-be identified proteins might play a role in relaying downstream signals for the modulation of specialized metabolism. Binding proteins such as the Rho-of-plants (ROPs) family of proteins have been postulated to be involved in the activation of signaling, resulting in the modulation of specialized metabolism in tobacco (N. tabacum) and agarwood (Aquilaria microcarpa) (Huchelmann et al. 2014; Kurosaki and Taura 2015).
ROP proteins are small GTPases specific to plants that belong to the Rho subfamily of the Ras superfamily and show high similarity to the animal Rac (rat sarcoma (RAS)-related C3 botulinum toxin substrate) subfamily (Kawasaki et al. 1999; Winge et al. 2000). ROPs function as molecular switches due to changes in conformation upon GTP binding and hydrolysis (Nielsen 2020). The conformational differences between the GTP-bound (active) and GDP-bound (inactive) states facilitate transient interactions with the effector and regulatory protein (Berken and Wittinghofer 2008; Feiguelman et al. 2018). This dynamic cycling enables ROPs to relay intracellular and extracellular stimuli in a spatially regulated manner, which results in the regulation of intracellular responses. As a result, ROPs play crucial roles in cellular and developmental processes such as pollen tube growth (which is essential for fertilization), plant cell polarity, root hair development, and auxin signaling (which regulates plant growth and development) (Fig. 1) (Gu et al. 2006; Sorek et al. 2010; Wu et al. 2011). ROPs are also known to participate in defense responses against pathogens (Ma et al. 2017; Engelhardt et al. 2020). Although extensive research has been carried out to understand the role of ROP GTPases in different plant processes, as stated above, their exact roles concerning specialized metabolism remain largely unknown (Fig. 1). So far, there have been only a couple of reports that suggest the participation of ROPs in the modulation of plant specialized metabolism. It was shown that overexpression of licorice weed (Scoparia dulcis) ROP gene (Sdrac2) in belladonna (Atropa belladonna), a plant from the Solanaceae family, increased the accumulation of the specialized metabolite atropine, a tropane alkaloid (Asano et al. 2013). Similarly, overexpression of rac2 encoding a Rac GTPase in cell cultures of Agarwood (A. microcarpa) activated the transcription of a sesquiterpene synthase gene encoding δ-guaiene synthase (Kurosaki and Taura 2015). Nevertheless, these studies did not investigate the mechanism by which rac2 affects the specialized metabolism. Here, we investigated the role of ROPs in the regulation of MIA biosynthesis in the model medicinal plant C. roseus. Our comprehensive analysis of CrROPs through biochemical, molecular, and in planta approaches demonstrated that specific CrROPs (CrROP3 and CrROP5) having geranylgeranylation motif “CSIL” positively modulate MIA biosynthesis in C. roseus.
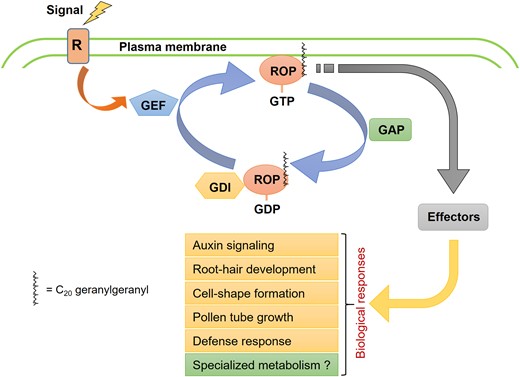
Schematic representation of the ROP GTPase-mediated signaling in plants. Receptors (R) on the cell membrane perceive signals and activate guanine-nucleotide exchange factor (GEF), which in turn, facilitates the activation of ROPs by exchanging GDP with GTP. The active GTP-bound and membrane-associated ROP then interacts with downstream effector proteins, eliciting biological responses. GTPase-activating protein (GAP) and guanine-nucleotide dissociation inhibitor (GDI) play roles in the inactivation of ROPs. GAP accelerates GTP hydrolysis, while GDI stabilizes the ROP in the GDP-bound state and sequesters the protein from the membrane.
Results
Identification of CrROPs and their relation to ROPs of other plants
To identify ROP candidates in C. roseus, a search was carried out in the MPGR database (http://medicinalplantgenomics.msu.edu/4058.shtml). In addition, a BLASTp search using ROPs from other plants was performed against the C. roseus assembled genome (Kellner et al. 2015; She et al. 2019). This combined search resulted in the identification of 40 sequences. Transcripts with very low Fragments Per Kilobase of transcript per Million (FPKM) mapped reads, short-length transcripts, and transcripts with Rab annotation were excluded, resulting in six full-length coding sequences similar to annotated plant ROPs. The first sequence, referred to as CrROP1, was represented by two contigs (cra_locus_1876_iso_6_len_1265_ver_3 & cra_locus_1876_iso_1_len_684_ver_3) with 100% sequence identity and was annotated as ROP small G protein and RAC GTPase, respectively. The sequence with complete open reading frame (ORF), i.e. ROP small G protein, was considered for further studies. The second sequence, named CrROP2, was represented by a single contig cra_locus_4716_iso_3_len_1153_ver_3 that was annotated as ROP protein. Similarly, the third sequence, named CrROP3, was represented by two contigs (cra_locus_1176_iso_3_len_1278_ver_3 & cra_locus_1176_iso_1_len_1098_ver_3) and were annotated as Rho protein. Further, the fourth, fifth, and sixth sequences referred to as CrROP4, CrROP5, and CrROP6 were each represented by a single contig cra_locus_10675_iso_2_len_885_ver_3, cra_locus_652_iso_1_len_1397_ver_3 and cra_locus_5636_iso_6_len_1224_ver_3, respectively. While CrROP4 was annotated as Rac-like GTP binding protein ARAC2, CrROP5 and CrROP6 were annotated as Rac-like GTP binding protein RAC2 and Rac GTPase, respectively. All CrROP genes have complex gene structures with multiple introns and showed uneven distribution on four of the eight chromosomes (Supplementary Fig. S2).
Phylogenetic analysis of CrROPs with other characterized ROPs revealed that they belong to four distinct groups (Fig. 2A). CrROP1 belongs to group-4 and shares a high sequence similarity with AmRac1, and also with AtROP10 and AtROP11, which have been shown to be involved in suppression of ABA signaling, secondary cell wall patterning, root hair growth, and inhibition of endocytosis (Xin et al. 2005; Choi et al. 2014; Feiguelman et al. 2018), CrROP2 belongs to group-3 and exhibited high sequence similarity to AtROP9, which is known to regulate ABA and auxin signaling, and migration of pollen nuclei (Nibau et al. 2013; Li et al. 2013a, 2013b; Choi et al. 2014). Whereas CrROP4 and CrROP6 clustered in group-2 together with AtROP7 and AtROP8, which have pivotal roles in vascular development and pollen nuclei movement (Kawashima et al. 2014; Wang et al. 2017). On the other hand, CrROP3 and CrROP5 were clustered under group-1, which also includes Arabidopsis (Arabidopsis thaliana) AtROP2, AtROP4, and AtROP6 that regulate root hair initiation, ROS production, phytochrome-mediated light responses, ABA signaling, and SA-mediated pathogen responses (Molendijk 2001; Jones et al. 2002; Poraty-Gavra et al. 2013; Feiguelman et al. 2018). Moreover, CrROP3 and CrROP5 clearly clustered together with AmRac2 and SdRac2, which positively affect δ-guaiene synthase expression and atropine accumulation, respectively, suggesting that the ROPs from this group could also be involved in the regulation of specialized metabolic pathways. Notably, group-1 also includes the sole ROP of liverwort (Marchantia polymorpha), a bryophyte (Rong et al. 2022), suggesting that the ROP candidates in land plants originated within this group.

Sequence analyses of CrROPs. A) Phylogenetic relationship of CrROPs with ROPs of other plants. The tree was constructed using the neighbor-joining method with bootstrap value of 1,000 runs using MEGA11 software. Accession numbers of sequences used to construct the tree are provided in Supplementary Table S3. B) Multiple sequence alignment of CrROPs was performed using Clustal W (Thompson et al. 1994) with default parameters through https://www.genome.jp/tools-bin/clustalw. Black and gray shadings were done with ESPript 3.0 (https://espript.ibcp.fr/ESPript/ESPript/) in which amino acids in black indicate conserved residues in all the six sequences. Dots indicate gaps inserted for optimal alignment. The conserved domains, the predicted NLS “K-K/R-x-K/R” region, the S-acylation GC---CG motif, the C-terminal CxxC prenylation motifs, and the hypervariable region CLK/CAA are shown within boxes.
Multiple sequence alignment of CrROP amino acid sequences revealed that they all possess five characteristic highly conserved G-Box motifs (G1 to G5), and a hyper-variable C-terminus region that dictates the type of PTM that ROP undergoes (Fig. 2B) (Feiguelman et al. 2018). CrROP3, CrROP4, CrROP5, and CrROP6 contained a conserved CxxL (C, cysteine; L, leucine; x, aliphatic amino acid) motif at the C-terminus and belonged to type-I ROPs, which undergo either farnesylation or geranylgeranylation. Among these four CrROPs, there was some variation in the types of aliphatic amino acids present in the “CxxL” motif. While CrROP3 and CrROP5 possessed the “CSIL” motif, CrROP4 and CrROP6 contained the “CIFL” and “CILL” motifs, respectively. Whereas CrROP1 and CrROP2 possessed “GC-CG box” S-acylation motif and “CLK/CAA” hypervariable domain at the C-terminus, and belonged to type-II ROPs that undergo S-acylation (Fig. 2B). Besides, all six CrROPs contained a polybasic canonical nuclear localization signal (NLS) sequence (K-K/R-X-K/R) toward the C-terminal region, with the basic residue K being predominant in CrROP5, and CrROP1 having the least number of KR residues (Fig. 2B).
Spatio-temporal expression analysis of CrROPs in C. roseus
To determine the spatio-temporal gene expression of CrROPs, their transcript levels were assessed across different tissues, such as leaf, flower, bud, silique, shoot, and root, by reverse transcription quantitative PCR (RT-qPCR). The expression of the relative transcript level for each CrROP in different tissues was calibrated using the ΔΔCt method and the normalization was performed using N2227 as the reference gene. All six CrROPs were expressed in different tissues, albeit at varying levels. However, CrROP3 and CrROP5 exhibited the highest overall expression in aerial tissues compared to the other four CrROP candidates. Moreover, both CrROP3 and CrROP5 had the highest expression in C. roseus leaves, which are the sites for producing certain MIA, including the dimeric vinblastine and vincristine and their monomeric precursors. CrROP3 exhibited the highest expression in leaf (∼10-fold), followed by bud (∼5-fold), flower (∼5-fold), and silique (1.6-fold), with basal level of expression in shoot and root (Fig. 3A). On the other hand, CrROP5 had a highest expression level in leaf (∼13-fold), followed by bud (∼10-fold), flower (∼5-fold), and silique (∼5-fold), with the least expression in root and shoot. Among the others, CrROP1 showed similar expression levels of 2-fold in leaf, bud, flower, and silique, with basal expression in shoot and root, while CrROP2 and CrROP4 exhibited basal level of expression in all tissues (Fig. 3A). Whereas CrROP6 showed the highest expression in bud (∼3-fold), followed by leaf (1.4-fold), and silique (1.6-fold) with least expression levels in other tissues (Fig. 3A). The in silico expression pattern of CrROPs derived from MPGR dataset was similar to the experimental RT-qPCR results (Supplementary Fig. S3A). Further, to determine whether CrROPs are responsive to phytohormone MeJA, a key elicitor of several specialized metabolic pathways, expression analysis was performed. Geraniol synthase (CrGES), a key MIA PG known to be induced by MeJA (Kumar et al. 2015; 2020), was used as a positive control. The results showed that unlike CrGES transcripts, which were significantly induced, all CrROPs exhibited either no change or slight changes in their expression levels in response to MeJA (Fig. 3B). These data are consistent with the in silico analysis using FPKM values from the MPGR database indicating that CrROPs expression is not induced in MeJA treated seedlings (Supplementary Fig. S3B).
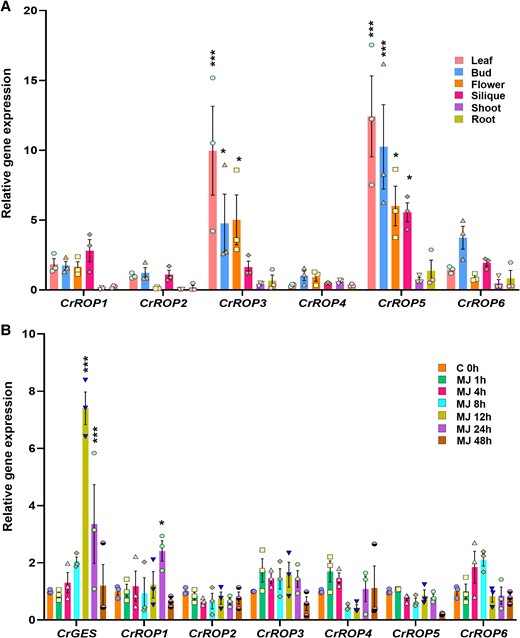
Spatio-temporal gene expression analysis of CrROPs. A) Relative transcript abundance of CrROPs in different tissues of C. roseus. RT-qPCR analysis was performed using total RNA extracted from leaf, flower, bud, silique, shoot, and root. Expression levels of genes were normalized to the endogenous reference gene CrN2227. B) Expression analysis of CrROPs, and CrGES in response to MeJA. RT-qPCR analysis was performed using total RNA extracted from leaves treated with MeJA. Samples were collected at different time intervals. Expression levels of genes were normalized to the endogenous reference gene CrN2227 and are represented relative to control 0 h, which was set to 1. The data points in each bar indicate the number of replicates. Statistical significance was calculated with reference to root (A) and 0 h (B). Statistical analysis for all the data shown in this figure was performed with “GraphPad Prism 9” using two-way ANOVA: *P = 0.033, **P = 0.002; ***P < 0.001.
CrROP3 and CrROP5 are geranylgeranylated by PGGT-I
The function of ROP GTPases depends on C-terminal stable prenylation or S-acylation. The presence of the canonical CaaL-box geranylgeranylation motif at the C-terminal end of CrROP3, CrROP4, CrROP5, and CrROP6 suggested that these proteins could be substrates for PGGT-I or PFT (Fig. 2B). Moreover, among the six CrROPs, CrROP3, CrROP5, and CrROP6 were predicted to be geranylgeranylated using the PrePS prenylation prediction suite (https://mendel.imp.ac.at/PrePS/). To experimentally determine whether CrROPs undergo prenylation, an in vitro prenylation assay was performed. Three different GST-tagged fusion proteins bearing a PFT motif (CAIM), a PGGT-I motif (CIIL), or an unprenylable motif (CWRL) were purified and used for the assay as controls (Fig. 4). CrROPs were produced as recombinant His-tagged proteins in Escherichia coli and purified by affinity chromatography (Fig. 4). The purified recombinant CrROP proteins were used for in vitro prenyltransferase assay. Incubation of purified CrROPs with fluorescent NBD-modified FPP and PFT revealed that none of the six CrROPs were farnesylated in contrast to the positive control for farnesylation (i.e. GST-CAIM) (Fig. 4A). On the other hand, incubation of fluorescent NBD-modified GGPP and PGGT-I showed that among the six CrROPs, only CrROP3 and CrROP5, having CSIL motif at the C-terminus, were geranylgeranylated similar to the positive control for geranylgeranylation (i.e. GST-CIIL) (Fig. 4B). Further, activity assay using recombinant CrROPs in presence of GTP showed that all six CrROPs possessed functional GTPase activity (Supplementary Fig. S4). The enzyme activity in enriched protein fractions not only shows that the CrROPs have GTPase activity, but the data also suggest that the purified recombinant proteins have an “active” or “native” conformation (either full or partial), which may be important for in vitro prenylation.
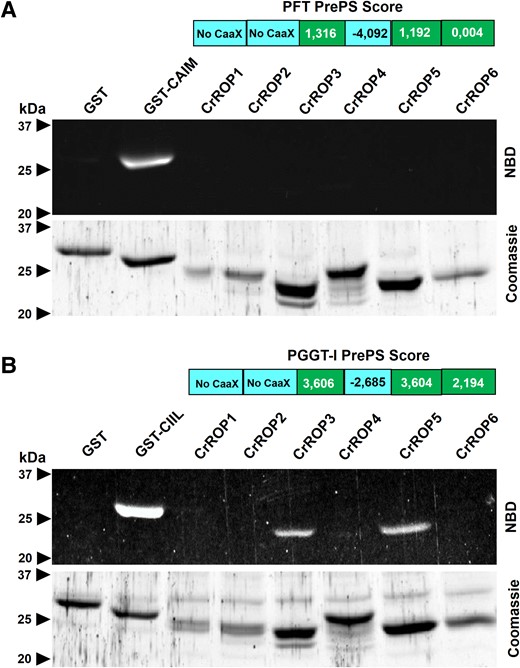
In vitro protein prenylation assay of CrROPs. A) In vitro farnesylation assay of CrROPs using recombinant C. roseus PFT. B) In vitro geranylgeranylation assay of CrROPs using recombinant C. roseus protein geranylgeranyltransferase (PGGT-I). In vitro prenylation positive controls are GST fused with CAIM or CIIL motives for PFT or PGGT-I, respectively. NBD, nitrobenzoxadiazol fluorescent FPP (C) or GGPP (D) probe.
CrROP3 and CrROP5 with CSIL” motif exhibit interaction with CrPGGT-I
As our prenylation assay revealed that both CrROP3 and CrROP5 were geranylgeranylated, we hypothesized that this modification could occur through the interaction of CrPGGT-I with these ROPs during a specific point in time, enabling it to fulfill its role in transferring a geranylgeranyl unit onto the two ROPs. In silico protein–protein interaction analysis using STRING software also supported this hypothesis wherein both type-I CrROP3 and CrROP5 were predicted to interact with CrPGGT-I, whereas no interaction was predicted between type-II CrROP2 and CrPGGT-I (Supplementary Fig. S5). To experimentally test our hypothesis and validate the STRING in silico predictions, we assessed the interaction of CrROPs with CrPGGTI using the yeast two-hybrid system (Y2H). For conducting Y2H assays, we fused the activator domain (AD) of GAL4 at the N-terminus of CrROP2 or CrROP3 or CrROP5 (prey), while the GAL4 DNA-binding domain (DBD) was fused at the N-terminus of CrPGGT-I (bait) (Fig. 5, A and B). Additionally, we prepared AD-CrROP3 and BD-CrROP5 constructs to investigate any potential interaction between the two CrROPs. Interaction assays revealed that yeast cells co-transformed with BD-CrPGGT-I (bait) and AD-EV (prey), AD-CrROP2 and BD-EV, AD-CrROP3 and BD-EV, and AD-CrROP5 and BD-EV, showed growth in SD/-Trp/-Leu medium but did not grow on the SD/-Leu/-Trp/-His/-Ade (-LWHA) medium (Fig. 5, C and D). However, yeast cells co-transformed with constructs of AD-CrROP3 and BD-CrPGGTI, and AD-CrROP5 and BD-CrPGGTI grew well on both SD-LW and SD-LWHA medium, whereas cells co-transformed with AD-CrROP2 and BD-CrPGGTI were unable to grow on SD-LWHA medium (Fig. 5, C and D). These results suggest that both CrROP3 and CrROP5, which are type-I ROPs with the N-terminus “CSIL” motif, could interact with CrPGGT-I in vivo. However, CrROP2, which is a type-II ROP with the “GC-CG” motif, did not show interaction with CrPGGT-I. No protein–protein interaction was seen between CrROP3 and CrROP5 in our Y2H analysis (Fig. 5, C and D). Furthermore, when the C-terminal “CSIL” motif was removed in CrROP3 and CrROP5 (Fig. 5, E and F), the resulting ΔCrROP3 and ΔCrROP5 did not show interaction with CrPGGT-I (Fig. 5, G and H). This indicated that the presence of the “CSIL” motif is essential for the interaction of CrROP3 and CrROP5 with CrPGGT-I.
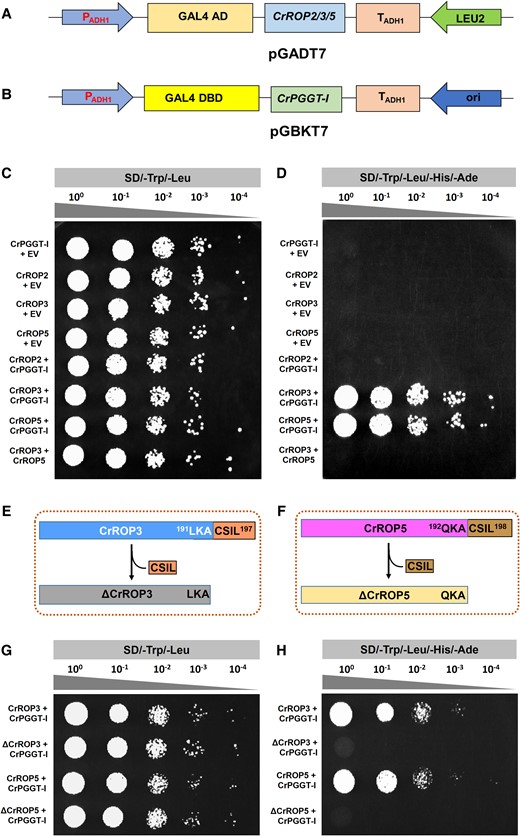
Y2H protein–protein interaction assay. A, B) Vector maps of bait and prey constructs. The ORF of CrROP2, CrROP3, and CrROP5 were cloned in-frame with AD of pGADT7, and the ORF of CrPGGT-I was cloned in-frame with the DBD of pGBKT7 vector. C, D) Mating-based Y2H screening. CrROP2 or CrROP3 or CrROP5 were separately transformed into AH109 (MATa) yeast strain, which were then co-cultivated with the compatible mating type Y187 (MATα) yeast strain having CrPGGT-I or empty vector pGBKT7 (EV) to identify bait-interaction in the resulting diploid yeast cells. The transformants were plated using different dilutions on synthetically defined (SD) medium lacking tryptophan (Trp), and leucine (SD/-Trp/-Leu) (C), and on SD/-Trp/-Leu medium lacking histidine and adenine (SD/-Trp/-Leu/-His/-Ade) (D). The plates were incubated for 3 to 5 d at 30 °C and observed for growth. Growth of yeast culture on SD/-Trp/-Leu/-His/-Ade indicates interaction of CrROP3 and CrROP5 with CrPGGT-I (F). Three independent colonies were tested per combination and a representative colony is shown. E, F) Schematic representation of ΔCrROP3 and ΔCrROP5 showing lack of CSIL motif. “LKA” and “QKA” represent three amino acids preceding the CSIL motif in CrROP3 and CrROP5, respectively. G, H) Mating-based Y2H screening of interaction. CrROP3 or ΔCrROP3 and CrROP5 or ΔCrROP5 were separately transformed into AH109 (MATa) yeast strain, which were then co-cultivated with the compatible mating type Y187 (MATα) yeast strain having CrPGGT-I to identify bait-interaction in the resulting diploid yeast cells. The transformants were plated using different dilutions on SD/-Trp/-Leu (G), and on SD/-Trp/-Leu/-His/-Ade (H).
CrROP3 and CrROP5 are localized to the nucleus, and CrROP2 is targeted to the plasma membrane
ROP GTPases are generally considered to be localized to the plasma membrane, but they have also been reported to be localized to the nucleus and cytosol (Chen et al. 2010; Ge et al. 2020; Han et al. 2022). Sequence analysis of CrROP2, CrROP3, and CrROP5 revealed that the polybasic region of CrROP3 and CrROP5 harbors a K-K/R-x-K/R sequence, which is indicative of potential nuclear localization (Fig. 2B). Whereas CrROP2 possessed least number of KR residues with the CAA motif at the end of C-terminus (Fig. 2B). As in silico prediction programs did not yield a consistent localization pattern for CrROP2, CrROP3, and CrROP5 (Supplementary Table S1), we assessed their subcellular localization experimentally by introducing green fluorescent protein (GFP) fusion protein (CrROP-GFP) into C. roseus cells. To ascertain the precise localization, each of the CrROP-GFP constructs was co-transformed with a plasmid expressing a specific marker for either plasma membrane (PM-mCH) or nuclear (nuc-mCH) localization. Analysis of fluorescence in co-transformed C. roseus cells by confocal microscopy revealed that CrROP2-GFP was predominantly localized at the cell's periphery, indicating its localization in the plasma membrane (Fig. 6A). Further, the overlapping signals emitted by the PM-mCH marker and the GFP signal from CrROP2-GFP provided clear evidence that CrROP2 is localized to the plasma membrane (Fig. 6, B and C). In the case of CrROP3-GFP and CrROP5-GFP, the GFP signal was found to be associated with the nucleus (Fig. 6, E and I). The nuclear localization of CrROP3-GFP and CrROP5-GFP was further confirmed by the clear superimposition of the GFP signal with the signal emitted by the nuc-mCH marker (Fig. 6, F, J and G, K). Moreover, the localization of CrROP5-GFP was diffused in part of the nucleus, with a more pronounced localization in the nucleolus (Fig. 6, I and K).
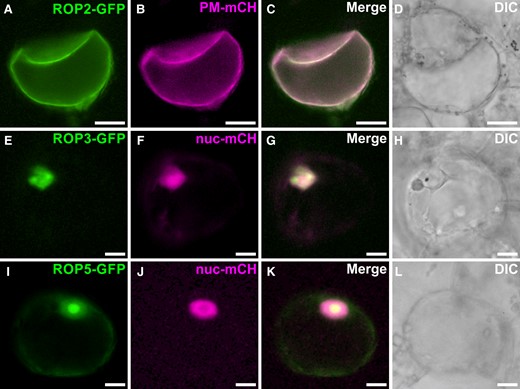
Analysis of subcellular localization of CrROP3, CrROP5, and CrROP2. Confocal laser scanning microscopy of C. roseus cells co-transformed with CrROP-GFP (A, E, I) and plasma membrane-mCherry (PM-mCH, plasma membrane specific marker) or nuclear-mCherry (nuc-mCH, nuclear specific marker) (B, F, G) expression constructs. In each subfigure, fluorescence detected from GFP and mCH fusion proteins is shown on the first and second vertical panels, respectively, whereas the third vertical panel (C, G, K) shows merged GFP and mCH fluorescence. The fourth and the rightmost panel (D, H, L) shows differential interference contrast (DIC) image of cells. Scale bar = 10 µm.
Virus-induced gene silencing of CrROP3 and CrROP5 show their involvement in MIA biosynthesis
To discern the in planta role of CrROP3 and CrROP5 in MIA biosynthesis, the expression of these genes was downregulated in C. roseus leaves by virus-induced gene silencing (VIGS) following the method reported previously (Kumar et al. 2015, 2020). To prevent potential cross-silencing of CrROP isoforms, regions of CrROP2, CrROP3, and CrROP5 that showed the highest dissimilarity with other isoforms were utilized to generate VIGS constructs (Supplementary Fig. S6). In parallel, the pTRV2:CrPDS construct was employed to silence the phytoene desaturase (PDS) gene, leading to a photobleached phenotype that served as a visible marker to determine the optimal timing for collecting silenced leaf tissues from CrROP-vigs plants, ensuring homogeneity in the harvested plant material (Fig. 7A). Moreover, the silencing of CrROP2, CrROP3, and CrROP5 did not result in any obvious visible phenotype (Fig. 7A). The RT-qPCR expression analysis revealed that the silencing of CrROP2, CrROP3, and CrROP5 resulted in significant downregulation of their transcript levels in the range of 84% to 93% in newly emerging leaves of silenced plants compared to the empty vector (EV) control (Fig. 7B). To evaluate the effect of silencing these genes on MIA biosynthesis, we measured the expression of genes related to MIA biosynthesis, such as TFs [octadecanoid responsive Catharanthus AP-2 domain 3 (ORCA3), basic helix-loop-helix transcription factor 2 (BIS2), and WRKY], MAP kinase 3 (MPK3), and pathway genes [1-deoxy-D-xylulose 5-phosphate synthase (DXS), geraniol synthase (GES), geraniol-10-hydroxylase/8-oxidase (G10H), anthranilate synthase (AS), strictosidine synthase (STR), and tabersonine 16-hydroxylase 2 (T16H)], which were previously shown to be affected in the CrPGGT-I silencing background (Kumar et al. 2020). RT-qPCR analysis revealed that the transcript levels of all analyzed TFs, MPK3 and PGs drastically declined by 40% to 92% in CrROP3-, and CrROP5-vigs leaf tissues compared with EV (Fig. 7, D and E). In contrast, samples derived from CrROP2-vigs plants showed no significant change in the expression of any of the above analyzed genes related to MIA biosynthesis compared to the EV control (Fig. 7C).
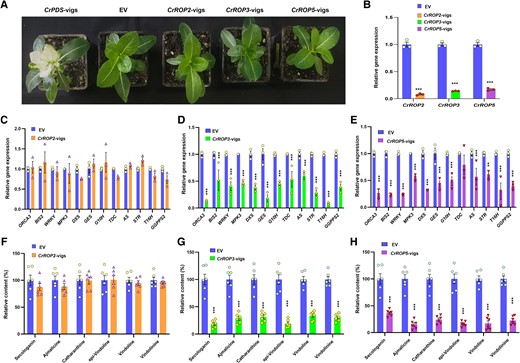
Effect of virus-induced gene silencing of CrROP2, CrROP3, and CrROP5 on monoterpene indole alkaloid biosynthesis. A). Representative images of plants infected with A. tumefaciens harboring pTRV vectors and VIGS constructs. Images were taken 3 wk after infection. B) Quantitative polymerase chain reaction (qPCR) analysis showing the relative expression of CrROP2, CrROP3, and CrROP5 in comparison to EV control. Effect of CrROP2, CrROP3, and CrROP5 silencing on expression of TFs and PGs related to MIA biosynthesis (C, D, E) and major MIA (F, G, H). Expression level of genes was normalized to CrN2227 endogenous control and was set to 1 in EV control to determine the relative reduction in CrROP-vigs leaves. Levels of different metabolites are represented relative to EV control. The results shown are from three (RT-qPCR) and six (metabolites) independent biological replicates, respectively, and indicated by data points in each bar. Statistical analysis for all the data shown in this figure was performed with “GraphPad Prism 9” using one-way ANOVA: ***P < 0.001. Error bars indicate mean ± SE. Gene abbreviations: AS, anthranilate synthase; BIS2, basic helix-loop-helix transcription factor 2; DXS2, 1-deoxy-D-xylulose 5-phosphate synthase 2; G10H, geraniol-10-hydroxylase/8-oxidase; GES, geraniol synthase; MPK3, MAP kinase 3; ORCA3, octadecanoid responsive Catharanthus AP-2 domain 3; STR, strictosidine synthase; T16H2, tabersonine 16-hydroxylase 2; TDC, tryptophan decarboxylase; WRKY, WRKY transcription factor.
Next, analysis of metabolites showed that specific silencing of CrROP3 and CrROP5, which led to the downregulation of genes related to MIA biosynthesis, resulted in significant reduction in the levels of secologanin (a key iridoid intermediate of the MIA pathway) and downstream MIA (Fig. 7, G and H). The leaves of CrROP3-vigs plants contained 81.5% lower levels of secologanin than EV leaves (Fig. 7G). This was followed by a significant decrease in the levels of epi-vindolinine (81%), vindolinine (70%), vindoline (67.3%), catharanthine (68.8%), and ajmalicine (72.2%). Similarly, CrROP5-vigs leaves showed a drastic decline in secologanin (63.5%), followed by vindoline (82.8%), vindolinine (77.4%), and ajmalicine (85%) content as compared to EV control leaves (Fig. 7H). Unlike CrROP3 and CrROP5 silencing, which resulted in a drastic reduction in MIA biosynthesis, C. roseus plants with suppressed CrROP2 did not exhibit any significant decrease in the levels of either the iridoid intermediate secologanin or downstream MIA (Fig. 7F).
Overexpression of CrROP3 and CrROP5 enhances MIA biosynthesis
The suppression of CrROP3 and CrROP5, not CrROP2, negatively affected the MIA biosynthesis (Fig. 7, C to H). To further elucidate the effect of CrROP2, CrROP3, and CrROP5 overexpression on MIA biosynthesis, the coding sequence of these genes was placed under the control of the cauliflower mosaic virus (CaMV) 35S promoter and transiently overexpressed them individually in C. roseus by agroinfiltration. Analysis of CrROP2, CrROP3, and CrROP5 expression showed an 18.6-fold, 12.82-fold, and 29.83-fold increase in their transcript levels, respectively. It was observed that despite an 18.6-fold increase in the transcript level of CrROP2, there was no significant difference in the expression level of genes related to MIA biosynthesis or in the levels of secologanin and MIA between 35S:CrROP2 and EV control (Fig. 8, A and D). On the other hand, leaves overexpressing CrROP3 and CrROP5 exhibited a corresponding and significant enhancement in the expression of all TFs, MPK3, and most MIA PGs. The increase in gene expression ranged between 2.5- and 17.09-fold [except for 3-hydroxy methylglutaryl-CoA reductase (HMGR1) and AS, which did not exhibit a significant enhancement] with a maximum observed for G10H and a minimum but significant enhancement for TDC in CrROP3 overexpressing samples (Fig. 8B). Similarly, CrROP5 overexpressing samples displayed a corresponding increased expression of genes which ranged between 6.60- and 35.46-fold (except for HMGR1, TDC, AS, and T16H which did not exhibit a significant enhancement) with a maximum observed for STR and a minimum DXS2 (Fig. 8C). Subsequent quantification of metabolites revealed a significant elevation in the levels of analyzed metabolites in both CrROP3 and CrROP5 overexpressing leaves compared with the EV control. The degree of enhancement in secologanin and MIA levels was consistent with the degree of overall increase in the expression of genes related to MIA biosynthesis in CrROP3 and CrROP5 overexpressing samples. While CrROP3 overexpressing samples showed 1.82-fold and ∼1.5- to 1.9-fold increased accumulation of secologanin and different MIA, respectively, CrROP5 overexpression exhibited 2- to 3.7-fold increased accumulation of those metabolites (Fig. 8, E and F).
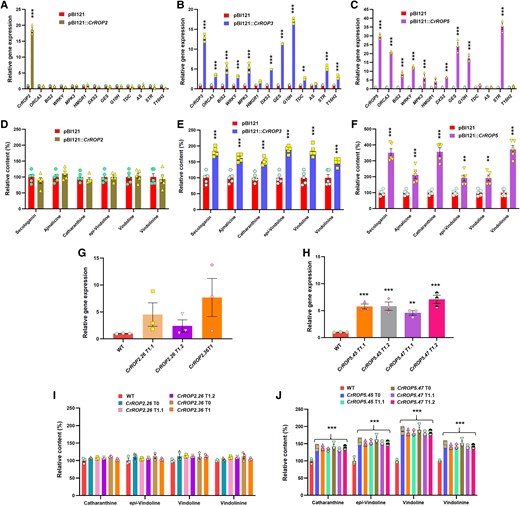
Effect of overexpression of CrROP2, CrROP3, and CrROP5 on C. roseus monoterpene indole alkaloid biosynthesis. RT-qPCR analysis of gene expression of CrROPs, TFs and PGs related to MIA biosynthesis in C. roseus agroinfiltrated with control (pBI121) and CrROP2, CrROP3, and CrROP5 (A to C), and the corresponding effect on MIA accumulation (D to F). G, H) Relative expression of CrROP2 and CrROP5 in WT and transgenic T1 lines of C. roseus. I, J) Relative levels of major MIA in WT and transgenic T0 and T1 lines. Expression levels of genes were normalized to the endogenous reference gene CrN2227 and are represented relative to the pBI121 control (EV) control, which was set to 1. Relative amounts of MIA were analyzed by HPLC and are expressed in % relative to pBI121 (D to F) and WT (I, J) controls. The results shown are from three to five biological replicates indicated by data points in each bar. Statistical analysis for all the data shown in this figure was performed with “GraphPad Prism 9” using one-way ANOVA: **P = 0.002; ***P < 0.001. Error bars indicate mean ± SE. Gene abbreviations: AS, anthranilate synthase; BIS2, basic helix-loop-helix transcription factor 2; DXS2, 1-deoxy-D-xylulose 5-phosphate synthase 2; GES, geraniol synthase; G10H, geraniol-10-hydroxylase/8-oxidase; GES, geraniol synthase; MPK3, MAP kinase 3; ORCA3, octadecanoid responsive Catharanthus AP-2 domain 3; STR, strictosidine synthase; T16H2, tabersonine 16-hydroxylase 2; TDC, tryptophan decarboxylase; WRKY, WRKY transcription factor; WT, wild type.
To further substantiate the results obtained in transient overexpression studies, transformed C. roseus plants overexpressing CrROPs were generated through tissue culture-independent Agrobacterium-mediated in planta transformation, as described earlier (Kumar et al. 2020). For both CrROP2 and CrROP5, two independent transformed plants (T0) were obtained; however, despite repeated efforts, CrROP3 overexpressing plants could not be generated. To obtain T1 plants, seedlings were obtained by germinating seeds of T0 plants and PCR-screened to confirm the transgenic nature. For CrROP2, two T1 plants for line CrROP2.26 and one plant for line CrROP2.36 were obtained, whereas two T1 plants for each line CrROP5.45 and CrROP5.47 were confirmed by PCR screening (Supplementary Fig. S7). The transgenic lines showed increased expression of the corresponding introduced gene, which ranged from 2.4- to 7.6-fold for CrROP2 and 4.5- to 7-fold for CrROP5 compared to the WT control plants (Fig. 8, G and H). Subsequent metabolite analysis revealed that stable overexpression of CrROP5 resulted in an enhanced accumulation of MIA (1.4- to 1.9-fold), whereas overexpression of CrROP2 did not show any significant change in the MIA levels compared to the WT (Fig. 8, I and J). These findings were consistent with the results obtained from the transient overexpression studies involving CrROP2 and CrROP5 (Fig. 8, D and F).
Removal of CSIL-motif in CrROP3 and CrROP5 fails to enhance MIA biosynthesis
CSIL-motif containing CrROP3 and CrROP5 proteins were not only geranylgeranylated by CrPGGT-I (Fig. 4B) but also interacted with it (Fig. 5, C and D). Moreover, both CrROP3 and CrROP5 showed in planta functional roles in the modulation of MIA biosynthesis (Figs. 7 and 8). This prompted us to investigate whether the CSIL motif is essential for CrROP3 and CrROP5 to exert a modulatory effect on MIA biosynthesis. Therefore, we generated ΔCrROP3 and ΔCrROP5 mutants lacking 12 nucleotides that encode amino acids corresponding to the C-terminal “CSIL” motif (Supplementary Fig. S6). To validate the in planta function, constructs for wild type (WT), and ΔCrROP3 and ΔCrROP5, along with the vector control, were individually transformed into C. roseus leaves by Agroinfiltration. Analysis of transcript levels showed that the WT and mutants ΔCrROP3 and ΔCrROP5 had elevated expression ranging from 6.56- to 8.6-fold compared to the EV control (Fig. 9, A and B). While this increase in transcript levels significantly enhanced the accumulation of MIA by 1.5- to 2.17-fold in the WT CrROP3 and CrROP5 background compared to the EV control, there was no effect on the accumulation of any of the analyzed MIA in leaves overexpressing mutant ΔCrROP3 or ΔCrROP5 (Fig. 9, C and D). Moreover, the level of analyzed MIA in leaves infiltrated with ΔCrROP3 or ΔCrROP5 was almost identical to the level found in leaves transformed with the EV control (Fig. 9, C and D).
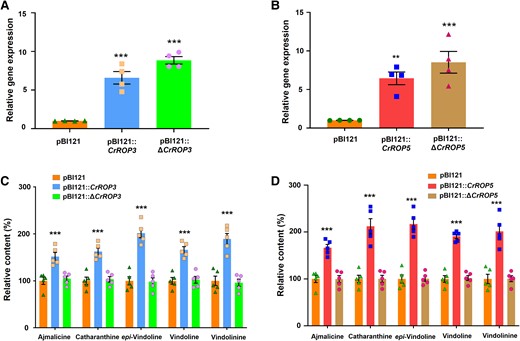
Effect of overexpression of ΔCrROP3 and ΔCrROP5 mutants lacking CSIL motif on monoterpene indole alkaloids biosynthesis. A, B) Relative gene expression of CrROP3 and ΔCrROP3, and CrROP5 and ΔCrROP5 in C. roseus leaves agroinfiltrated with pBI121::CrROP3 and pBI121::ΔCrROP3, and pBI121::CrROP5 and pBI121::ΔCrROP5 constructs, respectively, in comparison to control leaves agroinfiltrated with pBI121 vector. C, D) Corresponding effect of gene expression on accumulation of major MIA. Expression levels of genes were normalized to the endogenous reference gene CrN2227 and are represented relative to the pBI121 control, which was set to 1. Levels of MIA were analyzed by HPLC and are expressed in % relative to pBI121 control. The data points in each bar indicate the number of replicates. Statistical analysis for all the data shown in this figure was performed with “GraphPad Prism 9” using two-way ANOVA: ***P < 0.001. Error bars indicate mean ± SE.
Discussion
It has been demonstrated that disruption of geranylgeranylation has a negative impact on MIA biosynthesis in C. roseus and sesquiterpene capsidiol production in N. tabacum (Courdavault et al. 2009; Huchelmann et al. 2014; Kumar et al. 2020). Moreover, the availability of the geranylgeranyl precursor GGPP, necessary for geranylgeranylation, has been shown to play a critical role in the regulation of C. roseus MIA biosynthesis (Kumar et al. 2020). These studies highlight the importance of geranylgeranylation and indicate the involvement of geranylgeranylated proteins in the regulation of specialized metabolism in plants. Given this information, and considering that ROP proteins are known to undergo prenylation (Sorek et al. 2010, 2011) and that overexpression of a ROP from S. dulcis (Sdrac2) enhanced atropine content in A. belladonna (Asano et al. 2013), we hypothesized specific geranylgeranylated ROPs may play a role in the regulation of MIA biosynthesis in C. roseus. Hence, the current study aimed to conduct a detailed investigation on the role of ROPs in C. roseus MIA biosynthesis.
C. roseus possesses six ROP candidates distributed among four of its eight chromosomes (Supplementary Fig. S2B). ROPs in plants are generally encoded by multiple genes, with the exception of the M. polymorpha, a bryophyte, which has only one gene (Rong et al. 2022). The presence of multiple genes encoding ROPs is similar to the scenario in other plants. For instance, a member of nonvascular plants, Physcomitrium patens, has four genes, while among vascular plants, the range extends from 4 in loblolly pine (Pinus taeda) to 11 in Arabidopsis and 13 in poplar (Populus spp) (Fowler (2010); Feiguelman et al. 2018; Rong et al. 2022). The six CrROPs, categorized into four phylogenetic groups, displayed notable similarity to ROPs of Arabidopsis and other land plants (Fig. 2A). They all possess conserved GTPase activity domains and exhibit in vitro GTPase activity (Fig. 2B; Supplementary Fig. S4). Notably, group-1 included CrROP3 and CrROP5, along with AmRac2 and SdRac2 that have been suggested to affect specialized metabolism (Asano et al. 2013; Kurosaki and Taura 2015), indicating their possible role in regulation of secondary metabolism. However, the role of CrROP3 and CrROP5 in other processes cannot be excluded, as group-1 also includes Arabidopsis AtROPs that have been shown to regulate root hair initiation, ROS production, light responses, ABA signaling, and pathogen responses (Molendijk 2001; Jones et al. 2002; Poraty-Gavra et al. 2013; Feiguelman et al. 2018). Interestingly, group-1 also consisted of the sole ROP identified in M. polymorpha, suggesting that the ROPs in land plants would have evolved first within this group.
PTMs of ROPs represent an additional regulatory layer that facilitates the integration of functional modulation and subcellular localization, thus enabling precise spatio-temporal control of GTPase activity. Moreover, tight regulation of different types of PTMs is crucial to ensure accurate and appropriate GTPase signaling (Lemichez et al. 2018; Olson 2018). The presence of the CaaL motif at the C-terminal end of CrROP3, CrROP4, CrROP5, and CrROP6, all type-I ROPs, suggests their potential as substrates for CrPGGT-I. However, further experimental evidence revealed that only CrROP3 and CrROP5 were geranylgeranylated by CrPGGT-I, and none of the six CrROPs were farnesylated by PFT (Fig. 4, A and B). This emphasizes the functional importance of the “CSIL” motif in CrROP3 and CrROP5, leading to efficient geranylgeranylation in vitro. Therefore, activation of CrROP3 and CrROP5 via prenylation by CrPGGT-I could be a critical process at the tissue level to control MIA biosynthesis in C. roseus. Interestingly, the transcripts of CrROP3 and CrROP5 that were geranylgeranylated exhibited higher expression in most tissues, albeit at different levels, indicating their role in different processes. Moreover, expression of CrROPs was not affected much in response to treatment with MeJA, a known inducer of MIA biosynthesis in C. roseus (Rischer et al. 2006; Oudin et al. 2007). The uninduced expression of CrROPs, including CROP3 and CrROP5, was similar to the expression of CrGGPPS2 and CrPGGT-I in response to MeJA (Courdavault et al. 2009; Kumar et al. 2020). This indicated that transcripts of CrROP3 and CrROP5 co-expressed with the transcripts of their related upstream genes CrPGGT-I and CrGGPPS2, which have been shown to regulate MIA biosynthesis in C. roseus in previous studies (Courdavault et al. 2005, 2009; Kumar et al. 2020). It has been shown that MeJA-induced production of MIA is highly dependent on protein prenylation, suggesting that MeJA signaling is somehow driven by prenylated proteins (Courdavault et al. 2009).
Though a coordinated role for CrGGPPS2 and CrPGGT-I in the regulation of MIA biosynthesis has been proposed (Kumar et al. 2020), a direct connection between CrPGGT-I and CrROPs remains unclear. It is a fact that CrPGGT-I catalyzes the transfer of a C20 isoprenoid moiety to downstream proteins, thus facilitating their subcellular localization and protein–protein interactions (Sorek et al. 2011; Running 2014; Bao et al. 2022). Both CrROP3 and CrROP5, which possess the “CSIL” motif, were found to interact with CrPGGT-I, the enzyme responsible for protein geranylgeranylation. In contrast, mutants ΔCrROP3 and ΔCrROP5, lacking the “CSIL” motif, did not interact with CrPGGT-I, highlighting the essential requirement of the “CSIL” motif for this interaction. On the other hand, CrROP2 lacking the “CaaL” motif, was neither geranylgeranylated nor showed any interaction with CrPGGT-I (Figs. 4 and 5). In a recent study, a type-I GhROP3 having the C-terminal “CAFL” motif was found to interact with GhGGB (PGGT-I) resulting in negative regulation of ABA signaling in cotton (Hu et al. 2022). In addition to PTM, subcellular localization is a fundamental aspect of a protein's function, as it determines where and how a protein exerts its molecular actions (Pan et al. 2021). For ROPs, their localization to specific cellular compartments is essential for their proper functioning and interaction with downstream effectors. It is known that ROP proteins are synthesized as soluble proteins and undergo successive lipid modification involving prenylation or palmitoylation, which anchor the proteins to the membrane (Lavy and Yalovsky 2006; Sorek et al. 2011; Feiguelman et al. 2018). Several studies have demonstrated that both type-I and type-II ROPs have plasma membrane localization where they trigger signaling, but for the type-I ROPs/RACs, localization could also be found in the cytoplasm and nucleus (Chen et al. 2010; Sorek et al. 2010, 2011; Feiguelman et al. 2018; Han et al. 2022; Xiang et al. 2023). It is reported that most ROPs contain a canonical NLS sequence [K(K/R)X(K/R)] (Chen et al. 2010). Both CrROP3 and CrROP5 were found to contain an NLS sequence and were localized in the nucleus. In contrast, ROP2 did not possess an NLS and was instead localized to the plasma membrane (Fig. 6). Nevertheless, it is plausible that these proteins might also exhibit cytosolic or plasma membrane localizations intermittently, attributed to the protein's functional cycles regulated by cytoplasmic or plasma membrane shuttling mechanisms, as previously shown for other ROP proteins (Yalovsky 2015; Hodge and Ridley 2016). These results suggest that the interaction of CrROP3 or CrROP5 with CrPGGT-I facilitates their geranylgeranylation and potentially influences subsequent subcellular localization. This, in turn, may impact downstream signaling involved in the regulation of MIA biosynthesis.
To investigate this, CrROP3 and CrROP5, as well as CrROP2 that served as a control, were subjected to VIGS. Specific silencing of CrROP3 and CrROP5, both of which end with the CSIL C-terminal motif, resulted in reduced transcript levels of TFs and PGs related to MIA biosynthesis, accompanied by decreased secologanin and MIA levels (Fig. 7, D, E and G, H). The effect on ajmalicine, catharanthine, and vindoline accumulation was stronger in the CrROP5-silenced plant, consistent with the higher expression level of CrROP5 as compared with CrROP3 in C. roseus leaves (Figs. 3A and 7, G and H). In contrast, CrROP2 silencing had no effect on the expression of MIA-related genes or metabolite levels (Fig. 7, C and F). This was in agreement with the previous reports that silencing of genes that are involved in geranylgeranylation (PGGT-I) or inhibition/suppression of geranylgeranylation negatively impacts MIA biosynthesis in C. roseus and capsidiol production in N. tabacum (Courdavault et al. 2009; Huchelmann et al. 2014; Kumar et al. 2020). Correspondingly, the reverse effect of silencing was observed upon transient overexpression of CrROP3 and CrROP5 (Fig. 8). The expression of most of the TFs and genes that showed reduced expression in the silencing background was upregulated, resulting in corresponding enhancement in secologanin and MIA content (Fig. 8). Moreover, stable overexpression of CrROP5 also enhanced the MIA accumulation in C. roseus, further confirming the results obtained in transient overexpression. The effects observed in VIGS and overexpression of CrROP3 and CrROP5 were consistent with the coordinated roles proposed for CrGGPPS2 and CrPGGT-I in MIA biosynthesis (Kumar et al. 2020). These findings align with studies showing that overexpression of a type-I ROP from S. dulcis (Sdrac2) enhances tropane alkaloid atropine biosynthesis in A. belladonna, indicating a potentially conserved mechanism in alkaloid-producing plants. Although the transcript level of CrROP2 was significantly enhanced in both transient and stable overexpression backgrounds, it had no effect on either the transcript levels of TFs and genes related to MIA biosynthesis or the levels of secologanin and MIA (Fig. 8). Based on these results, it can be construed that CrROP3 and CrROP5 act as bona fide signaling proteins and play a role in triggering the signaling cascade leading to the enhanced accumulation of MIA.
VIGS and overexpression experiments clearly established that among the three CrROPs (CrROP2, CrROP3, and CrROP5), only CrROP3 and CrROP5, which possessed the “CSIL” motif, affected MIA biosynthesis (Figs. 7 and 8). Moreover, both CrROP3 and CrROP5 were geranylgeranylated by CrPGGT-I and interacted with CrPGGT-I (Figs. 4B and 5, C and D). Furthermore, the absence of the “CSIL” motif in mutants ΔCrROP3 and ΔCrROP5 prevented their interaction with CrPGGT-I (Fig. 5, G and H). These results clearly highlighted the importance of the “CSIL” motif in CrROP3 and CrROP5 for geranylgeranylation, which, in turn, modulates MIA biosynthesis. Earlier investigations have also indicated that type-I ROPs featuring a “CaaL” motif at the C-terminus undergo geranylgeranylation (Sorek et al. 2011). Further, it was reported that the presence of Arg/Lys-rich polybasic domain in close proximity to the “CaaL” motif enhances the rate of geranylgeranylation (Caldelari et al. 2001). Indeed, CrROP3 and CrROP5 contain a lysine-rich region at the C-terminal hypervariable region, whereas this feature is not as evident in CrROP4 and CrROP6 (Fig. 2B). This could also be a reason for CrROP3 and CrROP5 getting geranylgeranylated, whereas CrROP4 and CrROP6 are not geranylgeranylated despite of having “CaaL” motif. To further substantiate the role of the “CSIL” motif in CrROPs on MIA biosynthesis, mutants ΔCrROP3 and ΔCrROP5 devoid of the CSIL motif were overexpressed. Unlike WT CrROP3 and CrROP5, which, as shown before, enhanced MIA biosynthesis, the mutants showed no effect on the level of MIA accumulation. This could be attributed to the fact that removal of the “CSIL” motif results in noninteraction of ΔCrROP3 and ΔCrROP5 with CrPGGT-I (Fig. 5), which might have resulted in non-geranylgeranylation of ΔCrROP3 and ΔCrROP5 under in vivo conditions. Hence, the non-geranylgeranylated ΔCrROP3 and ΔCrROP5 proteins could be mis-localized and unable to initiate a signaling mechanism that transcriptionally upregulates MIA biosynthesis, indicating the critical function of the “CSIL” motif. Based on these results, it can be construed that CrROP3 and CrROP5 act as bona fide signaling proteins and play a role in triggering the signaling cascade leading to the enhanced accumulation of MIA.
The fact that CrROP3 and CrROP5 interact with CrPGGT-I, get geranylgeranylated, localize to the nucleus, and positively affect MIA biosynthesis indicates that the modulation of gene expression and MIA accumulation occurs in the nucleus. Recently, several tomato ROPs have been shown to be localized in the nucleus; however, their exact roles have not been determined (Wang et al. 2022). In another study, it was demonstrated that a N. tabacum ROP (NtRHO1) containing the “CSIL” motif is localized in the nucleus, where it interacts with a WRKY TF to negatively regulate defense against tobacco mosaic virus (Han et al. 2022). Taking cues from these observations, as well as results from this study, we checked the interaction of CrROP3 and CrROP5 with TFs related to MIA biosynthesis that were affected in CrROP3 and CrROP5 silencing and overexpression backgrounds. None of the tested TFs (WRKY1, BIS2, MPK3, MYC2, ORCA3) showed any interaction with CrROP3 or CrROP5 (Supplementary Fig. S8). The absence of interaction between CrROP3 and CrROP5 with any of the tested TFs suggests the potential existence of an alternative mechanism wherein nuclear-localized ROPs might function together with nuclear-localized ROP-associated effectors, such as GTPase-activating proteins (GAPs) and guanine nucleotide exchange factors (GEFs). This scenario has been demonstrated in Human Embryonic Kidney (HEK) cells, where RhoA engages with RhoA-GAP (DLC1) and RhoA-GEFs (Net1 and Ect2) within the nucleus (Dubash et al. 2011).
In conclusion, we have uncovered a role of ROPs and demonstrated that specific CrROPs, namely CrROP3 and CrROP5, which contain the geranylgeranylation motif “CSIL,” play a positive regulatory role in C. roseus MIA biosynthesis. The results demonstrate that the “CSIL” motif is essential for the interaction of CrROP3 and CrROP5 with PGGT-I, which probably catalyzes geranylgeranylation of CrROP3 and CrROP5 during its interaction under in vivo conditions. Thus, our data suggest that the geranylgeranylation/ROP module is an essential signaling component of MIA biosynthesis in C. roseus and that CrROP3 and CrROP5 function downstream of CrPGGT-I and upstream of JA signaling for modulation of MIA biosynthesis (Fig. 10). These findings shed light on the importance of ROP GTPases in controlling the biosynthesis of specialized metabolites in plants. Further exploration of the downstream effectors of ROPs, which is a subject of our ongoing investigation, would provide deeper insights into the underlying mechanism of specialized metabolic pathway regulation.
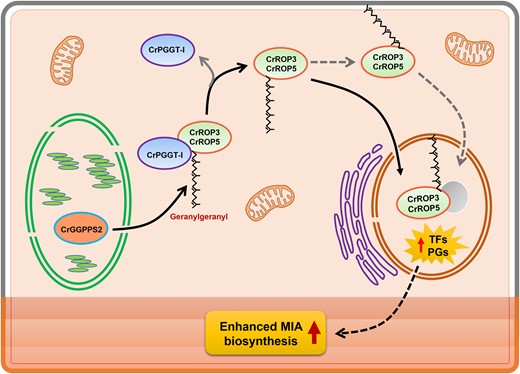
Proposed model showing the role of CrROP3 and CrROP5 in modulation of MIA biosynthesis in Madagascar periwinkle (C. roseus). CrPGGT-I interacts with CrROP3 and CrROP5, and geranylgeranylates them by utilizing GGPP made by plastidial CrGGPPS2. The geranylgeranylated CrROP3 and CrROP5 are either localized to nucleus directly or indirectly via membrane anchoring, and bring about transcriptional modulation of transcription factors (TFs) and pathway genes (PGs) involved in MIA biosynthesis, which is localized in different cell types/layers of leaf.
Materials and methods
Mining of CrROPs from the MPGR database
To identify potential genes encoding ROPs in Madagascar periwinkle (C. roseus) a search was carried out in the MPGR (http://medicinalplantgenomics.msu.edu) database initially by using ROPs and RACs of other plants as query and then later by blast search against C. roseus genome sequence (Kellner et al. 2015; She et al. 2019). Forty annotated ROP sequences were obtained, and among them, the sequences with low or no FPKM, short-length transcripts, and transcripts with Rab annotation were excluded, resulting in a total of six candidates encoding ROP GTPases from the C. roseus genome.
Phylogenetic analysis
For phylogenetic analysis, amino acid sequences of characterized Rac/ROPs from different plant species were retrieved from the National Center for Biotechnology Information (NCBI) database (www.ncbi.nlm.nih.gov). The deduced amino acid sequences of CrROPs were compared with other Rac/Rop proteins obtained from the NCBI database. The phylogenetic tree was constructed using the neighbor-joining method using MEGA11 software (Tamura et al. 2007). Multiple sequence alignment of CrROP proteins was performed using ClustalW (Thompson et al. 1994) with default parameters through https://www.genome.jp/tools-bin/clustalw.
Plant material and tissue collection
C. roseus cv. Dhawal (National Gene Bank, CSIR-CIMAP, Lucknow, India) plants were grown in a growth room maintained at 22 to 25 °C with 16 h light and 8 h darkness. MeJA treatment was performed as described in our previous study (Kumar et al. 2020). Briefly, the excised first pair of leaves were dipped in 200 µM MeJA solution or water (control) containing the same amount of DMSO without MeJA. Samples were collected at different time points and stored at −80 °C. For tissue-specific expression analysis, roots, stems, leaves, siliques, and flowers were collected separately from 8-wk-old plants, frozen in liquid nitrogen and stored at −80 °C until further analysis. For VIGS/transient overexpression experiments, seeds were germinated and grown as mentioned above. In the VIGS experiment, fully developed first and second pairs of leaves from six-leaf-staged plants were utilized. In experiments related to transient overexpression and transgenic plants, fully developed first- and second-pair leaves from 6- to 8-wk-old plants were used for gene expression and metabolite analyses.
Protein expression, purification, and GTPase assay
For expression of recombinant CrROP proteins, the ORF of each gene was amplified from leaf cDNA using gene-specific forward and reverse primers with suitable restriction sites (Supplementary Table S2). The amplicons were cloned into pJET1.2/vector, and the sequences were verified by Sanger sequencing. The confirmed CrROPs were restriction digested from pJET1.2-derived constructs using specific restriction enzymes and subcloned into pET28a. The resulting pET28a::CrROP constructs were transformed into E. coli Rosetta-2 competent cells and used for protein expression. Induction, harvesting, and protein purification were performed as described earlier (Dwivedi et al. 2022) with slight modifications. Briefly, a single colony was inoculated into 10 mL Luria broth supplemented with kanamycin and chloramphenicol, and incubated overnight at 37 °C. From the overnight grown culture, 5 mL was taken, added to 500 mL Luria broth containing the appropriate antibiotics and grown at 37 °C till the absorbance at OD600 was 0.4. For protein induction, 50 µL of 1 M isopropyl-1-thio-β-D-galactopyranoside (IPTG) was added to the culture to get a final concentration of 1 mM and inoculated at 18 °C for 16 h. Protein purification by affinity chromatography on Ni-NTA agarose was performed according to the manufacturer's instructions. Protein concentration was determined following Bradford's method (Bradford 1976). GTPase assay was performed using the ATPase/GTPase Activity Assay Kit (Sigma–Aldrich) per the manufacturer's instructions.
Protein prenylation assay
In vitro prenylation assays were performed as described in Dutilleil et al. (2016). Briefly, recombinant purified 6His-tagged CrROPs were incubated with C. roseus recombinant PFT or PGGT-I (Courdavault et al. 2005) with the corresponding NBD (NitroBenzoxadiazol)-modified fluorescent prenyl substrates (respectively NBD-FPP or NBD-GGPP, Jena Biosciences). GST fusion proteins with a farnesylable CAIM (GST-CAIM) motif or geranylgeranylable CIIL motif (GST-CIIL) (Courdavault et al. 2005) were used as positive controls. In vitro prenylation reactions were composed of Tris 50 mM pH 7.5, ZnCl2 10 μM, MgCl2 5 mM, DTT 0.5 mM, NaCl 50 mM, NBD-FPP/GGPP 4 μM, 2 μg of protein prenyltransferase, and 0.5 to 1 μg of recombinant CrROPS. After 1 h at 30 °C, the reaction was stopped by the addition of Laemmli buffer and 5 min incubation at 95 °C. Proteins were separated by SDS–PAGE, and fluorescent proteins were visualized using the ChemiDocTM MP Imaging system (Bio-Rad). The protein gel was then stained in Coomassie blue solution.
Analysis of protein–protein interactions using Y2H assay
For Y2H assay, the full-length sequence of CrROP genes (CrROP2, CrROP3, and CrROP5) was cloned in-frame with the activation domain of pGADT7 (prey) vector, whereas CrPGGT-I was cloned in-frame with the DBD of pGBKT7 (bait) vector. The resulting constructs were transformed into mating yeast (Saccharomyces cerevisiae) strains AH109 and Y187. Accordingly, AH109 harboring pGADT7::CrROP2 or pGADT7::CrROP3 or pGADT7::CrROP5 or pGADT7::ΔCrROP3 or pGADT7::ΔCrROP5 and Y187 harboring pGBKT7::CrPGGT-I were selected on SD/-Leu and SD/-Trp media, respectively. A single colony from each of the above plates was co-inoculated into 1 mL of YPD medium and grown overnight at 30 °C. About 100 μL of overnight grown culture was plated on SD/-Leu/-Trp medium and incubated at 30 °C for 2 d. For determining the protein–protein interaction, the diploid yeast colonies grown on SD/-Leu/-Trp medium were further streaked on SD/-Leu/-Trp/-His/-Ade medium. For negative control, the bait vector (pGBKT7::CrPGGT-I) and prey vector (pGADT7::CrROPs) were mated with the reporter strain containing the empty AD and DNA-BD vectors, respectively.
Analysis of subcellular localization of CrROPs
The subcellular localization of CrROP2, CrROP3, and CrROP5 was studied by creating a GFP fusion protein using the p326sGFP vector. The ORF of each CrROP was amplified by PCR using leaf cDNA with gene-specific forward and reverse primers consisting of BsrGI/NotI sites (Supplementary Table S2). The resulting PCR product was cloned into the pJET1.2 vector for sequence confirmation, followed by subcloning into the BsrGI/NotI sites of the p326–sGFP vector, yielding the CrROP-sGFP construct. Plasmids p326::CrROP2-sGFP, p326::CrROP3-sGFP, p326::CrROP5-sGFP, PM-mCH, nuc-mCH and p326::sGFP were used for transient transformations of C. roseus cells by particle bombardment and fluorescence imaging were performed following the procedures previously described (Foureau et al. 2016).
Generation of silencing and overexpression constructs
The pTRV1 and pTRV2 vectors used for generating VIGS constructs were procured from The Arabidopsis Information Resource (TAIR), USA. The 500 bp fragments of CrROP2, CrROP3, and CrROP5 were amplified from leaf cDNA by PCR using gene-specific primers having EcoRI restriction site at 5′ end of each primer (Supplementary Table S2). The resulting PCR product was purified and subcloned into pJET1.2/vector, and sequences were confirmed by nucleotide sequencing. The confirmed fragment was then cloned into pTRV2 vector digested with EcoRI. The resulting pTRV2::CrROPs plasmid was confirmed by digestion. For the generation of overexpression constructs, the ORFs of CrROP2, CrROP3, and CrROP5 were PCR amplified using leaf cDNA with specific forward and reverse primers (Supplementary Table S2). A truncated CrROP3 and CrROP5 constructs lacking geranylgeranylation motif was generated by deleting 12 nucleotides from the 3´ end corresponding to the CSIL motif. The amplicons were cloned into pJET1.2/cloning vector for sequence confirmation, and then subcloned into XbaI and SacI sites of pBI121 binary vector under the control of the 35S promoter of CaMV to form pBI121::CrROP2, pBI121::CrROP3, pBI121::CrROP5, pBI121:ΔCrROP3, and pBI121:ΔCrROP5 constructs (Supplementary Fig. S6). The VIGS and overexpression constructs were then mobilized into Agrobacterium tumefaciens GV3101 competent cells using the freeze–thaw method.
VIGS and transient overexpression of CrROPs
VIGS and transient overexpression were performed according to Kumar et al. (2015, 2020). Briefly the overnight grown Agrobacteria cultures harboring pTRV1 and pTRV2::CrROP2 or pTRV2::CrROP3 or pTRV2::CrROP5 or pTRV2::CrPDS or pTRV2 (EV) constructs were resuspended in MES buffer (MES, MgCl2, and Acetosyringone) and mixed in 1:1 ratio before infiltration. Plants were infected by pricking below the apical meristem using a dissecting needle and kept in the dark for 48 h. Plants were shifted to a growth chamber (22 °C, 75% humidity, 16:8 h light cycle). Leaves from pTRV2::CrROP2, pTRV2::CrROP3, pTRV2::CrROP5, and pTRV2 infected plants were harvested 3 to 4 wk post infiltration, when albino phenotype developed in the first two pairs of leaves in pTRV2::CrPDS infected plants, and stored in −80 °C for further use. Transient overexpression was carried out following Kumar et al. (2020) using Agrobacteria harboring pBI121::CrROP2 or pBI121::CrROP3 or pBI121::CrROP5 or pBI121::ΔCrROP3 or pBI121::ΔCrROP5 or pBI121 (control) constructs. Agrobacteria with p19 (suppressor of RNA silencing) construct was mixed with Agrobacterium harboring overexpression construct or EV in a 1:1 ratio prior to infiltration.
Generation of C. roseus transgenic plants overexpressing CrROP2 and CrROP5
C. roseus transgenic plants were generated by tissue culture-independent Agrobacterium-mediated transformation protocol, as described earlier (Kumar et al. 2020). Agro-inoculated plants were PCR-screened using 35S forward and CrROP-specific reverse primers. Additionally, primers specific to the Agrobacterium chromosomal virulence gene were used to detect potential agro-contamination. Plants that exhibited no amplification or showed the presence of Agrobacterium contamination bands were excluded from further analysis. Plants that produced specific bands only in 35S forward and CrROP-specific reverse primers combination were used for further analysis. T1 plants were obtained by PCR-screening the seedlings generated from seeds of T0 plants (Supplementary Fig. S7).
Gene expression measurements
For tissue-specific expression analysis, total RNA from leaves, roots, stems, siliques, flower buds, and flowers was extracted using Trizol reagent (Sigma–Aldrich, USA) following the manufacturer's instructions. Similarly, for determining the expression of genes in MeJA elicitation, VIGS, and overexpression experiments, leaves were collected and used for total RNA extraction. cDNA was synthesized using a High-capacity cDNA Reverse transcription kit (Applied biosciences) following the manufacturer's instructions, and RT-qPCR was carried out as described previously (Rai et al. 2013; Kumar et al. 2020). The primers used to quantify CrROP transcripts were designed outside of the gene region cloned in pTRV2. The experimentally validated endogenous reference gene CrN2227 was used as endogenous control as it is one of the stable reference genes (Pollier et al. 2014). The PCR conditions were as follows: 94 °C for 10 min for one cycle, followed by 40 cycles of 94 °C for 15 s, and 60 °C for 1 min. Fold-change differences in gene expression were analyzed using the comparative cycle threshold (Ct) method. Relative quantification was carried out by calculating Ct to determine the fold difference in gene expression [ΔCt target – ΔCt calibrator]. The relative level was determined as 2_ΔΔCT.
Metabolite analyses and quantification
Secologanin and MIA were extracted as described earlier by Kumar et al. (2018). HPLC (Model: SCL-10AVP, Shimadzu, Japan) equipped with a C18 symmetry reverse-phase column (5 μm, 250 × 4.6 mm; Waters, Milford, MA, USA) was used for analysis. Data were recorded at 238 nm for secologanin, and 254 nm for indole alkaloids. The samples were quantified in reference to the peak areas obtained from authentic standards (Sigma–Aldrich) and were expressed as relative content (%).
Statistical analysis
Average means, standard error (SE), and number of replicates (biological and technical) for each experiment were used to determine the statistical significance using GraphPad9 Prism software. The statistical significance of differences between control and treated samples was tested using one-way and two-way ANOVA with Sidak's test.
Accession numbers
Sequence data from this article can be found in the GenBank/EMBL data libraries under accession numbers listed in Supplementary Table S3.
Acknowledgments
D.P.B. and D.A.N. thank Dr. Ajit K. Shasany for hosting D.P.B. in his lab for short duration during the AcSIR course work. The authors are thankful to Dr. Ramu Vemana for sparing pDEST22 and pDEST32 vectors. The authors also express their sincere gratitude to the Director, CSIR-CIMAP for support throughout the study. Institutional communication number for this article is CIMAP/PUB/2023/131.
Author contributions
D.P.B., A.S., P.L.C., I.C., L.B., A.K., and D.P. performed the experiments. D.P.B., A.S., P.L.C., I.C., L.B., A.K.T., A.R., S.C.V., E.D., V.C., and D.A.N. analyzed the data. D.A.N. conceived and coordinated the research. D.P.B., A.S., A.R., and D.A.N. wrote the manuscript.
Supplementary data
The following materials are available in the online version of this article.
Supplementary Figure S1. The MIA biosynthetic pathway in Madagascar periwinkle (C. roseus) leaves.
Supplementary Figure S2. Schematic gene structure of CrROPs in C. roseus genome.
Supplementary Figure S3. Heat map showing the in silico expression profile of CrROPs, CrPGGT, and CrGGPPS2.
Supplementary Figure S4. SDS–PAGE analysis of recombinant CrROPs and their GTPase activity assay.
Supplementary Figure S5. In silico analysis of protein–protein interaction between CrPGGT-I and CrROP2 or CrROP3 or CrROP5.
Supplementary Figure S6. Schematics of (i) pTRV1, (ii) pTRV2, (iii) pBI121- and (iv) pET28a-derived constructs used in the study.
Supplementary Figure S7. PCR-screening of plants generated from seeds of in planta transformed T0CrROP2 and CrROP5 plants.
Supplementary Figure S8. Protein–protein interaction analysis of CrROP3 and CrROP5 with different TFs.
Supplementary Table S1. In silico subcellular localization prediction of CrROP2, CrROP3, and CrROP5 using different software tools.
Supplementary Table S2. List of oligonucleotide primers used in this study.
Supplementary Table S3. Accession numbers and gene annotations of the sequences used in phylogenetic analysis.
Funding
This work was partly supported by Council of Scientific and Industrial Research (CSIR) funded FBR project MLP0003 to D.A.N. D.P.B. and A.S. were the recipients of a research fellowship from University Grants Commission (UGC). D.P. was the recipient of a research fellowship from Department of Biotechnology (DBT).
Data availability
Data supporting this manuscript are provided in the main text and supplementary file. Any additional data can be made available upon request from corresponding author.
Dive Curated Terms
The following phenotypic, genotypic, and functional terms are of significance to the work described in this paper:
References
Author notes
Dikki Pedenla Bomzan and Anuj Sharma contributed equally.
The author responsible for distribution of materials integral to the findings presented in this article in accordance with the policy described in the Instructions for Authors (https://dbpia.nl.go.kr/plphys/pages/General-Instructions) is Dinesh A. Nagegowda.
Conflict of interest statement. Authors declare no conflict of interest.
