


Abstract
Auxin, a pivotal regulator of diverse plant growth processes, remains central to development. The auxin-responsive genes auxin/indole-3-acetic acids (AUX/IAAs) are indispensable for auxin signal transduction, which is achieved through intricate interactions with auxin response factors (ARFs). Despite this, the potential of AUX/IAAs to govern the development of the most fundamental biological unit, the single cell, remains unclear. In this study, we harnessed cotton (Gossypium hirsutum) fiber, a classic model for plant single-cell investigation, to determine the complexities of AUX/IAAs. Our research identified 2 pivotal AUX/IAAs, auxin resistant 2 (GhAXR2) and short hypocotyl 2 (GhSHY2), which exhibit opposite control over fiber development. Notably, suppressing GhAXR2 reduced fiber elongation, while silencing GhSHY2 fostered enhanced fiber elongation. Investigating the mechanistic intricacies, we identified specific interactions between GhAXR2 and GhSHY2 with distinct ARFs. GhAXR2's interaction with GhARF6-1 and GhARF23-2 promoted fiber cell development through direct binding to the AuxRE cis-element in the constitutive triple response 1 promoter, resulting in transcriptional inhibition. In contrast, the interaction of GhSHY2 with GhARF7-1 and GhARF19-1 exerted a negative regulatory effect, inhibiting fiber cell growth by activating the transcription of xyloglucan endotransglucosylase/hydrolase 9 and cinnamate-4-hydroxylase. Thus, our study reveals the intricate regulatory networks surrounding GhAXR2 and GhSHY2, elucidating the complex interplay of multiple ARFs in AUX/IAA-mediated fiber cell growth. This work enhances our understanding of single-cell development and has potential implications for advancing plant growth strategies and agricultural enhancements.
Introduction
Cotton (Gossypium hirsutum) fibers, comprising ∼95% of textile industry fibers utilization, are derived from single-celled trichomes originating from the cotton seed epidermis. A comprehensive understanding of cotton fiber development encompasses 4 interwoven stages: initiation, elongation, secondary cell wall (SCW) biosynthesis, and maturation (Huang et al. 2021). Fiber initiation shapes the lint percentage and seed coat fibers, which are vital for cotton fiber yield. The elongation stage decisively influences mature fiber length, a hallmark of cotton fiber quality (Wang et al. 2021a, 2021b).
The plant hormone auxin orchestrates an array of growth and developmental facets (Cance et al. 2022). Auxin signaling regulates diverse cellular processes, including elongation, division, expansion, and differentiation across different developmental programs (Xu et al. 2019). At the molecular level, auxin triggers rapid gene induction, which relies on a derepression mechanism (Wang and Estelle 2014). The transcriptional silencing of auxin-regulated genes in the absence of auxin hinges on the repressive function of Auxin/indole-3-acetic acid (Aux/IAA) proteins (Weijers and Wagner 2016). Aux/IAAs form complexes with auxin response factor (ARF) transcription factors, inhibiting downstream gene transcription. The binding of auxin to a coreceptor complex, involving TRANSPORT INHIBITOR RESISTANT 1/AUXIN F-BOX (TIR1/AFB) F-box and an Aux/IAA protein, triggers Aux/IAA protein degradation, thereby influencing ARF-mediated gene transcription (Lakehal et al. 2019). Notably, auxin biosynthesis in the ovule epidermis substantially influences cotton fiber development, enhancing both yield and quality (Zhang et al. 2011). While auxin’s importance in cotton fiber development is established, the precise role of Aux/IAA proteins remains enigmatic.
Initially characterized as swiftly induced auxin-responsive genes, Aux/IAA proteins comprise 4 conserved motifs—domains I, II, III, and IV—potentially facilitating dimerization through domains III and IV (Reed 2001). ARFs, pivotal transcription factors regulating the expression of auxin response genes (Cance et al. 2022), interact with auxin response elements (AuxREs, TGTCNN) on genes, dictating specific auxin-related cellular responses (Guilfoyle and Hagen 2007; Freire-Rios et al. 2020; Lanctot et al. 2020). ARFs typically possess 3 functional domains: an N-terminal DNA binding domain (DBD), a middle region (MR) governing transcriptional activation/suppression, and C-terminal dimerization domains (CTD) crucial for ARF- Aux/IAA dimer formation (Gray et al. 2001; Freire-Rios et al. 2020).
Distinct Aux/IAA-ARF modules govern various auxin-responsive genes and their corresponding developmental processes. The Aux/IAA9-ARF5 module orchestrates auxin-linked wood formation via HD-ZIP III transcription factors in (Populus cathayana) poplar (Xu et al. 2019). The IAA13-ARF19-LBD cascade contributes to rice (Oryza sativa) root aerenchyma formation (Yamauchi et al. 2019). Cooperating Aux/IAA-ARF cascades regulate lateral root development (Goh et al. 2012), while shoot apex patterning hinges on localized Aux/IAA-ARF network properties (Vernoux et al. 2011). IAA33 interaction with ARF10 and ARF16 influences root distal stem cell identity and dampens auxin signaling (Lv et al. 2020). MdIAA121 interaction with MdARF13 regulates apple anthocyanin biosynthesis (Wang et al. 2018), underscoring distinct Aux/IAA-ARF modules governing diverse auxin-responsive genes and developmental processes.
Both cotton fiber cells and root hair cells are single epidermal cells that initiate from epidermal cells from ovules and roots (Li et al. 2015; Lv et al. 2016; Xiao et al. 2018). The intriguing parallel between the differentiation of epidermal cells into both cotton fibers and root hairs has ignited speculation about shared regulatory genes influencing these processes (Hou et al. 2022). Notably, 2 pivotal AUX/IAA participants, auxin resistant 2 and short hypocotyl 2 (AtAXR2 and AtSHY2), have been recognized for their roles in root hair development in Arabidopsis thaliana (Nagpal et al. 2000; Knox et al. 2003). Yet, the precise involvement of AXR2 and SHY2 in cotton fiber development remains an enigma. In this study, we delve into the intricacies of cotton fiber development by identifying and characterizing the counterparts of AtAXR2 and AtSHY2 in cotton, GhAXR2 and GhSHY2. Our investigation unveils the opposite roles of GhAXR2 and GhSHY2 in modulating the development of cotton fiber cells. Further investigations unveiled the intricate choreography underlying these regulatory interactions. GhARF6-1 and GhARF23-2 emerged as direct binders to the constitutive triple response 1 (GhCTR1) promoter, orchestrating its transcriptional inhibition. In contrast, GhARF7-1 and GhARF19-1 emerged as direct influencers, binding to the promoters of xyloglucan endotransglucosylase/hydrolase 9 (GhXTH9) and cinnamate-4-hydroxylase (GhC4H) and fueling their transcriptional activation. In essence, our research bridges the gap between root hair and cotton fiber development by unveiling the pivotal roles of GhAXR2 and GhSHY2 in orchestrating intricate developmental pathways. This study not only expands our understanding of plant cellular differentiation but also underscores the intricate interplay of regulatory genes, providing promising insights that could reshape future approaches to enhancing cotton fiber yield and quality.
Results
Identification and characterization of GhAXR2 and GhSHY2 in cotton
In our pursuit to unveil AUX/IAA members in cotton, we employed the local BLASTP program, utilizing 34 AtAUX/IAA proteins as reference queries. This endeavor led to the identification of 84 GhAUX/IAA proteins within G. hirsutum (Supplementary Table S1). Subsequent collinearity analysis illuminated the syntenic relationship between multiple AUX/IAA members in Gossypium arboreum and Gossypium raimondii, suggesting a shared lineage with G. hirsutum or Gossypium barbadense (Supplementary Fig. S1). Further sequence analysis divulged that AUX/IAA members with close evolutionary proximity exhibited higher structural similarity in nucleic acid and protein sequences (Supplementary Fig. S2). Phylogenetic analysis revealed a compelling parallel: 6 GhAUX/IAAs converged with AtAXR2, while 10 GhAUX/IAAs clustered with AtSHY2 (Supplementary Figs. S3, and S4, A and B).
Our exploration extended to the expression dynamics of these 16 GhAUX/IAA genes across various developmental stages of ovules and fibers. Impressively, GhIAA7A-2, referred to as GhAXR2 in our research, showcased the most pronounced expression within fibers, mirroring notable sequence resemblance to GhIAA7D-1 (Supplementary Fig. S5, A and C). Meanwhile, GhIAA3A/D-1 and GhIAA3A/D-2 exhibited robust expression during fiber elongation stages (Supplementary Fig. S5B). Given the substantial sequence similarity between GhIAA3A/D-1 and GhIAA3A/D-2 (Supplementary Fig. S5D), we singled out GhIAA3A-1, henceforth designated as GhSHY2, for further comprehensive investigation.
Delving into the functional attributes of GhAXR2 and GhSHY2, we transiently introduced GhAXR2-GFP and GhSHY2-GFP fusion proteins, driven by the constitutive 35S promoter, into Nicotiana benthamiana leaves. The outcome distinctly highlighted predominant fluorescent signals localized within the nucleus (Supplementary Fig. S4C). Subsequent endeavors encompassed the generation of transgenic Arabidopsis seedlings expressing pGhAXR2:GUS and pGhSHY2:GUS constructs. Evidently, both GhAXR2 and GhSHY2 predominantly manifested expression within root tips and lateral roots (Supplementary Fig. S4, D and E).
Regulation of Arabidopsis root hair development by GhAXR2 and GhSHY2
AXR2 and SHY2 genes have been previously documented to exert pivotal roles in Arabidopsis root hair development (Nagpal et al. 2000; Knox et al. 2003). In our pursuit of affirming the functional parallels between GhAXR2 and GhSHY2 in cotton and their Arabidopsis counterparts, AtAXR2 and AtSHY2, we obtained axr2 and shy2 mutants alongside a spectrum of transgenic lines (Col-0/35S:GhAXR2, Col-0/35S:GhSHY2, axr2/35S:GhAXR2, and shy2/35S:GhSHY2). A comparative analysis of these constructs against wild-type plants (Col-0) illuminated intriguing patterns. Introducing GhAXR2 into Col-0 plants was associated with a remarkable augmentation in root hair length and root hair number. Conversely, the axr2 mutant exhibited reduced root hair length and count. Encouragingly, the overexpression of GhAXR2 within the axr2 mutant context led to a substantial restoration in both root hair length and number (Supplementary Fig. S6, A to C). A converse trend was observed with GhSHY2. Ectopic expression of GhSHY2 in Col-0 plants reduced root hair length and numbers. In contrast, the shy2 mutant displayed enhanced root hair length and abundance compared with the wild-type plants. Remarkably, introducing GhSHY2 into the shy2 mutant configuration induced a substantial escalation in both root hair length and number (Supplementary Fig. S6, D to F).
These findings collectively illuminate a compelling narrative: GhAXR2 and GhSHY2 mirror their Arabidopsis counterparts, AtAXR2 and AtSHY2, in orchestrating the intricate process of root hair development. The evident parallelism between these regulatory genes across species underscores the conservation of root hair developmental pathways, hinting at potential shared mechanisms underlying this critical facet of plant growth.
Opposite control of cotton fiber growth by GhAXR2 and GhSHY2
To investigate GhAXR2's influence on cotton fiber development, we examined the relative expression levels of GhAXR2 within fibers and ovules, spanning various developmental stages. Remarkably, GhAXR2 displayed high expression during the elongation phase of fibers (Fig. 1A). To dive deeper into GhAXR2's functional implications, we harnessed the power of gene silencing, employing GhAXR2-virus-induced gene silence (VIGS) cotton plants. This maneuver significantly curtailed the transcript levels of GhAXR2 within fiber cells (Fig. 1B), unleashing a cascade of effects. Evidently, the stature of GhAXR2-VIGS cotton plants stood notably diminished in comparison with their control counterparts (Supplementary Fig. S7). More compellingly, the fibers of these GhAXR2-silenced cotton plants manifested diminished length and a conspicuous reduction in the count of fiber cells, diverging from the scenario witnessed in control plants (Fig. 1, C to F).
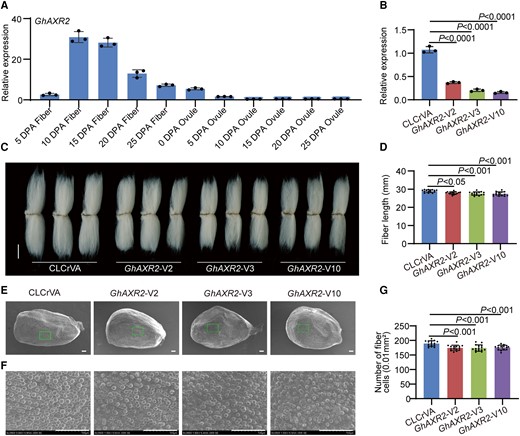
Positive regulation of cotton fiber cell initiation and elongation by GhAXR2. A) Relative expression level of GhAXR2 in cotton fibers and ovules at different developmental stages. DPA, day postanthesis. Error bars represent ±Sd (n = 3). B) Relative expression level of GhAXR2 in 10 DPA fibers from GhAXR2-VIGS plants. Error bars represent ±Sd (n = 3). GhAXR2-V, GhAXR2-VIGS cotton plants. CLCrVA, cotton plants transformed with CLCrVA plasmids (control). The P values were calculated using an unpaired 2-tailed Student’s t test. C) Phenotypes of mature fibers from GhAXR2-VIGS plants. Images were digitally extracted for comparison. Scale bar = 10 mm. D) Statistical analysis of fiber length in C). Error bars represent ±Sd (n = 15). Statistical significance was analyzed by 1-way ANOVA followed by Duncan's multiple comparison test (P < 0.05 or P < 0.001). E) Phenotypes of initiating fibers with full scanned from 0 DPA ovules of GhAXR2-VIGS cotton plants. Scale bar = 100 μm. F) Phenotypes of initiating fibers with specific location from 0 DPA ovules of GhAXR2-VIGS cotton plants. Scale bar = 100 μm. G) Statistical analysis of the number of initiating fibers in F). Error bars represent ±Sd (n = 15). Statistical significance was analyzed by 1-way ANOVA followed by Duncan's multiple comparison test (P < 0.001).
Along with our exploration of GhAXR2, we delved into the regulatory landscape of GhSHY2, scrutinizing its relative expression pattern across developmental stages of fibers. Impressively, akin to its counterpart, GhSHY2 also displayed a crescendo of expression during fiber elongation phases (Fig. 2A). Our journey ventured further as we employed a VIGS strategy to silence the GhSHY2 gene within cotton. This strategic maneuver instigated a significant attenuation in GhSHY2 transcript levels within cotton fiber cells (Fig. 2B). The repercussions, however, were intriguingly contrary to those observed with GhAXR2 silencing. The stature of GhSHY2-VIGS cotton plants exhibited a marked elevation in comparison with wild-type counterparts (Supplementary Fig. S8). Surpassing mere elevation in stature, the act of silencing GhSHY2 gene brought forth an unexpected extension in fiber length and a notable augmentation in initiating fiber cell count, charting an opposing trajectory from the norm (Fig. 2, C to F).
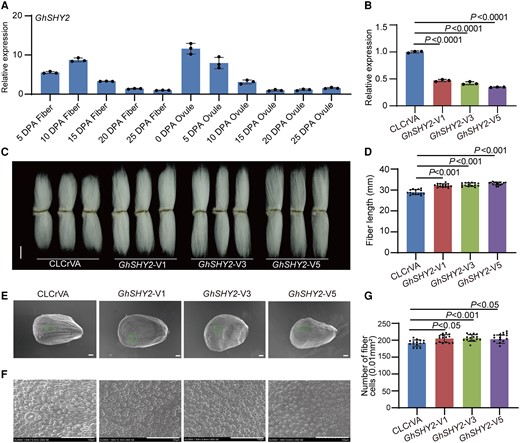
Negative regulation of cotton fiber cell initiation and elongation by GhSHY2. A) Relative expression level of GhSHY2 in cotton fibers and ovules at different developmental stages. DPA, day postanthesis. Error bars represent ±Sd (n = 3). B) Relative expression level of GhSHY2 in 10 DPA fibers from GhSHY2-VIGS plants. Error bars represent ±Sd (n = 3). GhSHY2-V, GhSHY2-VIGS cotton plants. CLCrVA, cotton plants transformed with CLCrVA plasmids (control). The P values were calculated using an unpaired 2-tailed Student’s t test. C) Phenotypes of mature fibers from GhSHY2-VIGS plants. Images were digitally extracted for comparison. Scale bar = 10 mm. D) Statistical analysis of fiber length in C). Error bars represent ±Sd (n = 15). Statistical significance was analyzed by 1-way ANOVA followed by Duncan's multiple comparison test (P < 0.001). E) Phenotypes of initiating fibers with full scanned from 0 DPA ovules of GhSHY2-VIGS cotton plants. Scale bar = 100 μm. F) Phenotypes of initiating fibers with specific location from 0 DPA ovules of GhSHY2-VIGS cotton plants. Scale bar = 100 μm. G) Statistical analysis of the number of initiating fibers in F). Error bars represent ±Sd (n = 15). Statistical significance was analyzed by 1-way ANOVA followed by Duncan's multiple comparison test (P < 0.05 or P < 0.001).
Collectively, the mosaic of evidence we have unveiled orchestrates a compelling symphony: GhAXR2 and GhSHY2, while both contributing to cotton fiber growth modulation, wield opposite roles. GhAXR2 emerges as a conductor of positive regulation, masterminding fiber cell elongation and initiation. GhSHY2, in contrast, wields its influence as a counterbalance, orchestrating negative regulation, thereby sculpting the delicate balance that underpins cotton fiber growth dynamics.
Deciphering GhARFs interaction with GhAXR2 and GhSHY2 in cotton
Within the intricate fabric of plant biology, the intertwined roles of ARFs and Aux/IAA proteins emerge as pivotal orchestrators of auxin-responsive transcription, their interplay forming the bedrock of auxin responses (Cance et al. 2022).
Our quest to uncover the intricate web of GhARFs engaging with GhAXR2 and GhSHY2 in cotton unfurled through meticulous yeast 2-hybrid assays, meticulously scrutinizing each candidate interaction. There are 28 GhARF gene pairs in G. hirsutum (Xiao et al. 2018), of which 21 GhARF genes were successfully amplified. Thus, we selected these 21 GhARFs to investigate their interaction with GhAXR2 or GhSHY2. As a result, 11 GhARFs (GhARF1-1, GhARF2-2, GhARF2-3, GhARF6-1, GhARF6-4, GhARF7-1, GhARF17-3, GhARF17-5, GhARF18-6, GhARF19-1, and GhARF23-2) were able to interact with GhAXR2 protein (Fig. 3A). To ensure the robustness of these findings, our investigative journey extended to biomolecular fluorescence complementation (BiFC) assays, corroborating the intricate dance of interactions through visual confirmation (Supplementary Fig. S9A). Moreover, the yeast 2-hybrid assays combined with BiFC assays demonstrated that 4 GhARFs (GhARF6-1, GhARF6-4, GhARF7-1, and GhARF19-1) directly interacted with GhSHY2 protein (Fig. 3B and Supplementary Fig. S9B).
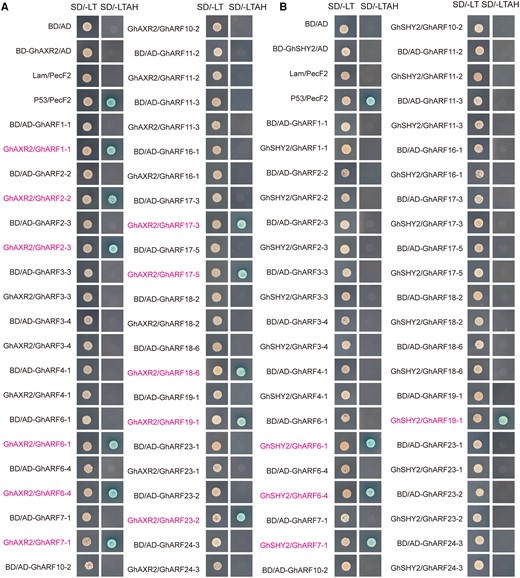
Yeast 2-hybrid assay showing the interaction between GhAXR2 or GhSHY2 with GhARFs. A) Systematic yeast 2-hybrid assay showing the interaction of GhAXR2 with 11 GhARF proteins. The interaction between GhARFs and GhAXR2 showed in SD/-LTAH column. AD, pGADT7; BD, pGBKT7; SD, synthetic defined; SD/-LT, SD/-Leu/-Trp; SD/-LTAH, SD/-Leu/-Trp/-Ade/-His. B) Systematic yeast 2-hybrid assay showing the interaction of GhSHY2 with 4 GhARF proteins. The interaction between GhARFs and GhSHY2 showed in SD/-LTAH column. P53/PecF2 is a positive interaction control. AD, pGADT7; BD, pGBKT7; SD, synthetic defined; SD/-LT, SD/-Leu/-Trp; SD/-LTAH, SD/-Leu/-Trp/-Ade/-His.
Based on the knowledge that GhARF2-2 and GhARF2-3 are part of the ARF2 cascade, the duo of GhARF6-1 and GhARF6-4 entwined in the ARF6 cascade, and the synchronized roles of GhARF17-3 and GhARF17-5 within the ARF17 cascade (Supplementary Fig. S10), we selected 8 GhARFs (GhARF1-1, GhARF2-2, GhARF6-1, GhARF7-1, GhARF17-5, GhARF18-6, GhARF19-1, and GhARF23-2) as potential candidates involved in the GhAXR2- or GhSHY2-mediated signaling pathway regulating fiber cell development.
Diverse roles of GhARFs in cotton fiber development
The intricate saga of cotton fiber development is intricately guided by a myriad of molecular actors. Among these, GhARFs emerge as key players, orchestrating a symphony of developmental processes. As we delved into the realm of GhARFs, their distinct roles and multifaceted influence on fiber growth came to light.
GhARF6-1, a stalwart highly expressed during the pivotal stages of fiber growth in 5 and 25 DPA fibers (Fig. 4A), emerged as an agent of contrast. To explore its function, we developed GhARF6-1-VIGS cotton plants, resulting in downaccumulation of GhARF6-1 transcripts in fibers (Fig. 4B). The plant heights in GhARF6-1-VIGS cotton plants were enhanced compared with the control plants (Supplementary Fig. S11), and silencing GhARF6-1 in cotton significantly improved the length of mature fibers and increased the number of initiating fibers (Fig. 4, C to F). Similarly, GhARF23-2 exhibited high expression throughout fiber development stages (Fig. 5A). Compared with the control plants, the expression level of GhARF23-2 was dramatically reduced in GhARF23-2-VIGS fiber cells (Fig. 5B). However, the plant heights of GhARF23-2-VIGS cotton plants were enhanced in contrast to control plants (Supplementary Fig. S12), and the length of mature fibers and the number of initiating fibers were significantly increased (Fig. 5, C to F). These results suggest that both GhARF6-1 and GhARF23-2 negatively regulate fiber cell elongation and initiation.
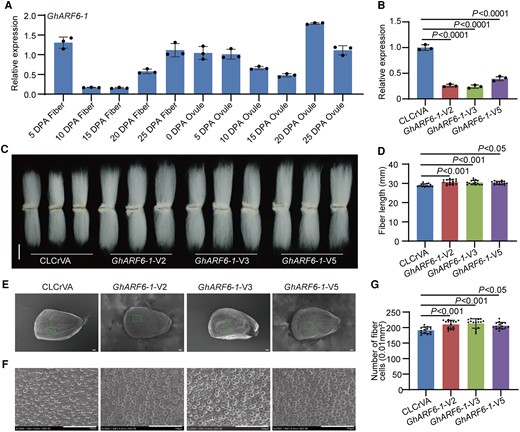
Negative regulation of cotton fiber cell initiation and elongation by GhARF6-1. A) Relative expression level of GhARF6-1 in cotton fibers and ovules at different developmental stages. DPA, days postanthesis. Error bars represent ±Sd (n = 3). B) Relative expression level of GhARF6-1 in 10 DPA fibers from GhARF6-1-VIGS plants. Error bars represent ±Sd (n = 3). GhARF6-1-V, GhARF6-1-VIGS cotton plants. CLCrVA, cotton plants transformed with CLCrVA plasmids (control). The P values were calculated using unpaired 2-tailed Student’s t test. C) Phenotypes of mature fibers from GhARF6-1-VIGS plants. Scale bar = 10 mm. D) Statistical analysis of fiber length in C). Error bars represent ±Sd (n = 15). Statistical significance was analyzed by 1-way ANOVA followed by Duncan's multiple comparison test (P < 0.05 or P < 0.001). E) Phenotypes of initiating fibers with full scanned from 0 DPA ovules of GhARF6-1-VIGS cotton plants. Scale bar = 100 μm. F) Phenotypes of initiating fibers with specific location from 0 DPA ovules of GhARF6-1-VIGS cotton plants. Scale bar = 100 μm. G) Statistical analysis of the number of initiating fibers in F). Error bars represent ±Sd (n = 15). Statistical significance was analyzed by 1-way ANOVA followed by Duncan's multiple comparison test (P < 0.05 or P < 0.001).
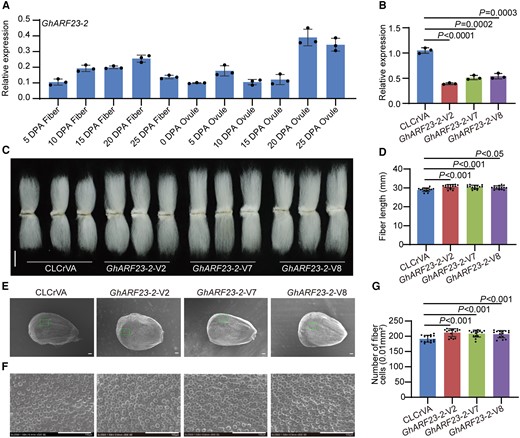
Negative regulation of cotton fiber cell initiation and elongation by GhARF23-2. A) Relative expression level of GhARF23-2 in cotton fibers and ovules at different developmental stages. DPA, days postanthesis. Error bars represent ±Sd (n = 3). B) Relative expression level of GhARF23-2 in 10 DPA fibers from GhARF23-2-VIGS plants. Error bars represent ±Sd (n = 3). GhARF23-2-V, GhARF23-2-VIGS cotton plants. CLCrVA, cotton plants transformed with CLCrVA plasmids (control). The P values were calculated using an unpaired 2-tailed Student’s t test. C) Phenotypes of mature fibers from GhARF23-2-VIGS plants. Scale bar = 10 mm. D) Statistical analysis of fiber length in C). Error bars represent ±Sd (n = 15). Statistical significance was analyzed by 1-way ANOVA followed by Duncan's multiple comparison test (P < 0.05 or P < 0.001). E) Phenotypes of initiating fibers with full scanned and specific location from 0 DPA ovules of GhARF23-2-VIGS cotton plants. Scale bar = 100 μm. F) Phenotypes of initiating fibers with specific location from 0 DPA ovules of GhARF23-2-VIGS cotton plants. Scale bar = 100 μm. G) Statistical analysis of the number of initiating fibers in F). Error bars represent ±Sd (n = 15). Statistical significance was analyzed by 1-way ANOVA followed by Duncan's multiple comparison test (P < 0.001).
GhARF7-1 was resplendent in its expression across fiber development stages (Fig. 6A). Its suppression through gene silencing (Fig. 6B) resulted in a diminishment of plant heights (Supplementary Fig. S13). The length of mature fibers and the number of initiating fibers were also reduced after GhARF7-1 gene silencing (Fig. 6, C to F). Similarly, GhARF19-1 showcased stability in expression across fiber development stages (Fig. 7A). Its gene silencing (Fig. 7B) reduced plant heights (Supplementary Fig. S14) and decreased fiber length and number of initiating fibers (Fig. 7, C to F). These results suggest that GhARF7-1 and GhARF19-1 positively regulate fiber cell elongation and initiation in cotton.
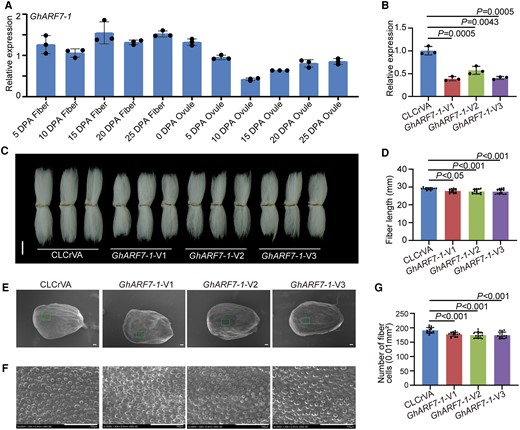
Positive regulation of cotton fiber cell initiation and elongation by GhARF7-1. A) Relative expression level of GhARF7-1 in cotton fibers and ovules at different developmental stages. DPA, days postanthesis. Error bars represent ±Sd (n = 3). B) Relative expression level of GhARF7-1 in 10 DPA fibers from GhARF7-1-VIGS plants. Error bars represent ±Sd (n = 3). GhARF7-1-V, GhARF7-1-VIGS cotton plants. CLCrVA, cotton plants transformed with CLCrVA plasmids (control). The P values were calculated using an unpaired 2-tailed Student’s t test. C) Phenotypes of mature fibers from GhARF7-1-VIGS plants. Images were digitally extracted for comparison. Scale bar = 10 mm. D) Statistical analysis of fiber length in C). Error bars represent ±Sd (n = 15). Statistical significance was analyzed by 1-way ANOVA followed by Duncan's multiple comparison test (P < 0.05 or P < 0.001). E) Phenotypes of initiating fibers with full scanned and specific location from 0 DPA ovules of GhARF7-1-VIGS cotton plants. Scale bar = 100 μm. F) Phenotypes of initiating fibers with specific location from 0 DPA ovules of GhARF7-1-VIGS cotton plants. Scale bar = 100 μm. G) Statistical analysis of the number of initiating fibers in F). Error bars represent ±Sd (n = 15). Statistical significance was analyzed by 1-way ANOVA followed by Duncan's multiple comparison test (P < 0.001).
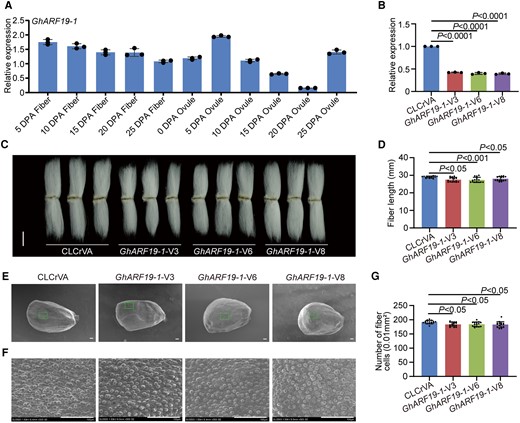
Positive regulation of cotton fiber cell initiation and elongation by GhARF19-1. A) Relative expression level of GhARF19-1 in cotton fibers and ovules at different developmental stages. DPA, days postanthesis. Error bars represent ±Sd (n = 3). B) Relative expression level of GhARF19-1 in 10 DPA fibers from GhARF19-1-VIGS plants. Error bars represent ±Sd (n = 3). GhARF19-1-V, GhARF19-1-VIGS cotton plants. CLCrVA, cotton plants transformed with CLCrVA plasmids (control). The P values were calculated using an unpaired 2-tailed Student’s t test. C) Phenotypes of mature fibers from GhARF19-1-VIGS plants. Images were digitally extracted for comparison. Scale bar = 10 mm. D) Statistical analysis of fiber length in C). Error bars represent ±Sd (n = 15). Statistical significance was analyzed by 1-way ANOVA followed by Duncan's multiple comparison test (P < 0.05 or P < 0.001). E) Phenotypes of the number of initiating fibers with full scanned from 0 DPA ovules of GhARF19-1-VIGS cotton plants. Scale bar = 100 μm. F) Phenotypes of the number of initiating fibers with specific location from 0 DPA ovules of GhARF19-1-VIGS cotton plants. Scale bar = 100 μm. G) Statistical analysis of the number of initiating fibers in F). Error bars represent ±Sd (n = 15). Statistical significance was analyzed by 1-way ANOVA followed by Duncan's multiple comparison test (P < 0.05).
GhARF1-1 was highly expressed in fibers during the elongation stage (Supplementary Fig. S15A). Through meticulous gene silencing using the VIGS strategy, we embarked on an exploration of its role (Supplementary Fig. S15B). However, our endeavors revealed a silent symphony—no discernible shifts in mature fiber length or the initiation count were observed in GhARF1-1-VIGS cotton, offering a glimpse into its subdued influence on fiber cell elongation and initiation (Supplementary Fig. S15, C to F). These results suggest that GhARF1-1 emerges as a muted player and may not affect fiber cell elongation and initiation.
GhARF2-2 transcripts were highly abundant in 25 DPA ovules (Supplementary Fig. S16A). Silencing GhARF2-2 in cotton significantly reduced the transcripts of GhARF2-2 within fibers (Supplementary Fig. S16B). Mature cotton fiber length exhibited an increase, while the initiation of fiber cells witnessed a decrease, hinting at GhARF2-2's unique interplay as a regulator of fiber cell elongation and initiation (Supplementary Fig. S16, C to F).
GhARF17-5 was expressed prominently amidst 15 DPA ovules (Supplementary Fig. S17A). Strategic gene silencing revealed its control over fiber development: transcripts of GhARF17-5 in fibers had a significant reduction (Supplementary Fig. S17B). The decrease in mature cotton fiber length and initiation count further affirmed GhARF17-5's role as a conductor in fiber cell elongation and initiation (Supplementary Fig. S17, C to F). These results indicate that GhARF17-5 positively regulates fiber cell elongation and initiation.
GhARF18-6 displayed pronounced presence during 15 and 20 DPA ovules (Supplementary Fig. S18A). Through meticulous gene silencing, GhARF18-6 transcripts were downaccumulated within fiber cells (Supplementary Fig. S18B). Fiber length was reduced, while the numbers of initiating fiber cells were enhanced from GhARF18-6 gene silencing in cotton (Supplementary Fig. S18, C to F). These results suggest that GhARF18-6 positively regulates fiber cell elongation but negatively controls fiber cell initiation.
The transcriptional regulators, AUX/IAA proteins, deftly navigate the transcription of downstream target genes by direct interplaying with ARF proteins. The degradation of AUX/IAA initiates the liberation of ARF, triggering activation or inhibition of auxin-induced gene expression (Kong et al. 2016). This elegant interplay unravels an intriguing dichotomy, with AUX/IAAs and their corresponding ARFs orchestrating opposing movements in the grand ballet of plant growth and development. GhARF6-1, GhARF23-2, and GhAXR2 intricately thread through fiber elongation under GhAXR2, while GhARF7-1, GhARF19-1, and GhSHY2 deftly navigate initiation through GhSHY2. GhARF6-1 and GhARF23-2 take their place as the interacting partners in the GhAXR2-mediated fiber cell development saga, while GhARF7-1 and GhARF19-1 assume their roles in steering the ship of GhSHY2-mediated fiber cell initiation. This symphonic interplay embodies the essence of AUX/IAA-ARF dynamics, where harmony emerges from their juxtaposed yet harmonious functions. Moreover, the ARF family was reported to dimerize to bind to DNA efficiently (Boer et al. 2014). We investigated whether these 4 GhARFs interact with each other via split luciferase complementation assay and yeast 2-hybrid assay. The results showed that these 4 ARFs are able to form the homodimers (Supplementary Fig. S19). In addition, GhARF6-1 directly interacts with GhARF23-2, and GhARF7-1 can interact with GhARF19-1 to form the heterodimers, respectively (Supplementary Fig. S19).
There are 5 active ARFs (AtARF5-8, AtARF19) and 17 repressive ARFs (AtARF1-4, AtARF9-18, AtARF2-22) in Arabidopsis (Guilfoyle and Hagen 2007; Li et al. 2023). In this study, GhARF7-1 and GhARF19-1, active ARFs in cotton, are in the same branch of active AtARFs in the phylogenetic tree (Supplementary Fig. S10). GhARF6-1 and GhARF23-2 are considered as repressive ARFs in cotton, of which GhARF23-2 is in the same branch of repressive ARFs (AtARF10 and AtARF16) according to the phylogenetic tree. However, GhARF6-1, a repressive ARF, has the closest phylogenetic relationship with AtARF6, an active ARF from Arabidopsis (Supplementary Fig. S10). We speculate that ARF6 might have undergone functional differentiation in cotton and Arabidopsis. Furthermore, conserved motif distribution showed that a special motif is only found in 2 active ARFs (GhARF7-1 and GhARF19-1) (Supplementary Fig. S20), implying that this motif might be crucial for active ARF.
Identification of downstream genes of GhARF6-1, GhARF23-2, GhARF7-1, and GhARF19-1
In a quest to illuminate the genetic pathways orchestrated by GhARFs in concert with GhAXR2 and GhSHY2, we conducted a transcriptomic analysis of 10 DPA fibers from GhAXR2-VIGS and GhSHY2-VIGS cotton plants. A total of 1,185 and 813 differentially expressed genes (DEGs) were identified in GhAXR2-VIGS and GhSHY2-VIGS cotton fibers, respectively (Supplementary Fig. S21, A to C, and Tables S2 and S3). Among these DEGs, 783 downregulated genes in GhAXR2-VIGS cotton fibers and 777 upregulated genes in GhSHY2-VIGS cotton fibers were selected for further GO and KEGG enrichment analysis (Supplementary Fig. S21, D to G). We then examined the expression patterns of these enriched genes in fibers across different developmental stages and analyzed the distribution of AuxRE cis-elements in their promoter regions. As a result, we identified 18 genes in GhAXR2-VIGS cotton fibers and 19 genes in GhSHY2-VIGS cotton fibers that were upregulated in fibers and contained AuxRE cis-elements in their promoters (Supplementary Tables S4 and S5). These enriched genes from GhAXR2-VIGS and GhSHY2-VIGS cotton fibers were further selected as candidate downstream targets of GhARF6-1, GhARF23-2, GhARF7-1, and GhARF19-1.
We examined the relative expression levels of these candidate genes across fibers from a spectrum of cotton plants—GhAXR2-VIGS, GhARF6-1-VIGS, GhARF23-2-VIGS, GhSHY2-VIGS, GhARF7-1-VIGS, and GhARF19-1-VIGS. Among the enriched candidates from GhAXR2-VIGS plants, 16 genes showed downregulation following the silencing of GhAXR2 (Supplementary Fig. S22). Among these, 9 genes were upregulated in GhARF6-1-VIGS cotton fibers, 6 genes were upregulated in GhARF23-2-VIGS cotton fibers, and 4 genes (GhPER64, GhCTR1, GhHSL1, and GhWRKY46) were upregulated in both GhARF6-1-VIGS and GhARF23-2-VIGS cotton fibers (Supplementary Figs. S23 and S24). We considered these 4 downstream target genes of GhARF6-1 and GhARF23-2 in the regulation of cotton fiber development.
To characterize the interaction between GhARF6-1 or GhARF23-2 and the promoters of GhPER64, GhCTR1, GhHSL1, and GhWRKY46, we performed yeast 1-hybrid (Y1H) assays. Both GhARF6-1 and GhARF23-2 interacted with the GhCTR1 promoter (Fig. 8A). The N. benthamiana transient expression assay also confirmed the interaction between GhARF6-1, GhARF23-2, and the GhCTR1 promoter (Fig. 8, B to E). It was reported that ARFs bind to the AuxRE cis-element (TGTCNN) in the promoters of target genes (Cherenkov et al. 2018). The GhCTR1 gene promoter contains 2 ARF-binding sites, named S1 and S2. We further performed Y1H assays to determine which binding site is responsible for GhARF6-1 and GhARF23-2. The results showed that when S2 was mutated, GhARF6-1 and GhARF23-2 were not able to bind to the promoter of the GhCTR1 gene (Fig. 8F), which was further confirmed by the N. benthamiana transient expression assay (Fig. 8, G to J). Moreover, electrophoretic mobility shift assay (EMSA) showed that GhARF6-1 and GhARF23-2 proteins had a binding affinity for the GhCTR1 promoter fragment containing the second AuxRE cis-element (Fig. 8, K to N). These results suggest that GhARF6-1 and GhARF23-2 interact with the GhCTR1 promoter by directly binding to the second AuxRE cis-element in the promoter region.
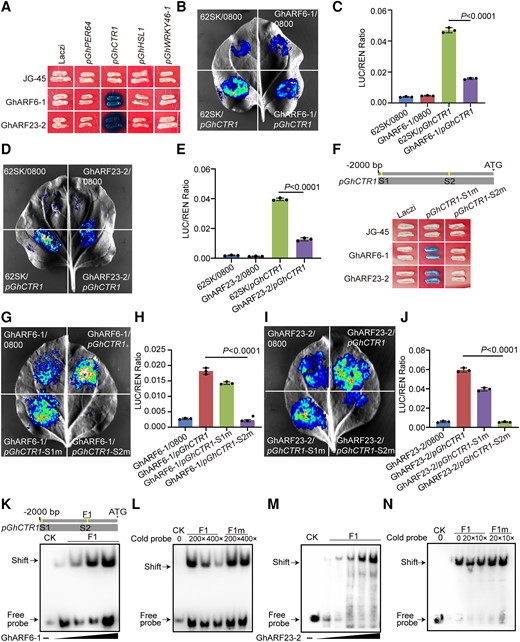
GhCTR1 is a downstream target of GhARF6-1 and GhARF23-2. A) Y1H assay showing that GhARF6-1 and GhARF23-2 directly bind to the promoter of GhCTR1. JG-45, empty pJG-45 vector without inserted protein; Laczi, empty pLaczi vector without inserted promoter. B)N. benthamiana transient expression assay showing the binding of GhARF6-1 to GhCTR1 promoter. C) Quantification of LUC activity in B). The expression of REN is used as an internal control. Mean values ± Sd (n = 3) are shown. The expression of REN was used as internal control. LUC, luciferase; REN, renilla. The P values were calculated using an unpaired 2-tailed Student’s t test. D)N. benthamiana transient expression assay showing the binding of GhARF23-2 to GhCTR1 promoter. E) Quantification of LUC activity in D). The expression of REN is used as an internal control. Mean values ± Sd (n = 3) are shown. The expression of REN was used as internal control. LUC, luciferase; REN, renilla. The P values were calculated using an unpaired 2-tailed Student’s t test. F) Y1H assay showing that GhARF6-1 and GhARF23-2 directly bind to the second ARF-binding site (S2) in the promoter of GhCTR1. JG-45, empty pJG-45 vector without inserted protein; Laczi, empty pLaczi vector without inserted promoter. S1 and S2 are predicted ARF-binding sites. m, mutant. G)N. benthamiana transient expression assay showing the binding of GhARF6-1 to the S2 binding site in the promoters of GhCTR1. H) Quantification of LUC activity in G). The expression of REN is used as an internal control. Mean values ± Sd (n = 3) are shown. The expression of REN was used as internal control. LUC, luciferase; REN, renilla. The P values were calculated using an unpaired 2-tailed Student’s t test. I)N. benthamiana transient expression assay showing the binding of GhARF23-2 to the S2 binding site in the promoters of GhCTR1. J) Quantification of LUC activity in I). The expression of REN is used as an internal control. LUC, luciferase; REN, renilla. Mean values ± Sd (n = 3) are shown. The expression of REN was used as internal control. The P values were calculated using an unpaired 2-tailed Student’s t test. K) and M) EMSA showing that GhARF6-1 (K) and GhARF23-2 (M) directly bind to the F1 fragment of the GhCTR1 promoter. CK, control. L) and N) Competitive EMSA using a biotin-labeled F1 fragment of the GhCTR1 incubated with GhARF6-1 (L) and GhARF23-2 (N), competing with different concentrations of cold probes (without biotin label) containing the intact or mutated binding site. CK, control; m, mutant.
The enriched candidates from GhSHY2-VIGS cotton plants were all upregulated in GhSHY2-VIGS cotton fibers (Supplementary Fig. S25). Among them, 7 genes were downregulated in GhARF7-1-VIGS cotton fibers, 5 genes were downregulated in GhARF19-1-VIGS cotton fibers, and 3 genes (GhHSP18.5, GhHSP17.3B, and GhXTH9) were downregulated in both GhARF7-1-VIGS and GhARF19-1-VIGS cotton fibers (Supplementary Figs. S26 and S27). Therefore, these 3 genes (GhHSP18.5, GhHSP17.3B, and GhXTH9) were selected as candidate downstream targets of GhARF7-1 and GhARF19-1. In addition, as C4H was reported to function in cell wall biosynthesis (Schilmiller et al. 2009), we also selected GhC4H as another downstream target candidate of GhARF7-1 and GhARF19-1.
To investigate the binding ability of GhARF7-1 and GhARF19-1 transcription factors to the promoters of GhHSP18.5, GhHSP17.3B, GhXTH9, and GhC4H, we performed Y1H assays. Both GhARF7-1 and GhARF19-1 were found to bind to the GhXTH9 promoter, while only GhARF7-1 bound to the GhC4H promoter (Fig. 9A). The N. benthamiana transient expression assay revealed that GhARF7-1 and GhARF19-1 interacted with the promoter of GhXTH9 and GhARF7-1 interacted with the promoter of GhC4H (Fig. 9, B to G). We further divided the GhXTH9 and GhC4H promoters into 3 fragments and performed Y1H assays. The results showed that GhARF7-1 and GhARF19-1 bound to the P3 fragment of the GhXTH9 promoter and that GhARF7-1 bound to the F3 fragment of the GhC4H promoter (Fig. 9, H and I). The P3 fragment of the GhXTH9 promoter and the F3 fragment of the GhC4H promoter contain 2 ARF-binding sites. The Y1H assay combined with N. benthamiana dual-luciferase (dual-LUC) assay confirmed that GhARF7-1 bound to the S2 site of the P3 fragment from the GhXTH9 promoter and S1 site of the F3 fragment from the GhC4H promoter and GhARF19-1 bound to the S2 site of the P3 fragment from the GhXTH9 promoter (Fig. 9, J to Q). Moreover, EMSA showed that the GhARF7-1 and GhARF19-1 proteins had a binding affinity for the GhXTH9 promoter fragment containing AuxRE cis-element (Fig. 9, R to U). These results confirm that GhARF7-1 interacts with GhXTH9 and GhC4H by directly binding to the specific AuxRE cis-element in their promoter regions and that GhARF19-1 interacts with GhXTH9 by binding to the specific AuxRE cis-element in its promoter.
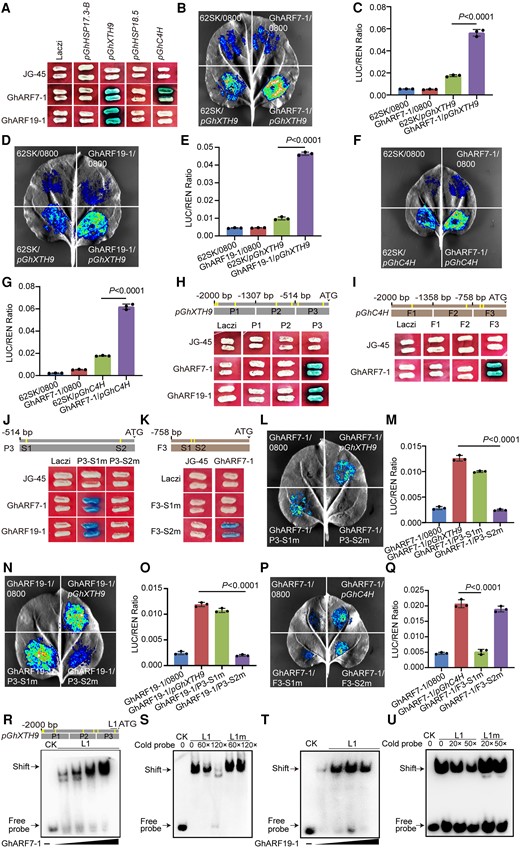
GhXTH9 and GhC4H are downstream targets of GhARF7-1 and GhARF19-1. A) Y1H assay showing that GhARF7-1 and GhARF19-1 directly bind to the promoter of GhXTH9 and GhC4H. JG-45, empty pJG-45 vector without inserted protein; Laczi, empty pLaczi vector without inserted promoter. B)N. benthamiana transient expression assay showing the binding of GhARF7-1 to GhXTH9 promoter. C) Quantification of LUC activity in B). The expression of REN was used as an internal control. Values given are mean ± Sd (n = 3). The expression of REN was used as internal control. LUC, luciferase; REN, renilla. The P values were calculated using unpaired 2-tailed Student's t test. D)N. benthamiana transient expression assay showing the binding of GhARF19-1 to GhXTH9 promoter. E) Quantification of LUC activity in D). The expression of REN was used as an internal control. Values given are mean ± Sd (n = 3). The expression of REN was used as internal control. LUC, luciferase; REN, renilla. The P values were calculated using unpaired 2-tailed Student's t test. F)N. benthamiana transient expression assay showing the binding of GhARF7-1 to GhC4H promoter. G) Quantification of LUC activity in F). The expression of REN was used as an internal control. LUC, luciferase; REN, renilla. Values given are mean ± Sd (n = 3). The expression of REN was used as internal control. The P values were calculated using unpaired 2-tailed Student's t test. H) Y1H assay showing that GhARF7-1 and GhARF19-1 bind to P3 fragment of GhXTH9 promoter. JG-45, empty pJG-45 vector without inserted protein; Laczi, empty pLaczi vector without inserted promoter. P1 to P3, the 3 fragments of GhXTH9 promoter. I) Y1H assay showing that GhARF7-1 binds to F3 fragment of GhC4H promoter. JG-45, empty pJG-45 vector without inserted protein; Laczi, empty pLaczi vector without inserted promoter. F1 to F3, the 3 fragments of GhC4H promoter. J) Y1H assay showing that GhARF7-1 and GhARF19-1 bind to the second ARF-binding site (S2) in the promoter of GhXTH9. JG-45, empty pJG-45 vector without inserted protein; Laczi, empty pLaczi vector without inserted promoter. S1 and S2 are ARF-binding sites in P3 fragment of GhXTH9 promoter; m, mutant. K) Y1H assay showing that GhARF7-1 binds to the first ARF-binding site (S1) in the promoter of GhC4H. JG-45, empty pJG-45 vector without inserted protein; Laczi, empty pLaczi vector without inserted promoter. S1 and S2 are ARF-binding sites in F3 fragment of GhC4H promoter; m, mutant. L)N. benthamiana transient expression assay showing the binding of GhARF7-1 to the S2 binding site in the promoters of GhXTH9. M) Quantification of LUC activity in L). The expression of REN was used as an internal control. Values given are mean ± Sd (n = 3). The expression of REN was used as internal control. LUC, luciferase; REN, renilla. The P values were calculated using unpaired 2-tailed Student's t test. N)N. benthamiana transient expression assay showing the binding of GhARF19-1 to the S2 binding site in the promoters of GhXTH9. O) Quantification of LUC activity in N). The expression of REN was used as an internal control. Values given are mean ± Sd (n = 3). The expression of REN was used as internal control. LUC, luciferase; REN, renilla. The P values were calculated using unpaired 2-tailed Student's t test. P)N. benthamiana transient expression assay showing the binding of GhARF7-1 to the S1 binding site in the promoters of GhC4H. Q) Quantification of LUC activity in P). The expression of REN was used as an internal control. Values given are mean ± Sd (n = 3). The expression of REN was used as internal control. LUC, luciferase; REN, renilla. The P values were calculated using unpaired 2-tailed Student's t test. R) and T) EMSA showing that GhARF7-1 (R) and GhARF19-1 (T) directly bind to the F1 fragment of the GhXTH9 promoter. CK, control. S) and U) Competitive EMSA using a biotin-labeled F1 fragment of the GhXTH9 incubated with GhARF7-1 (S) and GhARF19-1 (U), competing with different concentrations of cold probes (without biotin label) containing the intact or mutated binding site. CK, control; m, mutant.
We performed a transient expression assay to investigate whether the interaction of GhAXR2 or GhSHY2 with GhARFs could compete with the binding activity to target gene promoters. The results showed that the ARFs directly bind to target gene promoters. However, GhAXR2 or GhSHY2 significantly reduced the binding activity of GhARFs on the LUC reporter gene driven by target gene promoters (Supplementary Fig. S28), indicating that GhAXR2 or GhSHY2 inhibits the binding of GhARFs to the corresponding target gene promoters.
Taken together, our findings identify 2 members of the GhAUX/IAA family, GhAXR2 and GhSHY2, oppositely regulate cotton fiber cell development. GhAXR2 interacts directly with GhARF6-1 and GhARF23-2, which further inhibits the transcription of the downstream target gene GhCTR1 by binding to the AuxRE cis-element in the promoter region. On the other hand, GhSHY2 negatively regulates fiber elongation and initiation by interacting with GhARF7-1 and GhARF19-1, which in turn activate the transcription of GhXTH9 and GhC4H by binding to the AuxRE cis-element in the promoter region (Fig. 10).
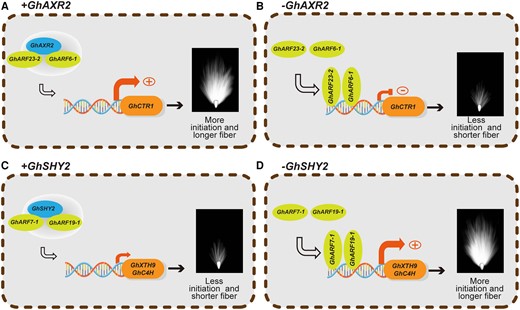
Schematic diagram illustrating the mechanistic framework of GhAXR2 and GhSHY2 signaling in the regulation of cotton fiber cell growth. When GhAXR2 is present, it binds to the promoter of 2 transcription repressors, GhARF23-2 and GhARF6-1, to remove GhARF23-2- and GhARF6-1-mediated transcription inhibition of GhCTR1 to promote cotton fiber initiation and elongation (A). When GhAXR2 is absent, GhARF23-2 and GhARF6-1 bind to promoter of GhCTR1 to repress its transcription, which leads to less fiber initiation and shorter fiber cells (B). When GhSHY2 is present, it binds to the promoter of 2 transcription activators, GhARF7-1 and GhARF19-1, to remove GhARF7-1- and GhARF19-1-mediated transcription activation of GhXTH9 and GhC4H, which further leads to less fiber initiation and shorter fiber cells (C). When GhSHY2 is absent, GhARF7-1 and GhARF19-1 bind to promoters of GhXTH9 and GhC4H to activate the transcription of these 2 target genes, which further results in increased fiber initiation and longer cotton fibers (D). Plus (+) sign in the circle stands for promoting gene transcription, plus (-) sign in the circle stands for inhibiting gene transcription.
Discussion
The AXR2 and SHY2 have been shown to regulate root hair growth in Arabidopsis (Nagpal et al. 2000; Knox et al. 2003). The axr2 mutant has shorter and less, while shy2 mutant has longer and more root hairs compared with Col-0; we found that GhAXR2 and GhSHY2 not only function in Arabidopsis root hair growth (Fig. 2) but also function in cotton root hair growth. Silencing GhAXR2 in cotton reduced the number and length of cotton root hair, while the root hairs got longer and denser when the transcripts of GhSHY2 were decreased in cotton (Supplementary Fig. S29). A cotton fiber cell is a single epidermal cell that initiated from the cotton seed coat, and a root hair is also a single cell that derived from the differentiation of epidermal cells (Li et al. 2015; Lv et al. 2016; Xiao et al. 2018). These results suggest that both root hairs and cotton fibers are similar models for studying single-cell elongation with similar regulatory mechanisms.
In our study, we found that 2 GhAUX/IAA members, GhAXR2 and GhSHY2, function oppositely in cotton fiber cell development: GhAXR2 promotes while GhSHY2 inhibits cotton fiber cell growth (Figs. 1 and 2). In our study, we conducted the systematic screening of GhARFs interacting with GhAXR2 and GhSHY2 and identified 11 GhARFs that interacted with GhAXR2 and 4 GhARFs that interacted with GhSHY2. Furthermore, we carried out a large-scale investigation of the gene function of cotton GhARFs via a VIGS strategy. The results showed that GhARF6-1, GhARF23-2, GhARF7-1, and GhARF19-1 regulate cotton fiber cell growth (Figs. 3 to 7). These results demonstrate that members of the same family may have opposite functions in the same regulatory pathways, a phenomenon observed in other studies as well. GhFP2 and GhACE1, 2 bHLH/HLH transcription factors, oppositely regulate fiber elongation in cotton (Lu et al. 2022). In Arabidopsis, TCP9 and TCP20 oppositely control leaf development via the jasmonate signaling pathway. Similarly, SD6 promotes seed dormancy in rice and wheat (Triticum aestivum), while ICE2 inhibits this process, even though both belong to the bHLH transcription factor family (Xu et al. 2019). These findings indicate that different members of the same family, despite having similar sequence structure characteristics, can undergo functional differentiation during evolution.
In this study, we identified GhARF6-1 and GhARF23-2 as interactors of GhAXR2 (Fig. 3, Supplementary Figs. S9 and S30) and found that GhCTR1 is a target gene of both GhARF6-1 and GhARF23-2. The GhCTR1 gene functions in the sugar signaling response in plants, and its mutation causes glucose insensitivity (Cheng et al. 2002; Arroyo et al. 2003). Fiber cell development is closely related to sugar signaling pathways, as 95% of the components in mature fibers are composed of cellulose, a polysaccharide (Haigler et al. 2012). Multiple studies have shown that cellulose synthesis is crucial for fiber cell development (Guo et al. 2022; Tian et al. 2022; Wen et al. 2022). The GhAXR2-GhARF6-1/GhARF23-2-GhCTR1 cascade might regulate fiber cell development through the cellulose biosynthesis pathway, which should be further verified with more experimental evidence.
GhARF7-1 and GhARF19-1, positively regulating fiber cell growth, can interact with GhSHY2 (Fig. 3, Supplementary Figs. S9 and S30). We further identified their direct downstream targets, GhXTH9 and GhC4H. XTHs are essential for cell wall biosynthesis, and XTH9 is highly expressed in lateral root primordia in Arabidopsis (Xu et al. 2019). Overexpression of XTH9 has been shown to enhance cotton fiber length in cotton (Lee et al. 2010). Lignin, a principal structural component of the plant cell wall, is synthesized from phenylpropanoid by C4H, the second enzyme in the biosynthesis pathway (Schilmiller et al. 2009). The ref3 mutant with missense mutations in the C4H gene exhibits a reduction in lignin content (Schilmiller et al. 2009). These results suggest that GhARF7-1 and GhARF19-1 might promote fiber development through GhXTH9- and GhC4H-mediated cell wall biosynthesis. Additionally, ARF7 and ARF19 belong to the same branch in both Arabidopsis and cotton (Supplementary Fig. S10). Although single mutants of either ARF7 or ARF19 display normal responses to auxin, the arf7/arf19 double mutant shows strong auxin resistance, indicating functional redundancy of ARF7 and ARF19 in Arabidopsis (Harper et al. 2000; Narise et al. 2010). Therefore, we speculate that simultaneous mutation of GhARF7-1 and GhARF19-1 in cotton may produce more severe defects in fiber cell growth. ARF proteins were able to form dimers to regulate downstream gene expression (Ulmasov et al. 1999). Our study showed that GhARF6-1, GhARF23-2, GhARF7-1, and GhARF19-1 form homodimers, GhARF6-1 directly interacts with GhARF23-2, and GhARF7-1 can interact with GhARF19-1 (Supplementary Fig. S16). We speculate that these homodimers or heterodimers enhance transcriptional inhibition or activation of downstream target genes, thus substantially affecting fiber development.
Auxin is one of the major phytohormones that triggers cell elongation and growth (Sauer et al. 2006; Hu et al. 2023). Multiple studies have reported that auxin acts as a positive regulator in fiber cell initiation and elongation processes (Chen and Guan 2011; Tian and Zhang 2021; Zhang et al. 2011; Zhu et al. 2022). Among the GhARF family members, only GhARF18 was reported to promote cotton fiber cell elongation (Zhu et al. 2022). In this work, we comprehensively characterized the role of GhARFs in cotton fiber cell development and identified more GhARFs (GhARF7-1, GhARF19-1, GhARF17-5, and GhARF18-6) that positively regulate fiber cell elongation. To date, no GhARFs are reported to inhibit cotton fiber cell growth. Our results revealed that 3 GhARFs (GhARF6-1, GhARF23-2, and GhARF2-2) negatively regulate cotton fiber development. Considering that 4 GhARF proteins promote fiber development and 3 GhARF proteins inhibit fiber development, we think that the promotion of cotton fiber growth by auxin may be dependent on the selectivity and balance of ARF proteins.
Materials and methods
Plant materials and growth conditions
Upland cotton (G. hirsutum) was grown in a greenhouse under the following conditions: 60% humidity, 30 °C temperature, and a 14 h light/10 h dark cycle. The Col-0, axr2 (WiscDsLoxHs091_09A), and shy2 (SALK_070904) mutants were obtained from the Arabidopsis Biological Resource Center. A. thaliana seeds were surface-sterilized with 75% (v/v) ethanol for 1 min and 10% (v/v) H2O2 for 5 min and then washed with sterile water 5 times. The sterilized Arabidopsis seeds were germinated on one-half strength MS medium at a temperature of 20 °C and a 16 h light/8 h dark cycle. Arabidopsis root hairs were investigated after 4 d.
VIGS assay
Fragments of the coding sequences of GhAXR2, GhSHY2, GhARF1-1, GhARF2-2, GhARF6-1, GhARF7-1, GhARF17-5, GhARF18-6, GhARF19-1, and GhARF23-2, with a length of 300 base pairs, were amplified and cloned into the pCLCrVA vector. The empty pCLCrVA vector was used as the control. The corresponding recombinant pCLCrVA and pCLCrVB vectors were introduced into Agrobacterium tumefaciens strain LBA4404, respectively. The Agrobacterium colonies containing the respective vectors were grown at 28 °C for 2 d. The cells were then collected and resuspended in an infiltration medium consisting of 10 mM MgCl2, 10 mM MES, and 200 mM acetosyringone. The Agrobacterium cells containing the pCLCrVA plasmids were mixed with an equal volume of Agrobacterium cells containing pCLCrVB and injected into cotyledons of 2-wk-old cotton seedlings. Primers used for this assay are listed in Supplementary Table S6.
GUS staining
The promoter sequences of GhAXR2 and GhSHY2, with lengths of 1,794 and 1,746 base pairs, were amplified and cloned into the pCAMBIA2300-GUS vector, respectively. The recombinant pCAMBIA2300-GUS vectors were introduced into the Agrobacterium strain GV3101 and then transformed into Arabidopsis (ecotype Col-0) to obtain pGhAXR2:GUS and pGhSHY2:GUS transgenic Arabidopsis plants. The GUS assay was performed as previously described by Hou et al. (2022). Transgenic Arabidopsis plants were incubated in GUS buffer (Coolaber, Beijing, China) by vacuum-infiltrating for 10 min and then incubated at 37 °C in the dark for 10 h. The seedlings were destained with 75% ethanol 5 times. The GUS signal was photographed using a stereomicroscope (Leica, M165FC, Germany). Primers used for this assay are listed in Supplementary Table S6.
Subcellular location
The coding sequences of GhAXR2 and GhSHY2 were amplified and cloned into the pCAMBIA2300-GFP vector. The recombinant pCAMBIA2300-GFP vectors were introduced into the Agrobacterium strain GV3101 and injected into N. benthamiana leaves. The transfected N. benthamiana plants were kept in the dark overnight and then moved to a greenhouse with 60% humidity, 30 °C temperature, and a 16 h light/8 h dark cycle for 2 days. GFP fluorescence signal was excited at 488 nm by laser confocal microscope (Olympus, FV 1200, Japan), and the laser intensity was about 10%, and the gain was <350 by 20× or 40× objectives. H2B nuclear localization fluorescence was excited at 594 nm. The fluorescence signals were detected using confocal laser scanning microscopy (Olympus, FV 1200, Japan). H2B was used as the nuclear marker. Three independent biological replicates were performed for all experiments. Primers used for this assay are listed in Supplementary Table S6.
Arabidopsis transformation
The coding sequences of GhAXR2 and GhSHY2 were amplified and cloned into the pCAMBIA2300 vector. The recombinant p35S:GhAXR2 and p35S:GhSHY2 vectors were introduced into the Agrobacterium strain GV3101, which was then transformed into Col-0 and axr2 or shy2 mutant Arabidopsis plants. The seeds were collected and screened on 1/2 MS agar medium supplemented with 50 μg/mL kanamycin. Pedigree selection and PCR analysis were used for further selection of transgenic Arabidopsis plants. Primers used for this assay are listed in Supplementary Table S6.
Scanning electron microscopy
Thirty 0-d postanthesis cotton ovules were collected to investigate fiber cell initiation. A scanning electron microscope (SU3500, Hitachi, Japan) was used to image the fiber initiation according to the standard method described in the instruction manual.
Yeast 2-hybrid assay
The coding sequences of GhAXR2, GhSHY2, and GhARF6-1, GhARF23-2, GhARF7-1, and GhARF19-1 were amplified and inserted into the prey vector pGADT7. The coding sequences of GhARFs were amplified and cloned into the pGBKT7 vector. The recombinant pGADT7 and pGBKT7 vectors were cotransformed into AH109 yeast cells and plated on SD/-Leu-Trp medium for 3 d at 30 °C. Interactions between the bait and prey proteins were further tested on SD/-Trp-His-Leu-Ade medium. Three independent biological replicates were performed for all experiments. Primers used for this assay are listed in Supplementary Table S6.
BiFC
The coding sequences of GhAXR2 and GhSHY2 were amplified and inserted into the pSPYCE vector, and the coding sequences of GhARFs were amplified and cloned into the pSPYNE vector. The recombinant pSPYCE and pSPYNE vectors were introduced into the Agrobacterium strain GV3101 and then injected into N. benthamiana leaves, as described previously (Sun et al. 2023). GFP fluorescence signal was excited at 488 nm by laser confocal microscope (Olympus, FV 1200, Japan), and the laser intensity was about 10%, and the gain was <350 by 20× or 40× objectives. H2B nuclear localization fluorescence was excited at 594 nm. Three independent biological replicates were performed for all experiments. Primers used for this assay are listed in Supplementary Table S6.
RNA isolation and quantitative real-time PCR analysis
Total RNA was extracted from cotton fibers and different tissues using an RNA extraction kit (DP441, Tiangen, Beijing, China). The extracted RNA (3 μg) was used for first-strand complementary DNA (cDNA) synthesis using a RevertAid First Strand cDNA Synthesis Kit (K1622, Thermo, Waltham, USA). qPCR analysis was performed using the Roche Light Cycle 480 II instrument (Roche, Basel, Switzerland). The reference gene GhUBQ7 (GenBank No. DQ116441.1) was used for normalization. Three independent biological replicates were performed for all experiments. The primers used are listed in Supplementary Table S6.
Transcriptomic analysis
Total RNA was extracted from 10-d postanthesis cotton fiber of GhAXR2 and GhSHY2 silencing plants. The extracted RNA (2 μg per sample) was used to construct RNA-seq libraries. DEGs were identified as genes with a fold change ≥ 2 and P value ≤ 0.05. Volcano plots were generated using ggplot2 3.2.0 (Gustavsson et al. 2022). Gene Ontology (GO) analysis was performed using topGO (Aibar et al. 2015), and KEGG analysis was performed using KOBAS 3.0 (Bu et al. 2021). Heatmaps were constructed using TBtools v1.098661 (Chen et al. 2020). The RNA-seq data for GhAXR2 and GhSHY2 silencing cotton plant fibers are in National Center for Biotechnology Information (NCBI) with accession number PRJNA967157.
Y1H assay
The coding sequences of GhARF6-1, GhARF23-2, GhARF7-1, and GhARF19-1 were amplified and cloned into the pJG-45 vector. The 2,000 bp promoter sequences of GhPER64, GhCTR1, GhHSL1, GhWRKY46, GhHSP17.3-B, GhXTH9, GhHSP18.5, GhC4H, and the corresponding promoter fragments were amplified and inserted into the pLacZi vector. The recombinant pJG-45 and pLacZi vectors were cotransformed into EGY48 yeast strain following the Yeast Protocols Handbook (BD Clontech). The transformants were selected and grown on SD/-Trp-Ura dropout media containing X-gal (5-bromo-4-chloro-3-indolyl-b-D-galactopyranoside). Primers used are listed in Supplementary Table S6.
EMSA
The promoter fragments from GhCTR1 or GhXTH9 with intact or mutated AuxRE cis-element were synthesized with biotin probes labeled. GhARF6-1, GhARF23-2, GhARF7-1, and GhARF19-1 proteins were expressed in BL21 Escherichia coli strain, respectively. Recombinant GhARF6-1, GhARF23-2, GhARF7-1, and GhARF19-1 proteins were purified using a His-tagged Fusion Protein Purification kit (Thermo Fisher Scientific) according to the manufacturer's instructions. EMSAs were performed using a Chemiluminescent EMSA Kit (Beyotime), and fluorescence was observed with an image scanner (Tanon). All primers used in this experiment are listed in Supplementary Table S6.
Split luciferase complementation assay
Split luciferase complementation assay was performed as reported (Chen et al. 2008). Briefly, the A. tumefaciens GV3101 strain (OD600 = 0.6 to 0.8) carrying GhARF6-1-nLUC and GhARF6-1-cLUC plasmids were coinfiltrated into young N. benthamiana leaves, which were exposed to weak light for 2 d. Thereafter, 1 mM luciferase substrate solution was sprayed onto leaves, and the fluorescence intensity was detected using a bioluminescence in vivo imaging and analysis system (NightSHADE LB985, Berthold Technologies).
Pull-down assay
GhAXR2 and GhSHY2 coding sequences were cloned into the pMBL vector with an MBP tag, and the coding sequences of the GhARF6-1, GhARF23-2, GhARF7-1 and GhARF19-1 were cloned into the pET28a vector with a His tag. GhAXR2, GhSHY2, GhARF6-1, GhARF23-2, GhARF7-1, and GhARF19-1 fusion proteins were expressed in BL21 E. coli grown at 16 °C in the presence of 0.1 mM IPTG (isopropyl β-D-1-thiogalactopyranoside). The primers used in this experiment are listed in Supplementary Table S6.
For the in vitro pull-down assays, 10 μg MBP tag-fused GhARF proteins were incubated with MBP-binding resin (GenScript, L0026, Nanjing, China) at 4 °C for 2 h. After the resin was washed with phosphate-buffered saline, 2 μg of purified His tag-fused GhARF proteins were added and incubated at 4 °C for 4 h. Then, the resin was washed more than 3 times with lysis buffer (25 mmol/L Tris, 150 mmol/L NaCl, 0.1% NP40, 0.1 g/mL lysozyme, 1 mmol/L PMSF, pH 7.5). The eluted proteins were analyzed by immunoblotting using anti-His (1:1,000, Sigma) and anti-MBP (1:1,000, Sigma) antibodies. An image scanner (Tanon 4800, Tanon, China) was used to detect the chemiluminescence signal.
Dual-LUC reporter assays
The coding sequences of GhARF6-1, GhARF23-2, GhARF7-1, and GhARF19-1 were amplified and inserted into the pGreenII 62-SK vector. The promoter sequences of GhCTR1, GhXTH9, GhC4H, and the corresponding promoter fragments were amplified and inserted into the pGreenII 0800-LUC vector. The recombinant pGreenII 62-SK vectors and pGreenII 0800-LUC vectors were introduced into Agrobacterium strain GV3101. Agrobacterium containing the recombinant vectors was injected into N. benthamiana leaves as described previously (Zhu et al. 2022). After incubation in the dark overnight, the plants were moved to a greenhouse with 60% humidity and 30 °C with a 16 h/8 h light/dark cycle for 2 d. Luciferase bioluminescence was detected using an imaging system (Xenogen IVIS 100, PerkinElmer), and the luciferase activity was quantified using the Dual-Luciferase Reporter Assay System (Promega Corp., Fitchburg, WI, USA) following the manufacturer’s instructions. Primers used are listed in Supplementary Table S6.
Phylogenetic analyses
GhIAAs protein sequence alignments were carried out using DNAMAN software with default parameters. Phylogenetic trees were constructed using MEGA 7.0 software with neighbor-joining method and 1,000 bootstrap replicates. MEME (v.12.0; http://meme-suite.org/tools/meme) online software was used for analyzing sequence features of AUX/IAA members in G. hirsutum.
Statistical analyses
GraphPad Prism 8.0.1 (USA) was used to calculate P value with unpaired 2-tailed Student’s t test. methods. SPSS version 24.0 for Windows (SPSS Inc., Chicago, IL, USA) was used to calculate P value with 1-way ANOVA followed by Duncan's multiple comparison test (P < 0.05 or P < 0.001).
Accession numbers
The RNA-seq data for fibers from GhAXR2 and GhSHY2 silencing cotton plants can be accessed in NCBI with accession number PRJNA967157. The major genes mentioned in this paper are available in CottonFGD (https://cottonfgd.org/) with accession numbers as follows: GhAXR2 (Gh_A09G1947), GhSHY2 (Gh_A02G0340), GhARF6-1 (Gh_A05G1225), GhARF23-2 (Gh_D04G0030), GhARF7-1 (Gh_D06G0818), GhARF19-1 (Gh_A05G3541), GhARF1-1 (Gh_A10G1402), GhARF2-2 (Gh_A11G0358), GhARF17-5 (Gh_D13G2411), GhARF18-6 (Gh_A07G1254), GhCTR1 (Gh_D06G0257), GhXTH9 (Gh_A13G0500), and GhC4H (Gh_D13G2458).
Acknowledgments
We thank Xiaonan Mao, Huiyun Shi, Xiao Xu, and Yakong Wang from Zhengzhou Research Base, State Key Laboratory of Cotton Biology, School of Agricultural Sciences, Zhengzhou University; Tingting Jia and Ronggui Yu from College of Life Science, Shihezi University; and Liyong Hou, Xin Zhou, and Shuangshuang Weng from College of Life Science, Shaanxi Normal University, for experimental assistance and suggestions.
Author contributions
F.J., L.H., and L.Z. performed the experiments; L.Z. and F.J. analyzed the data; L.Z. and F.J. performed software application and data visualization; L.Z. and G.X. wrote the paper; H.L. and L.L. revised the paper and guided this research. G.X. conceived and designed the experiments. All authors have read and approved the final manuscript.
Supplementary data
The following materials are available in the online version of this article.
Supplementary Figure S1. Collinearity analysis of cotton AUX/IAA genes.
Supplementary Figure S2. Sequence features of AUX/IAA members in G. hirsutum.
Supplementary Figure S3. Phylogenetic analysis of GhAUX/IAA and AtAUX/IAA members.
Supplementary Figure S4. Characterization of cotton GhAXR2 and GhSHY2.
Supplementary Figure S5. Expression and alignment of AtAXR2 and AtSHY2 homologous genes in cotton.
Supplementary Figure S6. Regulation of Arabidopsis root hair length and number by GhAXR2 and GhSHY2.
Supplementary Figure S7. Phenotype of the whole plants of GhAXR2-VIGS plants and control plants.
Supplementary Figure S8. Phenotype of the whole plants of GhSHY2-VIGS plants and control plants.
Supplementary Figure S9. BiFC assay showing the interaction of GhAXR2 or GhSHY2 with GhARFs.
Supplementary Figure S10. Phylogenetic analysis of 56 GhARFs and 22 AtARFs.
Supplementary Figure S11. Phenotype of the whole plants of GhARF6-1-VIGS plants and control plants.
Supplementary Figure S12. Phenotype of the whole plants of GhARF23-2-VIGS plants and control plants.
Supplementary Figure S13. Phenotype of the whole plants of GhARF7-1-VIGS plants and control plants.
Supplementary Figure S14. Phenotype of the whole plants of GhARF19-1-VIGS plants and control plants.
Supplementary Figure S15. Cotton fiber cell initiation and elongation regulated by GhARF1-1.
Supplementary Figure S16. GhARF2-2 regulates cotton fiber cell initiation and elongation.
Supplementary Figure S17. GhARF17-5 regulates cotton fiber cell initiation and elongation.
Supplementary Figure S18. GhARF18-6 regulates fiber cell initiation and elongation.
Supplementary Figure S19. Interaction of GhARF6-1, GhARF23-2, GhARF7-1, and GhARF19-1 proteins.
Supplementary Figure S20. Motif analysis of 2 repressive ARFs (GhARF6-1 and GhARF23-2) and 2 active ARFs (GhARF7-1 and GhARF19-1).
Supplementary Figure S21. Transcriptome analysis of GhAXR2-VIGS or GhSHY2-VIGS lines and control plants.
Supplementary Figure S22. Relative expression levels of 18 downstream candidate genes in GhAXR2-VIGS cotton fibers.
Supplementary Figure S23. Upregulated candidate genes in fibers from GhARF6-1 or GhARF23-2 silencing plants.
Supplementary Figure S24. Expression of 18 downstream candidate genes in GhARF6-1-VIGS and GhARF23-2-VIGS cotton fibers.
Supplementary Figure S25. Relative expression levels of 19 downstream candidate genes in GhSHY2-VIGS cotton fibers.
Supplementary Figure S26. Downregulated candidate genes in fibers from GhARF7-1 or GhARF19-1 silencing plants.
Supplementary Figure S27. Heatmap of relative expression levels of 19 downstream candidate genes in GhARF7-1-VIGS and GhARF19-1-VIGS cotton fibers.
Supplementary Figure S28. GhAXR2 and GhSHY2 inhibit the transcription regulation of GhARF on the corresponding targets.
Supplementary Figure S29. Regulation of cotton root hair length and number by GhAXR2 and GhSHY2.
Supplementary Figure S30. Pull-down assays of the interaction between GhAXR2 and GhARF6-1 or GhARF23-2, as well as GhSHY2 and GhARF7-1 or GhARF19-1.
Supplementary Table S1. Detailed information of 84 GhAUX/IAA genes in G. hirsutum.
Supplementary Table S2. Detailed information of 1,185 DEGs in fibers from GhAXR2-VIGS plants.
Supplementary Table S3. Detailed information of 813 DEGs in fibers from GhSHY2-VIGS plants.
Supplementary Table S4. Detailed information of 18 genes in top 20 GO and KEGG enrichment that are both upregulated in fiber development stage and have AuxRE element in promoter regions.
Supplementary Table S5. Detailed information of 19 genes in top 20 GO and KEGG enrichment that are both upregulated in fiber development stage and have AuxRE element in promoter regions.
Supplementary Table S6. Primers used in this work.
Funding
This work was supported by the National Key Research and Development Program (SQ2022YFF1002000), National Natural Science Foundation of China (32070549, 32270578, and 32200444), Fundamental Research Funds for the Central Universities (GK202304016, GK202304018, GK202304015), Department of Education College Youth Innovation team project of Shaanxi Province (GK202307003), Scientific Research Project of Shaanxi Academy of Basic Sciences (22JHQ086), China Postdoctoral Science Foundation (2022M712005), Shaanxi Province Postdoctoral Science Foundation (2023BSHTBZZ33), Natural Science Basic Research Plan in the Shaanxi Province of China (2022JQ-197), and State Key Laboratory of Cotton Biology Open Fund (CB2022A01).
Data availability
Raw reads are available on NCBI Sequence Read Archive (SRA), under the BioProject accession no. PRJNA967157. All materials are available upon request.
Dive Curated Terms
The following phenotypic, genotypic, and functional terms are of significance to the work described in this paper:
References
Author notes
Fei Jin and Liping Zhu contributed equally.
The author responsible for distribution of materials integral to the findings presented in this article in accordance with the policy described in the Instructions for Authors (https://dbpia.nl.go.kr/plphys/pages/General-Instructions) is Guanghui Xiao.
Conflict of interest statement. None declared.
