


Abstract
Calcium is known to improve seed-germination rates under salt stress. We investigated the involvement of calcium ions (Ca2+) in regulating HIGH-AFFINITY K+ TRANSPORTER 1 (HKT1; 1), which encodes a Na+/K+ transporter, and its post-translational regulator TYPE 2C PROTEIN PHOSPHATASE 49 (PP2C49), in germinating Arabidopsis (Arabidopsis thaliana) seedlings. Germination rates of hkt1 mutant seeds under salt stress remained unchanged by CaCl2 treatment in wild-type Arabidopsis, whereas pp2c49 mutant seeds displayed improved salt-stress tolerance in the absence of CaCl2 supplementation. Analysis of HKT1;1 and PP2C49 promoter activity revealed that CaCl2 treatment results in radicle-focused expression of HKT1;1 and reduction of the native radicle-exclusive expression of PP2C49. Ion-content analysis indicated that CaCl2 treatment improves K+ retention in germinating wild-type seedlings under salt stress, but not in hkt1 seedlings. Transgenic seedlings designed to exclusively express HKT1;1 in the radicle during germination displayed higher germination rates under salt stress than the wild type in the absence of CaCl2 treatment. Transcriptome analysis of germinating seedlings treated with CaCl2, NaCl, or both revealed 118 upregulated and 94 downregulated genes as responsive to the combined treatment. Bioinformatics analysis of the upstream sequences of CaCl2–NaCl-treatment-responsive upregulated genes revealed the abscisic acid response element CACGTGTC, a potential CaM-binding transcription activator-binding motif, as most prominent. Our findings suggest a key role for Ca2+ in mediating salt-stress responses during germination by regulating genes that function to maintain Na+ and K+ homeostasis, which is vital for seed germination under salt stress.
Introduction
High concentrations of salt (NaCl) in the growth medium impair seed germination and seedling establishment. Increasing soil salinization of arable lands worldwide (Wang et al. 2003; Hassani et al. 2021) calls for a better understanding of the mechanisms that govern plant responses to salinity during early stages of development. Improvement of crop plant performance under salt-stress conditions is essential to ensuring food security and attenuating food scarcity (Tester and Langridge 2010). Plants have evolved various strategies to adjust their growth and development to saline environments (Zhu 2002), including removal of sodium ions (Na+) from the cytosol to the vacuole and the apoplast, mainly facilitated by the tonoplast-localized Na+/H+ antiporter 1 (NHX1) (Apse et al. 1999) and the plasma membrane-localized Na+/H+ antiporter SALT OVERLY SENSITIVE1 (SOS1) (Shi et al. 2000). Another type of salt response-related transporter in plants is the high-affinity K+-transporter (HKT) which facilitates long-distance Na+ transport to maintain Na+-level homeostasis at the whole-plant level (Waters et al. 2013). In Arabidopsis (Arabidopsis thaliana), a single HKT-type transporter (HKT1;1, AT4G10310) was identified and localized to the plasma membrane of the vascular parenchyma cells surrounding the xylem (Sunarpi et al. 2005; Davenport et al. 2007). In roots of young and mature Arabidopsis, HKT1;1 function in Na+ retrieval from the shootward xylem stream to adjacent parenchyma cells, thus limiting the accumulation of Na+ in salt-sensitive shoot tissues (Mäser et al. 2002; Rus et al. 2004; Sunarpi et al. 2005; Horie et al. 2006; Møller et al. 2009; Shkolnik-Inbar et al. 2013; Möller et al. 2017). Furthermore, hkt1 mutants, which are characterized as salt-hypersensitive, accumulate higher levels of Na+ in the shoots and xylem vessels (Mäser et al. 2002; Sunarpi et al. 2005; Davenport et al. 2007). However, the mechanisms by which these and other transport systems function to maintain Na+ homeostasis during germination in association with other salt stress-related signaling pathways and responses have yet to be fully investigated.
Calcium ions (Ca2+) have been shown to promote salt tolerance of Arabidopsis, common reed (Phragmites australis) and cotton (Gossypium hirsutum) (Kent and Läuchli 1985; Zehra et al. 2012; Shkolnik et al. 2019). Ca2+ has been proposed to improve the selectivity of potassium ion (K+) uptake to maintain K+/Na+ ratios upon exposure to excessive concentrations of NaCl (Lahaye and Epstein 1969, 1971; Bernstein 1970). Ca2+ is a ubiquitous secondary messenger that mediates a wide array of downstream signaling cascades in response to various internal and environmental stimuli, including salt (Choi et al. 2014, 2016; Shkolnik et al. 2018). In roots, NaCl induces elevation of free Ca2+ levels in the cytosol by promoting Ca2+ influx from the vacuole, as in the activity of the tonoplast-localized TWO PORE CHANNEL1 (TPC1) (Peiter et al. 2005; Evans et al. 2016). Moreover, other subcellular compartments that function as Ca2+ reservoirs, such as the endoplasmic reticulum, chloroplasts, mitochondria and peroxisomes, may also be involved (Stael et al. 2012; Choi et al. 2014). In plant cells, Ca2+ signals are perceived by multiple calmodulin (CaM) and CaM-like proteins, and the duration, localization, intensity and frequency of the cytosolic Ca2+ transients determine the downstream responses, involving the activity of various cellular components, such as phosphatases, kinases and transcription factors (TFs) (Kudla et al. 2010). The SOS signaling pathway is particularly activated in response to NaCl. The myristoylated Ca2+-binding protein SOS3 functions as a primary Ca2+ sensor that perceives the signals and interacts with the serine/threonine protein kinase SOS2, which in turn activates SOS1 to facilitate Na+ removal from the cytosol to the apoplast (Qiu et al. 2002; Ji et al. 2013). Nevertheless, the molecular mechanism underlying the Ca2+-mediated improved tolerance to salt stress in general, and during germination in particular, has yet to be deciphered.
Arabidopsis is a useful model for investigating molecular mechanisms of plant responses to salt stress (Zhu 2000; Yang and Guo 2018). Investigation of the involvement of Ca2+ signaling in response to abiotic stress in Arabidopsis revealed six genes encoding CaM-binding transcription activators (CAMTAs), all with similar DNA-binding domains (Bouché et al. 2002; Yang and Poovaiah 2002; Mitsuda et al. 2003; Finkler et al. 2007a; Doherty et al. 2009; Shen et al. 2015). CAMTA proteins were suggested to be components of Ca2+-mediated signaling pathways in plant responses to various external stimuli, including abiotic stresses and hormones such as abscisic acid (ABA) (Yang and Poovaiah 2002; Finkler et al. 2007a). CAMTA-similar genes were then identified in other plant species, including tomato (Solanum lycopersicum; Li et al. 2014), maize (Zea mays; Yue et al. 2015), and rice (Oryza sativa; Choi et al. 2005; Rahman et al. 2016). Recently, CAMTA6 has been shown to regulate the seed's response to salt stress during germination by affecting the expression of multiple genes, and examination of presumed promoters of salt-responsive CAMTA6-dependent upregulated genes revealed the high frequency of the ABA response element (ABRE) CACGTGTC, suggested as a potential CAMTA-binding site (Shkolnik et al. 2019). In the background of a camta6 mutation, HKT1;1 was expressed predominantly in the radicle (Shkolnik et al. 2019). This unique radicle-focused expression pattern of HKT1;1 was associated with the camta6 phenotype of improved germination in the presence of salt, which was not observed in camta6 seedlings that were several days old and found to display salt hypersensitivity (Shkolnik et al. 2019). This could be explained by the fact that in pregerminating seedlings, in which the vascular tissues have not yet differentiated, HKT1;1 was evenly expressed in all tissues (Shkolnik et al. 2019). Hence, the activity and influence of HKT1;1 on systemic Na+-level regulation in germinating seedlings differ from its function of limiting shoot Na+ accumulation in later stages of development (Davenport et al. 2007).
Recently, HKT1;1 has been reported to function in protecting plant fertility by limiting Na+ accumulation in Arabidopsis stamen tissues (Uchiyama et al. 2023) and in tomato, HKT1;2 was shown to regulate Na+/K+ homeostasis in salt-stressed shoots (Jaime-Pérez et al. 2017). Overexpression of the CaM-like protein CML40 in Medicago truncatula led to downregulation of MtHKT1;1 and MtHKT1;2 expression, which resulted in hypersensitivity to salt during germination (Zhang et al. 2019). In wheat (Triticum aestivum), HKT1 silencing by antisense RNA resulted in improved tolerance to NaCl, which was attributed to reduced Na+ uptake (Laurie et al. 2002), in agreement with the proposed function of both HKT1 from wheat and HKT1;1 from Arabidopsis in facilitating Na+ entry into plant cells (Gassmann et al. 1996; Uozumi et al. 2000). Furthermore, HKT1;1 was found to be negatively regulated by the ABA- and salt-regulated TF ABA INSENSITIVE 4 (Finkelstein 1994; Shkolnik and Bar-Zvi 2008; Shkolnik-Inbar et al. 2013), which is consistent with the salt hypersensitivity of hkt1 seeds (Shkolnik et al. 2019). Recently, HKT1;1 was found to be directly inactivated by the phosphatase PP2C49 (AT3G62260) (Chu et al. 2021), a member of the type 2C protein phosphatase family which facilitates dephosphorylation of substrate proteins that are involved in signaling in Arabidopsis (Luan 2003; Schweighofer et al. 2004).
PP2C49 has also been reported to function in pollen development (Wang et al. 2011). In Arabidopsis, in addition to PP2C49 which was found as one of the top salt-responsive genes (Lan et al. 2007), two more PP2Cs have been reported as upregulated by salt stress, PP2C50 (At2G25620) and PP2C51 (AT2G33700) (Xue et al. 2008). However, their role in the plant's response to salt and their possible involvement in the Ca2+-mediated response to salt have yet to be investigated. Chu et al. (2021) depicted PP2C49 expression in almost all tissues of juvenile and mature Arabidopsis, excluding germinating seedlings, and specifically in the root vasculature, overlapping with the expression pattern of HKT1;1. Nevertheless, the regulation of HKT1;1 by PP2C49 during germination, under control and salt stress, has not been studied.
Here, we found that Ca2+ promotes downregulation of PP2C49 to enable HKT1;1-induced improvement of K+ retention, and we provide further insights into the effect of Ca2+ on the transcriptome profile of germinating seedlings under salt stress. Moreover, transcriptome analysis indicated that genes functioning in ABA signaling and members of the CAMTA and TEOSINTE BRANCHED1/CINCINNATA/PROLIFERATING CELL FACTOR (TCP) TF families are important players in the Ca2+-mediated response to salt stress during germination.
Results
Germinating hkt1 mutants are not responsive to CaCl2 treatment under salt stress
Seeds of hkt1 mutants are hypersensitive to salt during germination (Shkolnik et al. 2019). We examined the germination rate of seeds of two allelic hkt1 mutants (hkt1 and hkt1-4) and the wild type (Arabidopsis Col-0) sown on agar-solidified medium supplemented with 0 (control), 150 or 200 mm NaCl. Germination was considered only when green, fully unfurled green cotyledons were observed. When sown on 150 or 200 mm NaCl-containing medium, wild-type seeds displayed germination rates of 68.2 ± 2.8% and 2.6 ± 0.5%, respectively, in contrast to, respectively, 33.7 ± 7.3% and 1.3 ± 0.5% germination for hkt1 and 35.3 ± 9.0% and 1.6 ± 0.5% germination of hkt1-4 (Fig. 1). Conversely, when sown on mannitol-containing medium, no significant differences in the germination rates of wild type and hkt1 mutants were scored (Supplemental Fig. S1), indicating that the hkt1 salt hypersensitivity is not due to a general response to osmotic stress. Seeds of all genotypes displayed germination rates of ∼100% when no NaCl was added to the growth medium (Fig. 1). Germination medium supplemented with CaCl2 at 10 mm (1 mm in the control) in the presence of 150 or 200 mm NaCl improved germination rates, as previously demonstrated (Shkolnik et al. 2019) and confirmed here with the wild-type seeds, which displayed 85 ± 3.8% and 27 ± 7% germination, respectively (Fig. 1). Interestingly, germination of hkt1 and hkt1-4 seeds sown on 150 or 200 mm NaCl medium supplemented with CaCl2 was not improved—30.3 ± 9.7%, 4 ± 2% germination for hkt1 and 31 ± 10%, 3.4 ± 1.5% germination for hkt1-4, respectively (Fig. 1).
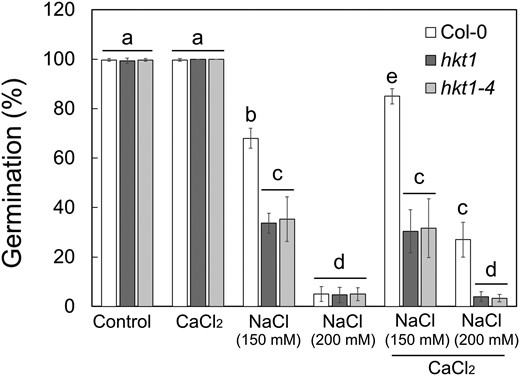
Germination of hkt1 seeds under salt stress is unaffected by CaCl2 treatment. Seeds of the indicated genotypes were sown on agar-solidified 0.25× MS medium supplemented with the indicated single or combined chemicals (NaCl, 150 mm or 200 mm; CaCl2, 10 mm) and germination rates were scored 5 d after plating. Data are means ± SE (three independent biological experiments, ∼100 seeds each), and different letters above the bars indicate significantly different values by Tukey's HSD post hoc test (P < 0.01).
To broaden our understanding of HKT1;1 function in the Ca2+-mediated response to salt stress, we examined the growth and development of roots of hkt1 mutants at later stages of development (3- to 11-d-old seedlings, grown on agar-solidified medium; see Materials and Methods), supplemented with 0 (control), or 10 mm CaCl2, 200 mm NaCl, or both (Supplemental Fig. S2). Interestingly, supplementation of CaCl2 improved growth of the primary root of seedlings of all genotypes under saltstress conditions; however, lateral-root count revealed reduced responsiveness of hkt1 to the elevated CaCl2 concentration in the presence of NaCl, reflected by significantly reduced lateral-root formation (Supplemental Fig. S2). This indicated the involvement of HKT1;1 in the Ca2+-mediated response to salt at this developmental stage as well. No significant phenotypic differences were observed among the three genotypes under control conditions or in response to CaCl2 treatments (Supplemental Fig. S2).
Ca2+ promotes radicle-focused expression of HKT1;1
To study the effect of CaCl2 treatment on the expression pattern of HKT1;1, we used transgenic seedlings expressing the GUS reporter gene under regulation of the HKT1;1 promoter (HKT1;1pro:GUS) (Shkolnik et al. 2019). CaCl2 treatment resulted in radicle-focused HKT1;1 promoter activity, which was enhanced in response to the combined CaCl2 and NaCl treatment (Fig. 2A), further indicating involvement of HKT1;1 in the Ca2+-mediated improvement of germination in the presence of salt. Under control conditions, HKT1;1 was expressed evenly in all tissues of the germinating seedlings, and NaCl treatment resulted in enhanced expression in the whole seedling compared to controls (Fig. 2A) (Shkolnik et al. 2019). To further validate the observed HKT1;1-expression pattern in response to treatment with NaCl, CaCl2, or both, we performed reverse transcription quantitative PCR (RT-qPCR) analysis for relative HKT1;1 transcript level quantification, based on RNA that was isolated from whole seedlings, or separated cotyledon or radicle tissues (see Materials and Methods). In agreement with the promoter-activity analysis, transcripts of HKT1;1 accumulated in response to CaCl2 treatment in the radicle (2.17 ± 0.33, relative to expression in the whole seedling which was set to a value of 1.0) and less so in the cotyledon (0.22 ± 0.08)—more pronounced in response to the combined CaCl2–NaCl treatment (radicle, 5.46 ± 0.65; cotyledon, 0.19 ± 0.05) (Fig. 2B). In fact, CaCl2 treatment, with or without NaCl supplementation, appeared to significantly reduce HKT1;1 expression in the cotyledons (Fig. 2B). The previously reported enhanced whole-seedling expression in response to NaCl treatment (Shkolnik et al. 2019) was reproduced (radicle, 3.8 ± 0.65; cotyledon, 3.1 ± 0.55) (Fig. 2, A and B).
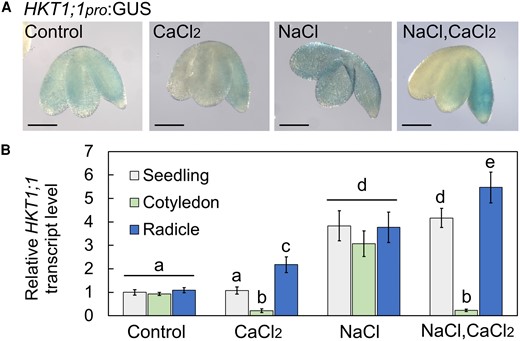
CaCl2 treatment of pregerminating seedlings results in radicle-focused expression of HKT1;1. A) GUS staining of HKT1;1pro:GUS-harboring pregerminating seedlings treated with single or combined chemicals as indicated (NaCl, 200 mm; CaCl2, 10 mm) for 16 h prior to ejection, staining, and imaging. Bar = 1 mm. B) RT-qPCR analysis for relative HKT1;1 transcript level quantification in pregerminated seedlings. Data are means ± SD (three biological experiments, ∼30 seeds each) and different letters above the bars indicate significantly different values by Tukey's HSD post hoc test (P < 0.01).
Radicle-focused HKT1;1 expression promotes salt tolerance during germination
To determine whether the Ca2+-mediated improvement in salt tolerance during germination is due to the observed diminution of HKT1;1 expression in the cotyledons or to the radicle-focused expression, we created transgenic seedlings that express the coding sequence of HKT1;1 under regulation of the native promoter of Arabidopsis AT4G31830. This gene has previously been reported to drive radicle-specific expression during germination (Jeong et al. 2014). The construct was introduced into the hkt1-4 mutant to avoid native HKT1; 1 activity and referred to as “HKT1;1 radicle-expressed” (HKT1; 1-RE). RT-qPCR analysis for HKT1;1 relative transcript level quantification confirmed HKT1;1 expression in the radicles in HKT1; 1-RE germinating seedlings (radicle, 4.4 ± 1.3; cotyledon, 0.23 ± 0.1, relative to whole-seedling expression) (Fig. 3A). Equal relative transcript levels of HKT1;1 were measured in wild-type tissues and very low expression levels were noted in all tissues of the hkt1-4 mutant (Fig. 3A). These findings confirmed that the mutant can serve as a suitable background for tissue-specific expression of HKT1;1. Next, we examined germination of HKT1;1-RE seeds in the presence of 200 mm NaCl in the germination medium. Remarkably, seeds of HKT1;1-RE displayed 31 ± 5.6% germination under salt stress (Fig. 3B), similar to the germination rate of the wild-type in the presence of NaCl with CaCl2 supplementation (Fig. 1). Collectively, these findings strongly associate the radicle-enhanced expression of HKT1;1, rather than the diminished HKT1;1 expression in cotyledons, with salt tolerance during germination.
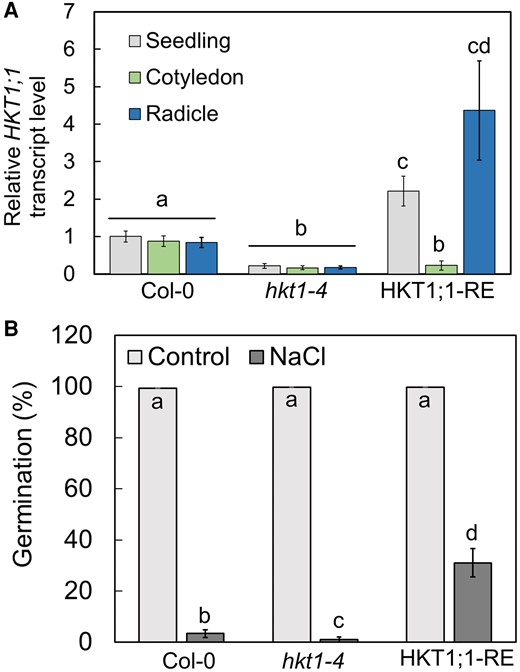
HKT1;1-RE seeds display improved germination under salt-stress conditions. A) RT-qPCR analysis for HKT1;1 relative transcript level quantification in wild-type (Col-0), hkt1-4 mutant, and HKT1;1-RE pregerminated seedlings. Data are means ± SD (three biological experiments, ∼30 seeds each). B) Germination assay. Seeds of wild-type, hkt1-4 mutant, and HKT1;1-RE were sown on agar-solidified 0.25× MS medium supplemented with 0 (control) or 200 mm NaCl. Data are means ± SE (three independent biological experiments, ∼100 seeds each). Different letters above the bars indicate significantly different values by Tukey's HSD post hoc test (P < 0.01).
hkt1 mutants accumulate less Na+ and more K+ during germination under salt stress
Plant cells function to limit the accumulation of toxic levels of Na+ in the cytosol and to promote retention of sufficient levels of K+ (Munns and Tester 2008; Sun et al. 2015; Almeida et al. 2017). To quantify the accumulation of Na+ and K+ in wild-type and hkt1 mutant pregerminating seedlings, extracts of seedlings ejected from seeds that had been treated with 0 (control), or 10 mm CaCl2, 150 mm NaCl, or both for 16 h were analyzed for ion content by inductively coupled plasma optical emission spectrometry (ICP-OES) as previously described (Shkolnik et al. 2019). Under control conditions, wild-type and hkt1 seedlings accumulated 1.39 ± 0.15 µg and 1.47 ± 0.1 µg Na+ per seedling, respectively, and in response to CaCl2 treatment, they accumulated 1.29 ± 0.14 µg and 1.37 ± 0.18 µg Na+ per seedling, respectively (Fig. 4). In the presence of NaCl, wild-type and hkt1 seedlings accumulated 2.34 ± 0.28 µg and 2.87 ± 0.17 µg Na+ per seedling, respectively (Fig. 4), suggesting that the hkt1 hypersensitivity to salt involves enhanced accumulation of Na+ . In response to the combined NaCl–CaCl2 treatment, wild-type and hkt1 seedlings accumulated 1.99 ± 0.12 µg and 3.1 ± 0.11 µg Na+ per seedling, respectively (Fig. 4), strongly indicating the involvement of HKT1;1 in maintaining Ca2+-regulated Na+ homeostasis in germinating seedlings under salt stress. Furthermore, NaCl treatment was found to significantly deplete the K+ content in both wild type, as previously reported (Sun et al. 2015), and hkt1 pregerminating seedlings, with 0.56 ± 0.07 µg and 0.39 ± 0.15 µg K+ per seedling, respectively (Fig. 4), strongly suggesting the involvement of HKT1;1 in K+ retention under salt stress. Interestingly, in response to the combined NaCl–CaCl2 treatment, improved accumulation of K+ in wild-type seedlings was measured (1.04 ± 0.17 µg per seedling) but not in hkt1 seedlings (0.42 ± 0.12 µg per seedling) (Fig. 4). Under control conditions, wild-type and hkt1 seedlings accumulated an equal basal level of K+ of 2.6 ± 0.07 µg and 2.56 ± 0.15 µg per seedling, respectively (Fig. 4), and following CaCl2 treatment, they accumulated 2.61 ± 0.1 µg and 2.54 ± 0.24 µg per seedling, respectively (Fig. 4). Collectively, these data explain, at least in part, the hypersensitivity of hkt1 seedlings to salt stress and their lack of responsiveness to the germination-improving effect of CaCl2 in the presence of salt.
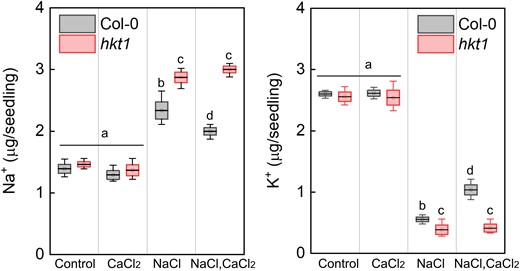
hkt1 mutant accumulates more Na+ and less K+ under salt-stress conditions. Ion-content was determined as described in Materials and Methods in pregerminated wild-type (Col-0) and hkt1-mutant seedlings treated with 0 (control), 10 mm CaCl2, 150 mm NaCl or both, as indicated, for 16 h prior to seedling ejection. Data are mean values (black bar in box) ± SD (upper and lower box limit) and whiskers mark outlier values (three biological experiments, ∼40 seeds each) and different letters above the bars indicate significantly different values by Tukey's HSD post hoc test (P < 0.01).
pp2c49 mutants display tolerance to salt stress during germination
The phosphatase PP2C49 directly inhibits the activity of HKT1;1, and is associated with salt hypersensitivity in young Arabidopsis seedlings (Chu et al. 2021). To study the effect of Ca2+ supplementation on the germination rate of pp2c49 mutant seeds under salt stress, we performed a germination assay with seeds of three pp2c49 allelic mutants and the wild type. Strikingly, when sown on 200 mm NaCl-containing medium, all three pp2c49 allelic mutants displayed improved tolerance to NaCl, with germination rates of 28 ± 8.16%, 26.75 ± 5.7%, and 41.5 ± 8.1% (pp2c49-1, pp2c49-2, and pp2c49-3, respectively), compared to wild-type seeds with a germination rate of 2.6 ± 0.5% (Fig. 5A). Supplementation of CaCl2 to the NaCl-containing medium did not significantly affect the germination rate of pp2c49 mutants, whereas it did for wild-type seeds (Fig. 5A). These results strongly suggest that PP2C49 is an important component in the Ca2+-regulated signaling pathway in response to salt stress during germination.
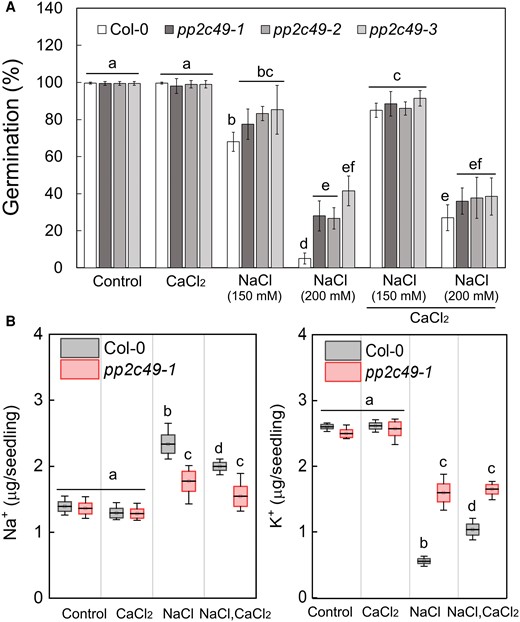
pp2c49 mutants display improved tolerance to salt during germination as compared to wild type. A) Seeds of the indicated genotypes were sown on agar-solidified 0.25× MS medium supplemented with single or combined chemicals as indicated (NaCl, 150 mm or 200 mm; CaCl2, 10 mm), and germination rates were scored 5 days after plating. Data are means ± SE (three independent biological experiments, ∼100 seeds each). B) Ion-content was determined as described in Materials and Methods in pregerminated wild-type (Col-0) and pp2c49-1 mutant seedlings treated with 0 (control), 10 mm CaCl2, 150 mm NaCl or both, as indicated, for 16 h prior to seedling ejection. Data are mean values (black bar in box) ± SD (upper and lower box limit) and whiskers mark outlier values (three biological experiments, ∼40 seeds each). Different letters above the bars indicate significantly different values by Tukey's HSD post hoc test (P < 0.01).
To examine whether the pp2c49 phenotype of improved tolerance to salt during germination is related to Ca2+ regulation of the accumulation of Na+, K+, or both in germinating seedlings, we quantified the ion-content in a pp2c49-1 mutant and the wild-type in response to treatment with NaCl, CaCl2, or both. In response to NaCl treatment, pp2c49-1 pre-germinating seedlings accumulated 1.77 ± 0.3 µg Na+ per seedling, significantly less than the wild type with 2.34 ± 0.28 µg Na+ per seedling (Fig. 5B). Furthermore, combining CaCl2 with NaCl did not reduce the Na+ accumulation of pp2c49-1 (1.54 ± 0.3 µg per seedling) but it did reduce it in the wild type (1.99 ± 0.12 µg per seedling) (Fig. 5B). In response to NaCl treatment, wild-type and pp2c49-1 pre-germinating seedlings accumulated 0.55 ± 0.07 µg and 1.6 ± 0.27 µg K+ per seedling, respectively, and in response to the combined NaCl–CaCl2 treatment, they accumulated 1.04 ± 0.17 µg and 1.65 ± 0.15 µg K+ per seedling, respectively; they accumulated similar levels of K+ in response to the CaCl2 treatment (Fig. 5B). Under control conditions and in response to the CaCl2 treatment, seedlings of both genotypes accumulated similar levels of Na+ as well (Fig. 5B). Collectively, these data strongly indicate the involvement of PP2C49 in Ca2+-mediated maintenance of ion homeostasis under salt stress during germination, which is consistent with the pp2c49 phenotype of improved tolerance.
PP2C49 has been found to be expressed in almost all tissues of young and mature Arabidopsis (Chu et al. 2021). Nevertheless, its expression pattern in germinating seedlings has never been assessed. PP2C49 promoter activity in planta, using PP2C49pro:GUS-expressing seedlings, in response to control, NaCl, CaCl2 or NaCl–CaCl2 treatments, indicated that PP2C49 is exclusively expressed in the radicle under all conditions, and that this expression is most pronounced in response to the NaCl treatment (Fig. 6A). Moreover, CaCl2 treatment reduced the radicle-confined PP2C49 expression and abolished the inductive effect of NaCl on its expression (Fig. 6A). To reconfirm these data, we performed RT-qPCR for relative quantification of PP2C49 transcript level in whole germinating seedlings, and cotyledon and radicle tissues (Fig. 6B). Indeed, CaCl2 significantly reduced the relative PP2C49 transcript level in the whole seedling (0.43 ± 0.11), cotyledons (0.35 ± 0.08) and radicle (0.37 ± 0.21) compared to the control treatment, and abolished transcript accumulation in response to NaCl treatment when the seeds were exposed to the combined treatment—in the whole seedling (0.4 ± 0.19), cotyledons (0.26 ± 0.07), and radicle (0.33 ± 0.14)—in agreement with the expression pattern detected by GUS staining (Fig. 6). These data strongly indicate negative regulation of the expression of PP2C49 by Ca2+ and consequently, attenuation of its negative regulation of HKT1;1, thereby leading to improved germination under salt stress.
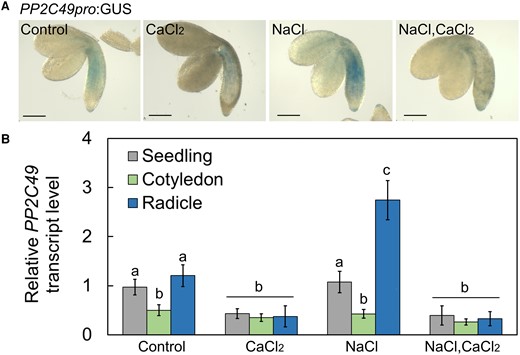
PP2C49 is expressed in the radicles and downregulated by CaCl2 treatment. A) GUS staining of PP2C49pro:GUS-harboring pregerminating seedlings treated with single or combined chemicals as indicated (NaCl, 200 mm; CaCl2, 10 mm) for 16 h prior to ejection, staining and imaging. Bar = 1 mm. B) RT-qPCR analysis for relative PP2C49 transcript level quantification in pregerminated seedlings. Data are means ± SD (three biological experiments, ∼30 seeds each) and different letters above the bars indicate significantly different values by Tukey's HSD post hoc test (P < 0.01).
Transcriptome analysis of CaCl2-treated germinating seedlings under salt stress
Transcriptome analysis was performed to further assess the extent of the effect of CaCl2 supplementation on germination under salt stress. RNA was isolated from pregerminating seedlings that had been treated with CaCl2, NaCl, or both (see Materials and Methods). Expression reads higher than 10 were filtered for differential expression using Partek Genomics Suite v7.20.0831. Differentially expressed gene (DEG) lists of CaCl2-treated, NaCl-treated, and NaCl–CaCl2-treated seedlings versus the control treatment (cutoff fold change [FC] ≥ |1.25| and P ≤ 0.05) were extracted (Supplemental Tables S1 to S3). The top five upregulated and downregulated DEGs for each treatment versus the control treatment are presented in Table 1. Notably, among the genes that were upregulated in response to the NaCl–CaCl2 treatment was the putative PP2C-encoding gene AT2G34740 (PP2C28) (Table 1), further suggesting an important function of PP2Cs in Ca2+-mediated signaling in response to salt. Moreover, downregulation of the ELM2-domain MYB TF (AT2G03470) in response to the combined treatment (Table 1) emphasizes the broad impact of Ca2+ signaling under salt stress on a large number of genes via regulation of TFs, in accordance with previous data (Shkolnik et al. 2019). In agreement with the GUS-staining and RT-qPCR analyses, PP2C49 was found to be downregulated by CaCl2 treatment (Fig. 6) with a −3.29-fold change compared to the control (Supplemental Table S1). As previously shown, HKT1;1 expression was below the system's detection threshold (Shkolnik et al. 2019). However, the RT-qPCR analysis and PP2C49 promoter activity observed by GUS staining confirm expression at this developmental stage and in response to the various conditions that were assessed (Fig. 2). Venn diagrams were created to compare DEG lists (cutoff FC ≥ |1.25| and P ≤ 0.05; Supplemental Fig. S3 and Supplemental Table S4). Using these selected cutoffs, 118 unique upregulated and 94 unique downregulated NaCl–CaCl2-responsive genes were identified (Supplemental Table S4). In response to CaCl2 treatment, 856 unique upregulated and 195 unique downregulated genes were identified, whereas in response to NaCl treatment, 244 unique upregulated and 142 unique downregulated genes were identified (Supplemental Fig. S3 and Supplemental Table S4). Functional analysis of these upregulated and downregulated genes, exclusive to each treatment (CaCl2, NaCl, CaCl2–NaCl) versus the control, was conducted using the DAVID Gene Functional Classification tool (https://david.ncifcrf.gov/) (Sherman et al. 2022), with multiple sources of functional annotations (https://david.ncifcrf.gov/content.jsp? file=update.html). Classifications were selected based on P values (P ≤ 0.05). Highly significantly enriched GO terms for differentially expressed (CaCl2–NaCl treatment versus control) upregulated and downregulated genes were of nuclear proteins (∼22% upregulated and ∼36% downregulated) and expression-related genes (∼44% upregulated), RNA binding (20% downregulated) and TFs (∼8.8% upregulated and ∼17% downregulated) (Fig. 7, Supplemental Table S5). Interestingly, ∼38% of the upregulated DEGs were classified as involved in the response to abiotic stress, similar to the response to NaCl treatment (Fig. 7, Supplemental Table S5). Furthermore, in response to NaCl treatment, most of the downregulated DEGs were of organellar proteins (∼82%), with ∼32% associated with the chloroplast and ∼11% to the nucleus, whereas ∼9% of the upregulated DEGs were associated with the nuclear lumen (Fig. 7, Supplemental Table S5). Similar to the response to NaCl treatment, ∼79% of the downregulated DEGs in response to CaCl2 treatment were organellar; however, ∼21% of the downregulated DEGs were associated with the nucleus, whereas ∼31% were of chloroplast proteins (Fig. 7, Supplemental Table S5). There was, therefore, a substantial negative effect of NaCl and positive effect of CaCl2 on chloroplast-associated protein expression in germinating seedlings, which was not observed in response to the combined treatment. NaCl induced ABA-responsive DEGs (∼14%), as expected in view of the involvement of ABA in salt-responsive signaling pathways (Zhu 2002). On the other hand, CaCl2 downregulated DEGs of this functional classification (∼12%) (Fig. 7, Supplemental Table S5). The full raw and selected DEG lists are available in Supplemental Table S5.
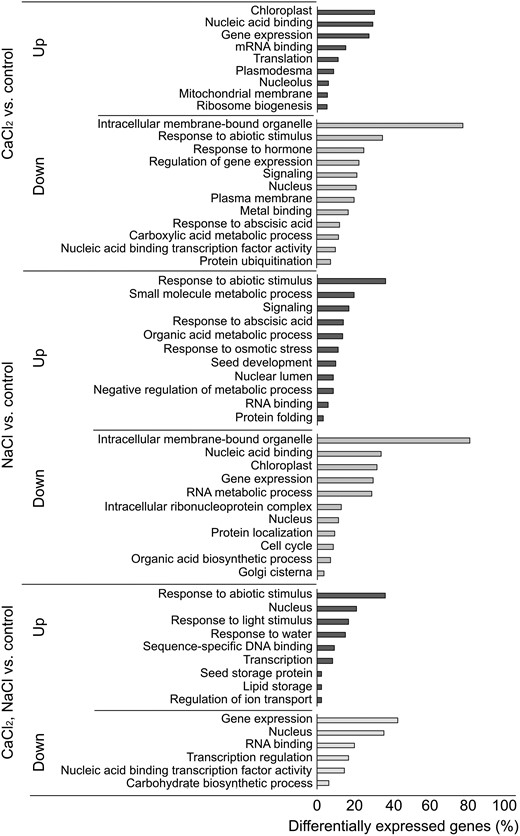
Functional classification of DEGs by the DAVID gene functional classification tool (https://david.ncifcrf.gov/). The tool utilizes the comprehensive DAVID Knowledgebase which pulls together multiple sources of functional annotations. Representative classifications were selected base on P values (P ≤ 0.05) by kappa statistics. Classification analysis of the upregulated and downregulated DEGs was performed based on the following: biological process, molecular function and cellular component.
List of top five upregulated and downregulated DEGs obtained by transcriptome analysis of pregerminated seedlings treated with CaCl2, NaCl or both versus the control treatment (according to Supplemental Tables S1 to S3). Molecular or biochemical function of the DEGs was identified using the GO annotation tool (https://www.arabidopsis.org/tools/bulk/go/index.jsp)
| Treatment | Expression | Accession no. | Name | Molecular/biochemical function | Fold change |
|---|---|---|---|---|---|
| CaCl2 | Upregulated | AT5G14680 | … | Adenine nucleotide alpha hydrolase-like | 49.77 |
| AT4G16800 | … | Methylglutaconyl-CoA hydratase | 36.86 | ||
| AT5G26200 | … | Transmembrane transport | 35.11 | ||
| AT2G07050 | CAS1 | Cycloartenol synthase | 29.77 | ||
| AT5G02710 | … | Zinc/iron chelation | 27.5 | ||
| Downregulated | AT5G65660 | … | Hydroxyproline-rich glycoprotein | −32.43 | |
| AT5G10860 | CBSX3 | Cystathionine beta-synthase | −26.16 | ||
| AT1G61340 | FBS1 | F-box protein binding | −21.88 | ||
| AT3G18080 | BGLU44 | B-S glucosidase | −20.8 | ||
| AT5G41020 | … | MYB family transcription factor | −20.75 | ||
| NaCl | Upregulated | AT1G34580 | … | Monosaccharide transmembrane transport | 15.98 |
| AT3G10860 | … | Cytochrome bc1 complex, subunit 8 | 13.9 | ||
| AT1G02310 | MAN1 | Glycosyl hydrolase | 9.55 | ||
| AT5G15960 | KIN1 | ABA signaling pathway component | 8.37 | ||
| AT1G04450 | RIC3 | Intracellular calcium gradient maintenance | 7.0 | ||
| Downregulated | AT2G29680 | CDC6 | ATP hydrolysis, cell division control | −20.4 | |
| AT4G30400 | ATL13 | RING/U-box, protein ubiquitination | −12.38 | ||
| AT4G13200 | PG18 | Thylakoid membrane formation | −12.37 | ||
| AT5G04105 | … | Small nuclear RNA | −12.24 | ||
| AT4G10810 | … | Unknown | −11.73 | ||
| CaCl2–NaCl | Upregulated | AT2G34740 | PP2C28 | Protein phosphatase 2C | 24.44 |
| AT5G62220 | GT18 | Galactosyltransferase | 16.93 | ||
| AT5G60410 | SIZ1 | SUMO E3 ligase | 13.06 | ||
| AT2G30105 | … | LRR/ubiquitin-like | 10.73 | ||
| AT3G28740 | CYP81D11 | Cytochrome p450 | 9.86 | ||
| Downregulated | AT5G66870 | ASL1 | Transcription activator | −28.32 | |
| AT4G22380 | … | Ribosomal protein | −15.14 | ||
| AT2G22800 | HAT9 | Homeobox protein | −14.45 | ||
| AT2G03470 | … | MYB family transcription factor | −12.68 | ||
| AT3G46560 | TIM9 | Zinc finger-like, mitochondrial protein import | −12.64 |
Promoter analysis of salt- and calcium-responsive genes: an unbiased motif scan
To further study the signaling pathways involved in Ca2+-mediated responses to salt in germinating seedlings, we analyzed 1,000 bp of the genomic sequence of presumed promoters of unique DEGs located upstream of each upregulated and downregulated gene that was responsive to NaCl, CaCl2, or the combined treatment for the presence of cis-elements, by an unbiased motif scan, using the Amadeus-Allegro tool (http:/acgt.cs.tau.ac.il/allegro/download). The analysis of the presumed promoter sequences was performed to detect overrepresentation of cis-elements for TF binding. The JASPAR cis-element database (https://jaspar.genereg.net/) was used for motif detection. In response to the combined NaCl–CaCl2 treatment (Fig. 8), the unbiased motif analysis of upregulated responsive genes revealed a motif with consensus CACGTGTC (P value of 1.0E−15), which represents a G-box and an ABRE motif for the binding of bHLH TF family members, including TCPs, PIFs, SPT, MYC, and more. The second motif contained the consensus TCCGCGCA (P value of 6.0E−15), which is an alternative ABRE and CAMTA-binding motif (Kaplan et al. 2006; Finkler et al. 2007b). Analysis of these promoters using Pscan (http://159.149.160.88/pscan/) identified those TFs, including CAMTA1, CAMTA2, and CAMTA3 (full list of identified TFs under all conditions in Supplemental Table S5). Analysis of presumed promoters of genes downregulated in response to combined NaCl–CaCl2 treatment revealed two motifs with consensus ATGCTAAC (P value of 1.8E−13) and CCAGATAG (P value of 5.8E−13) (Fig. 8) that could not be verified as specific TF-binding elements. However, Pscan analysis identified cis-elements in these promoters that are considered to interact with multiple members of the TCP TF family (Supplemental Table S6). Presumed promoters of upregulated genes in response to NaCl treatment were found to harbor the consensus ACGTGTTCG (P value of 4.0E−20), which represents an ABRE and potential CAMTA-binding site (Kaplan et al. 2006; Finkler et al. 2007b; Shkolnik et al. 2019) and CTGCCGCG (P value of 2.7E−18), which represents a CGCG-core motif that is present in CAMTA-binding elements (Yang and Poovaiah 2002; Han et al. 2006). In response to CaCl2 treatment, the presumed upregulated gene promoters were found to contain the consensus TAGGCCCA (P value of 5.1E−23), which represents a regulatory element group cis-element (Yamamoto et al. 2007) and GGTCCCGA (P value of 2.7E−16), which is classified as a CYCLOIDEA(cyc)-binding motif, has been shown to be involved in the regulation of floral development (He et al. 2022), and could be bound by TCP24, a TF that negatively regulates secondary cell-wall thickening (Wang et al. 2015). Downregulated presumed gene promoters identified in response to CaCl2 treatment were found to harbor the consensus GCCTGCAC (P value of 3.8E−15), reported to be the signature binding sequence of the nitrogen-control NtcA TFs in the unicellular cyanobacterium Synechococcus (Gunawardana and Herath 2022), and a second motif with a consensus CGACGCGG (P value of 1.4E−14( which represents an ABRE and CAMTA-binding motif (Kaplan et al. 2006; Finkler et al. 2007b). The frequent representation of CAMTA-binding motifs in gene promoters in response to salt and Ca2+ coincides with the reported substantial involvement of CAMTA TFs in the regulation of thousands of genes in response to environmental stimuli, including salt (Walley et al. 2007; Kim et al. 2013; Benn et al. 2014; Shkolnik et al. 2019).
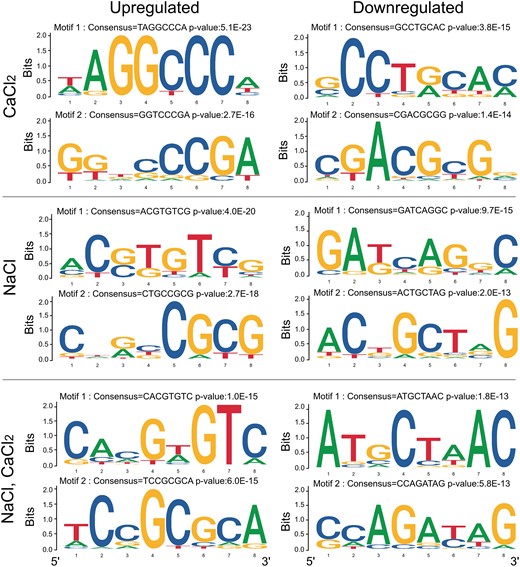
Highly represented sequence motifs in the promoters of DEGs which were identified as exclusively expressed in response to CaCl2, NaCl or combined CaCl2–NaCl treatments based on the data presented in Supplemental Table S4. Promoter analyses of DEGs were performed using Amadeus-Allegro software (http://acgt.cs.tau.ac.il/allegro/download.html) on the 1,000-bp genomic sequences upstream of the transcription start sites of the corresponding genes. Motifs of eight bases were derived from the JASPAR regulatory motif database. Left, promoter motifs in upregulated DEGs. In the promoters of unique genes upregulated by CaCl2 treatment, motif 1 with consensus TAGGCCCA and P value of 5.1E−23 represents a regulatory element group cis-regulatory element (Yamamoto et al. 2007). Motif 2 with consensus GGTCCCGA and a P value of 2.7E−16 is TCP24, a CYCLOIDEA (CYC)-binding motif known for regulation of leaf differentiation, floral development, and regulation of secondary-wall thickening (Wang et al. 2015; He et al. 2022). In the promoters of unique genes upregulated by NaCl treatment, motif 1 with consensus ACGTGTTCG and a P value of 4.0E−20 represents an ABRE and CAMTA-binding site (Kaplan et al. 2006; Finkler et al. 2007b). Motif 2 with consensus CTGCCGCG and a P value of 2.7E−18 represents a CGCG-core motif that occurs in CAMTA-binding elements (Yang and Poovaiah 2002; Han et al. 2006). In the promoters of unique genes upregulated by NaCl–CaCl2 treatment, motif 1 with consensus CACGTGTC and a P value of 1.0E-15 represents ABRE and CAMTA-binding site, and motif 2 with consensus TCCGCGCA and a P value of 6.0E−15 represents a CAMTA-binding motif (Kaplan et al. 2006; Finkler et al. 2007b). Right, promoter motifs in downregulated DEGs. In the promoters of unique genes downregulated by CaCl2 treatment, motif 1 with consensus GCCTGCAC and a P value of 3.8E−15 represents the signature binding sequence of NtcA transcription factors in cyanobacterium (Gunawardana and Herath 2022), and motif 2 with consensus CGACGCGG and a P value of 1.4E−14 represents an ABRE and CAMTA-binding motif (Kaplan et al. 2006; Finkler et al. 2007b); the latter's occurrence is not considered statistically significant. In promoters of unique genes downregulated by NaCl treatment, motif 1 with consensus GATCAGGC and a P value of 9.7E−15 has yet to be identified and motif 2 with consensus ACTGCTAG and a P value of 2.0E−13 has yet to be verified. In the promoters of unique genes downregulated by NaCl–CaCl2 treatment, two motifs were identified: ATGCTAAC (P = 1.8E−13) and CCAGATAG (P = 5.8E−13), which have yet to be verified.
Discussion
HKT1;1 is involved in the Ca2+-mediated response to NaCl during germination
Seed germination is a critical developmental stage in the plant's life cycle, when adjustments to environmental conditions, including salt stress, are necessary to ensure completion of germination and seedling establishment, as well as adequate vegetative development and yield. Although the positive effects of Ca2+ in improving germination and plant growth and development under salt-stress conditions have been demonstrated (Kent and Läuchli 1985; Zehra et al. 2012; Shkolnik et al. 2019), our knowledge of the underlying mechanisms is fragmented. HKT1;1 is a Na+/K+ symporter that functions as an important factor in plant responses to salt stress (Rus et al. 2001; Laurie et al. 2002; Shkolnik-Inbar et al. 2013). Recently, HKT1;1 was found to be regulated by the salt-regulated TF CAMTA6 during germination, contributing to maintaining Na+ homeostasis under salt stress (Shkolnik et al. 2019). These findings strongly suggest that HKT1;1 is a component of the Ca2+-signaling pathway in response to salt stress. Moreover, in the background of the camta6 mutation, HKT1; 1 was expressed exclusively in the radicle of germinating seedlings, suggesting an association of this expression pattern with tolerance to salt during germination (Shkolnik et al. 2019). In Arabidopsis, maize, tomato, and wheat, HKT1 homologs have been found to promote tolerance to salt by facilitating Na+ retrieval from the root xylem sap to vascular parenchyma cells, thereby preventing Na+ accumulation in the shoot (Laurie et al. 2002; Sunarpi et al. 2005; Møller et al. 2009; Shkolnik-Inbar et al. 2013; Jaime-Pérez et al. 2017; Zhang et al. 2018). In contrast, the role of HKT1;1 during germination in the presence of NaCl, when the vascular tissues have not yet differentiated, has not been extensively investigated. Mutagenesis of AtHKT1;1 and downregulation of MtHKT1;1 and MtHKT1;2 resulted in hypersensitivity to salt during germination, associated with increased accumulation of Na+ (Shkolnik et al. 2019; Zhang et al. 2019).
Here, we compared the germination rates of wild-type and two allelic hkt1-mutant seeds in the presence of NaCl and elevated CaCl2 concentration, and revealed lack of responsiveness of the hkt1 mutants to CaCl2 supplementation compared to the wild-type, which displayed Ca2+-mediated improvement of germination rate under salinity (Fig. 1). Interestingly, CaCl2 application was found to promote radicle-focused expression of HKT1;1, which was further enhanced in the presence of NaCl (Fig. 2), and resembled the expression on the camta6 background (Shkolnik et al. 2019). Hence, this radicle-focused expression of HKT1;1 appears to associate with improved germination rate in the presence of germination-arresting concentrations of NaCl. Collectively, the radicle-focused HKT1;1 expression in the camta6 background, which is not affected by NaCl application, the camta6 salt-tolerance phenotype, the camta6/hkt1 double mutant salt-hypersensitivity phenotype (Shkolnik et al. 2019), and hypersensitivity of hkt1 which is not improved by CaCl2 supplementation (Fig. 1), all suggest the involvement of CAMTA6 in Ca2+-mediated regulation of HKT1;1 expression under salt stress during germination. However, we still needed to address whether CAMTA6 directly regulates the transcription of HKT1;1 by binding to its promoter. We assessed the possibility that the reduced expression of HKT1;1 in cotyledons in response to CaCl2 application, and not the radicle-focused expression, underlies the improved salt tolerance, by generating transgenic plants in which HKT1;1 is expressed under the regulation of the promoter of the gene AT4G31830, whose expression is confined to the radicle (Jeong et al. 2014). Strikingly, this artificial radicle-confined expression of HKT1;1 allowed germination in the presence of NaCl (Fig. 3B), similar to the effect of CaCl2 application. Therefore, the hypersensitivity to NaCl of hkt1 mutants (Fig. 1; Shkolnik et al. 2019), in which functional HKT1;1 is absent from all of the germinating seedling's tissues, and the improved tolerance gained by radicle-focused expression, indicate that this HKT1;1 expression pattern underlies, at least in part, the molecular mechanism of the Ca2+-mediated improvement in salt tolerance during germination.
HKT1;1 is negatively regulated by the phosphatase PP2C49 (Chu et al. 2021). In accordance with that report and the HKT1;1-expression pattern presented herein (Fig. 2), PP2C49 was predominantly expressed in the radicle of the germinating seedling and its expression was attenuated in response to CaCl2 treatment (Fig. 6), further indicating the association of HKT1;1 expression in the radicle with the Ca2+-mediated response to salt during germination. Seeds of three allelic mutants of PP2C49 displayed improved salt tolerance during germination compared to wild-type seeds (Fig. 5), in association with Ca2+-induced downregulation of PP2C49 expression (Fig. 6, Supplemental Tables S1 and S4). Therefore, Ca2+ is suggested to downregulate the expression of PP2C49, resulting in attenuated inhibition of HKT1;1, which in turn functions to promote germination in the presence of NaCl by maintaining a low Na+/K+ ratio (Fig. 4).
HKT1;1 is required for Ca2+-mediated maintenance of ion homeostasis under salt stress
Maintaining ion homeostasis at the cellular, tissue and whole-plant levels under salt stress is crucial for appropriate metabolism, physiology, growth and development of plants (Amin et al. 2021). A major harmful feature of salt stress in plants, caused by excessive Na+ levels, is ion toxicity, whereby the accumulation of noxious concentrations of Na+ in the cytosol impairs the essential conservation of cellular K+ level homeostasis (Zhu 2003; Wang and Wu 2013; Sun et al. 2015). With the exception of several C4 plants, Na+ is a nonessential element (Kronzucker et al. 2013; Nieves-Cordones et al. 2016). In contrast, K+ transport is critical for adequate enzyme activity, regulation of membrane potential, control of cytoplasmic and endosome luminal pH, and osmoticum level, which is required for cell-volume regulation (Zhu 2003; Wang and Wu 2013). Therefore, maintaining K+ and Na+ homeostasis is critical for saltstress tolerance.
Here, we sought to assess the role of HKT1;1 in maintaining Na+ and K+ homeostasis at early stages of seed germination, and the possible involvement of Ca2+ signaling in adjusting Na+/K+ ratios under salt stress. The previously demonstrated regulation of HKT1;1 by the NaCl-regulated CAMTA6 (Shkolnik et al. 2019), whether direct or indirect, associates HKT1;1 with salt-responsive Ca2+ signaling. Moreover, pregerminating camta6 mutants were found to accumulate less Na+ in response to NaCl treatment, which was attributed to HKT1;1 and not to other key Na+ transporters, including SOS1 or NHX1 (Shkolnik et al. 2019). Interestingly, the MADS-box TF AGL16, a negative regulator of germinating Arabidopsis plants’ response to salt stress, was shown to bind directly to the CArG motif in the HKT1;1 promoter and suppress its expression (Zhao et al. 2021). In addition, germinating agl16 mutants displayed improved salt tolerance and AGL16-overexpressing seeds were found to be hypersensitive to salt, in association with the hypersensitivity of hkt1 mutants to salt during germination (Fig. 1) (Shkolnik et al. 2019). The possibility that AGL16 is regulated by CAMTA6 should be assessed.
Ion-content analysis, performed to quantify Na+ and K+ concentrations in wild-type and hkt1 pregerminating seedlings, revealed a higher level of Na+ and a lower level of K+ in hkt1 compared to wild-type seedlings treated with NaCl or NaCl and CaCl2 (Fig. 4). Interestingly, supplementation of CaCl2 along with NaCl significantly reduced the accumulation of Na+ while elevating K+ accumulation in wild-type but not hkt1 seedlings, the latter being significantly K+-deprived (Fig. 4). Together, these findings indicate the requirement of a functioning HKT1; 1 to facilitate the low Ca2+-regulated Na+/K+ ratios, reflected by the hkt1 seedling's hypersensitivity to NaCl during germination which is not rescued by CaCl2 application (Fig. 1). Finally, pp2c49 mutants were found to maintain low Na+/K+ ratios under salt stress with or without CaCl2 supplementation (Fig. 5B), further indicating the involvement of PP2C49 in the Ca2+-mediated response to NaCl by negative regulation of HKT1;1 activity.
PP2C49 has been reported to directly interact with HKT1;1, dephosphorylating and inactivating it (Chu et al. 2021). However, the specific phosphorylation sites in HKT1;1 have yet to be identified. To address this issue, we analyzed the HKT1;1 amino acid sequence for serine/threonine residues with high phosphorylation potential. Initially, we profiled the protein's hydropathicity according to the Kyte and Doolittle hydropathicity scale (Kyte and Doolittle 1982) using the ProtScale tool (see Materials and Methods). This analysis indicated domains with a lower hydrophobicity score, thus predicted as more likely to be exposed to kinase activity (Supplemental Fig. S4). We further evaluated each amino acid's phosphorylation potential using the NetPhos tool (see Materials and Methods) (Blom et al. 1999, 2004), where serine/threonine residues that score > 0.5 are considered potential targets for kinase activity. According to this analysis, seven serine/threonine residues were identified as susceptible to phosphorylation at positions 48, 49, 123, 128, 129, 260, and 282 (marked as 1, 2, 3, 5, 6, 7, and 8 in Supplemental Fig. S4). We performed an additional analysis using the MusiteDeep tool (Wang et al. 2017) (see Materials and Methods) which indicated high phosphorylation potential for four serine residues at positions 126, 128, 129, and 384 (marked as 4, 5, 6, and 9 in Supplemental Fig. S4), which gave above-threshold (0.5) post-translational modification scores of 0.77, 0.699, 0.797, and 0.883, respectively (Supplemental Table S7). Characterization and prediction of phosphorylation hotspots in the Arabidopsis proteome have suggested that serine residues that are located right before the amino acids aspartate (D) or glutamic acid (E) have high potential for phosphorylation (Christian et al. 2012). In light of these data, the serine residues at positions 126 and 129 are suggested as immediate candidates for phosphorylation (Supplemental Fig. S4). Nevertheless, identification of actual phosphorylated residues should be empirically assessed.
In contrast to the identification of PP2C49 as a specific inhibitor of HKT1;1, the identity of the kinase(s) that phosphorylates HKT1;1 remains elusive. The observed effect of Ca2+ signaling on the regulation of HKT1;1 suggests that the kinase is a member of the Ca2+-regulated kinases, as shown for activation of the K+ channel AKT1 by the CBL-interacting protein kinase CIPK231 (Sánchez-Barrena et al. 2020). However, empirical identification of the specific kinase that phosphorylates HKT1;1 is still required. In addition to HKT1;1, other salt stress-responsive proteins could be regulated by PP2C49. These might include mitogen-activated protein kinases (MAPKs), because Arabidopsis PP2Cs have been suggested to negatively regulate MAPK activity in signaling pathways of stress responses and development (Meskiene et al. 2003; Schweighofer et al. 2004, 2007; Fuchs et al. 2013).
Ca2+ modifies the transcriptome of germinating seedlings under salt stress
Exposure to salt stress substantially alters gene transcript-accumulation patterns in germinating and young Arabidopsis seedlings (Shkolnik et al. 2019; Sako et al. 2021). The broad influence of the camta6 mutation on the transcriptomic profile of a germinating Arabidopsis seedling under control and saltstress conditions strongly indicates major involvement of Ca2+ signaling in the regulation of gene expression in response to salt (Shkolnik et al. 2019). Pscan analysis of over-represented TF binding-site motifs in the sequences of genes regulated by CaCl2, NaCl, or both combined provided TF lists to further understand the nature of Ca2+'s effect on the possible involvement of the identified TFs in the germinating seedling salt response. Presumed promoters of DEGs that were downregulated in response to the combined treatment contained cis-elements known to be bound by multiple TF members of the TCP family, including TCP2, TCP3, TCP4, TCP14, TCP17, TCP24, and BRC1 (Supplemental Table S6). These bHLH-containing DNA-binding motif (TCP domain) TFs are known to regulate plant development and defense responses by activating the biosynthetic pathways of bioactive metabolites, including brassinosteroids, jasmonic acid, and flavonoids (Li 2015). TCP24 is involved in the regulation of secondary cell wall-thickening processes (Wang et al. 2015). Conversely, analysis of presumed promoters of DEGs that were upregulated in response to the combined treatment revealed other involved TCPs, including TCP7, TCP8, TCP16, TCP20, TCP21, TCP23, and PTF1 (Supplemental Table S6), further suggesting a possible key role for TCPs in modulating the Ca2+-mediated response to salt during germination. Interestingly, cis-elements associated with the function of the ABA-regulated TFs ABI4 and ABI5, known to mediate ABA-controlled seed germination and developmental processes, including response to salt (Finkelstein 1994; Finkelstein and Lynch 2000; Shkolnik and Bar-Zvi 2008; Skubacz et al. 2016; Maymon et al. 2022), were frequently found in the promoters of the DEGs that were upregulated in response to the combined treatment (Supplemental Table S6). Both ABI4 and ABI5 have been demonstrated as transcription co-activators but also as repressors of gene expression (Arenas-Huertero et al. 2000; Söderman et al. 2000; Shkolnik-Inbar et al. 2013; Huang et al. 2017). Seeds of abi4 and abi5 mutants display improved germination rate under salt stress (Quesada et al. 2000; Carles et al. 2002). Collectively, these data suggest that the Ca2+-signaling pathway involves regulation of the expression of ABI4- and ABI5-regulated genes to promote germination in the presence of salt. These data correspond with the functional classification analysis that presented enrichment of ∼12% of the DEGs that were downregulated in response to NaCl treatment as related to “response to ABA,” while ∼14% of the DEGs that were upregulated in response to CaCl2 treatment were classified in this category (Fig. 7, Supplemental Table S5). This classification feature, which was not characterized for DEGs in the combined treatment, possibly due to the two chemicals’ effects canceling each other out, depicts an opposing tendency of NaCl and CaCl2 on ABA-signaling pathways that suggests that Ca2+, along with the control of ion homeostasis, also attenuates the germination-arresting effect of ABA under salt stress. In addition, cis-elements that are associated with the bZIP TF HY5 and its homolog HYH, known for their involvement in light-mediated seedling development (Zhang et al. 2017), were identified in the presumed promoters of DEGs that were downregulated in response to CaCl2 treatment and in those of DEGs that were upregulated in response to NaCl or the combined treatment (Supplemental Table S6). This suggests that Ca2+ functions to adjust the expression of HY5- and HYH-regulated DEGs to allow germination in the presence of salt.
Furthermore, cis-elements that are associated with the activity of members of the CAMTA protein family—CAMTA1, CAMTA2, and CAMTA3—were identified in the presumed promoters of DEGs that were downregulated by CaCl2 treatment and upregulated by NaCl or the combined treatment (Supplemental Table S6). These three CAMTAs have been reported to be involved in the regulation of thousands of genes in response to cold stress (Kim et al. 2013), and activation of CAMTA-repressed genes has been suggested to involve ubiquitin-mediated degradation of CAMTA, as in the case of CAMTA3 (Zhang et al. 2014). Support for the possible substantial involvement of CAMTAs in response to CaCl2 and NaCl was provided by the motif scan performed using the Amadeus-Allegro tool, which revealed the ABRE and potentially CAMTA-binding cis-element motif CACGTGTC (Kaplan et al. 2006; Finkler et al. 2007b; Shkolnik et al. 2019) in the presumed promoters of NaCl- and CaCl2-upregulated DEGs (Fig. 8), in agreement with the reported involvement of CAMTA6 in regulating myriad genes in response to salt stress (Shkolnik et al. 2019). Notably, this specific full motif was identified as occurring four times in the PP2C49 promoter, which was found to be downregulated by CaCl2 (Fig. 6, Supplemental Table S6), one in reverse-complement fashion, 287, 386 and 922 bp, and a single alternative ABRE and CAMTA-binding motif 408 bp upstream of the gene translation start codon (Supplemental Fig. S5)—as previously reported in a genome-wide bioinformatic screen for cis regulatory elements involved in abiotic stress (Zhang et al. 2005). Therefore, CAMTAs are highly likely to function in modulating the complex response to CaCl2 in the presence of salt in pathways that remain to be deciphered.
Materials and methods
Plant materials, growth, and stress assays
Arabidopsis (Arabidopsis thaliana) Col-0 plants were used in this research. The following mutants were obtained from the Arabidopsis Stock Center in Columbus, OH: hkt1 (CS68521), hkt1-4 (CS68092), pp2c49-1 (SALK_111549C), pp2c49-2 (SALK_015078C), and pp2c49-3 (SALK_135177C). HKT1;1pro:GUS-expressing plants were generated by subcloning the 500- or 2,000-bp genomic DNA fragment upstream of the HKT1;1 (At4G10310) gene translation start codon into pCAMBIA 1391Z binary vector at the SalI and EcoRI sites upstream of the GUS-coding sequence, as previously described (Shkolnik et al. 2019). PP2C49pro:GUS-expressing transgenic plants were generated by subcloning the 1,151-bp genomic DNA fragment upstream of the PP2C49 (AT3G62260) gene translation start codon into pCAMBIA 1391Z at the SalI and EcoRI sites. AT4G31830pro-HKT1;1CDS (HKT1;1-RE)-expressing transgenic plants were generated for radicle-specific expression of HKT1;1, as previously described for the AT4G31830 expression pattern (Jeong et al. 2014). The construct was generated by introducing 692 bp of the promoter region of AT4G31830 into the pART27 binary vector recognition sites of SacI and NotI. The HKT1;1 coding sequence construct was generated by PCR with the total cDNA preparation as template which was synthesized using the High-Capacity cDNA Reverse Transcription Kit (Thermo Fisher Scientific) with oligo-dT as the primer, followed by PCR using Q5 high-fidelity DNA polymerase (NEB) with specific primers (Supplemental Table S2), and introduced into the vector's NotI and SpeI sites; the Octopine Synthase terminator was PCR-amplified using specific primers (Supplemental Table S8) and introduced into the SpeI and NheI sites. The construct was transformed into hkt1-4 plants using the floral dip method (Clough and Bent 1998) and transformants were selected based on resistance to kanamycin.
Seed surface sterilization and germination assays in the presence of different NaCl concentrations were performed as previously described (Shkolnik and Bar-Zvi 2008). Germination on NaCl, CaCl2 or their combination, and CaCl2 or mannitol assays were performed in the same manner. A seedling was considered germinated when green fully unfurled cotyledons were observed. Treatments with NaCl prior to GUS staining (see GUS staining section below), and RNA isolation for RNA-sequencing analysis and RT-qPCR were performed by seed imbibition at 4 °C in the dark for 2 to 3 d prior to plating on Whatman filter paper (grade 1) soaked with 0.25× MS medium (Murashige and Skoog 1962) and supplemented with the indicated chemicals. Pregerminating seedlings were gently ejected manually, using curved fine forceps, 16 h after starting the treatment. Separation of cotyledon and radicle tissues for RNA isolation and subsequent RT-qPCR analysis was performed by relatively rough seedling ejection from the seed coat and tissue collection in separate test tubes using a fine pipette under a binocular. Treatment of several-day-old seedlings with NaCl, CaCl2, or both was performed by placing the seedlings such that the root is in contact with the agar-solidified 0.25× MS medium supplemented with the indicated chemicals, and the shoot is in the air to avoid direct contact with NaCl, as previously described (Shkolnik-Inbar and Bar-Zvi 2012; Shkolnik et al. 2019).
GUS staining
GUS staining was performed as previously described (Weigel and Glazebrook 2002). Briefly, ejected seedlings were treated with 300 μL of 90% (v/v) acetone for 1 min, washed with 1 mL staining solution (50 mm sodium phosphate buffer pH 7.0, 2 mm ferrocyanide, 2 mm ferrocyanide and 0.2% triton x-100) followed by 1 h incubation at 37 °C in staining solution supplemented with 2 mm of X-Gluc (5-bromo-4-chloro-3-indolyl-beta-D-glucuronic acid, cyclohexylammonium salt). Images were taken using the Nikon SMZ18 stereoscope system equipped with a DS-Fi3 camera.
RT-qPCR analysis
Total RNA was isolated from pregerminating seedlings using the ZR Plant RNA MiniPrep Kit (Zymo Research), and total cDNA was synthesized using the High-Capacity cDNA Reverse Transcription Kit (Thermo Fisher Scientific). The reaction mixture was prepared according to the manufacturer's instructions, with random primers, and supplemented with 1 µg of total RNA. PCR mixtures (10 µL), containing 5 µL Fast SYBR Green Master Mix (Applied Biosystems by Thermo Fisher Scientific), 500 nm reverse and forward primers designed to amplify 80 to 120 bp of the genes of interest, and 20 ng cDNA were subjected to the Rotor-Gene Q 5-Plex HRM real-time PCR system (Qiagen), using the default program. The PP2A (AT1G69960) gene was used as an endogenous control. Relative quantification data were analyzed by the Rotor-Gene Q Pure Detection software V2.3.5 (Qiagen).
Ion-content analysis
Control, NaCl-, CaCl2-, or NaCl–CaCl2-treated pregerminating seedlings were ejected from seeds (see Plant materials, growth, and stress assays) and samples for determination of Na+ and K+ content were prepared as previously described (Kalifa et al. 2004; Shkolnik-Inbar et al. 2013; Shkolnik et al. 2019). In each experimental repetition, 40 seedlings of each line were sampled. Ion-content was determined using Arcos ICP-OES (Spectro/Ametek).
RNA sequencing and bioinformatics analysis
RNA was isolated from ∼50 pregerminated seedlings (three independent replicates, total n ∼ 150) of Col-0 that were treated without (control) or with 200 mm NaCl, 10 mm CaCl2 or both chemicals for 16 h (see Plant materials, growth, and stress assays) using the ZR Plant RNA MiniPrep Kit (Zymo Research). RNA sequencing was performed at The Mantoux Institute for Bioinformatics of the Nancy and Stephen Grand Israel National Center for Personalized Medicine, Weizmann Institute of Science, Rehovot, Israel. Illumina RNA sequencing was performed in triplicate (Illumina Hiseq 2500; Illumina TruSeq RNA library Preparation Kit v2), resulting in 50-bp reads. Sequencing libraries were prepared using LIB_PREP_PROTOCOL. READ_TYPE reads were sequenced on NUM_LANES lane(s) of an Illumina ILLUMINA_INSTRUMENT. The output was ∼18 million reads per sample. Mapping and alignment were performed using TopHat version 2.1.1 and Bowtie2 version 2.5.1 (reference genome TAIR10), followed by gene counting performed by HTseq-count version 2.0.3. Values above 10 were used for normalization and gene-expression analysis (DESeq2 version 3.17). Partek Genomics Suite was used for further analysis (version 7.20.083). Functional classification of DEGs was performed with the DAVID Gene Functional Classification tool (https://david.ncifcrf.gov/). The tool was used with multiple database sources of functional annotations. Enriched significant classifications were selected based on P values (P ≤ 0.05). Enrichment of the upregulated and downregulated DEGs was classified by biological process, molecular function, and cellular component. Venn diagrams were created using the Venny tool (http:/bioinfogp.cnb.csic.es/tools/venny/index.html; Oliveros 2015). The Amadeus-Allegro tool (http:/acgt.cs.tau.ac.il/allegro/download.html; Linhart et al. 2008; Orenstein et al. 2012) was used for motif analysis. Motif enrichment was performed on 1,000 bp of the genomic sequences upstream of the presumed transcription start sites of the DEGs. Eight-base-long motifs were searched for based on the JASPAR regulatory motif database (https://jaspar.genereg.net/matrix/MA0970.1/). Evaluation of hydropathicity of amino acids in HKT1;1 was performed using the ProtScale tool (https://web.expasy.org/protscale/) and identification of potential phosphorylation sites was performed using the NetPhos-3.1 tool (https://services.healthtech.dtu.dk/services/NetPhos-3.1/) (Blom et al. 1999, 2004) and the MusiteDeep tool (https://www.musite.net/) (Wang et al. 2017).
Statistical analysis
Data were analyzed using JMP software version pro16 and Microsoft Excel 2019 ToolPak.
Accession numbers
Accession numbers of the major genes investigated in this research are: HKT1;1, AT4G10310; PP2C49, AT3G62260.
Acknowledgments
We thank Efraim Lewinsohn (Agricultural Research Organization—Volcani Institute, Newe Ya’ar, Israel) for critical reading of the manuscript
Author contributions
A.E.J.C. and D.S. designed the experiments and research plan; A.E.J.C., D.S., Y.K., and S.D. performed the experiments; A.E.J.C., D.S., T.A.H., A.F., and M.P.C. analyzed the data and wrote the article.
Supplemental data
The following materials are available in the online version of this article.
Supplemental Figure S1. Germination assay on mannitol-containing media.
Supplemental Figure S2. Root development phenotyping of hkt1 mutants in response to NaCl, CaCl2, or combined treatments.
Supplemental Figure S3. Venn diagrams of differentially salt-responsive genes.
Supplemental Figure S4. Analysis of HKT1;1 amino acid sequence for potential serine/threonine phosphorylation sites.
Supplemental Figure S5.PP2C49 promoter sequence.
Supplemental Table S1. List of differentially expressed upregulated and downregulated genes for CaCl2 treatment vs. control.
Supplemental Table S2. List of differentially expressed upregulated and downregulated genes for NaCl treatment vs. control.
Supplemental Table S3. List of differentially expressed upregulated and downregulated genes for CaCl2–NaCl treatment vs. control.
Supplemental Table S4. Lists of DEGs obtained by the Venny tool.
Supplemental Table S5. Functional classification of NaCl and/or CaCl2-responsive genes obtained by DAVID Gene Functional Classification tool.
Supplemental Table S6. Promoter scan analysis for transcription factor-binding sites in the upregulated and downregulated promoters of CaCl2/NaCl/CaCl2–NaCl treatment vs. control using Pscan tool.
Supplemental Table S7. Phosphorylation site prediction in HKT1;1 by the MusiteDeep tool.
Supplemental Table S8. Primer list.
Funding
This research was supported by the Israel Science Foundation (grant No. 756/20 to D.S.) and by a German-Israeli Foundation for Scientific Research and Development (grant No. G-1482-423.13/2018 to D.S. and Katharina Bürstenbinder, University of Marburg, Germany). T.A.H. is supported in part by a fellowship from the Edmond J. Safra Center for Bioinformatics at Tel-Aviv University, Israel.
Data availability
The data underlying this article are available in the article and in its online supplementary material.
Dive Curated Terms
The following phenotypic, genotypic, and functional terms are of significance to the work described in this paper:
References
Author notes
The author responsible for distribution of materials integral to the findings presented in this article in accordance with the policy described in the Instructions for Authors (https://dbpia.nl.go.kr/plphys/pages/General-Instructions) is Doron Shkoknik ([email protected]).
Conflict of interest statement. None declared.
