


Abstract
In plants, sucrose nonfermenting 1 (SNF1)-related protein kinase 1 (SnRK1) is a key energy sensor that orchestrates large-scale transcriptional reprograming to maintain cellular homeostasis under energy deficit. SnRK1 activity is under tight negative control, although the exact mechanisms leading to its activation are not well understood. We show that the Arabidopsis (Arabidopsis thaliana) DOMAIN OF UNKNOWN FUNCTION (DUF581) protein DUF581-9/FCS-like zinc finger 3 binds to the catalytic SnRK1.1 α subunit (KIN10) to inhibit its activation by geminivirus rep-interacting kinase (GRIK)–dependent T-loop phosphorylation. Overexpression of DUF581-9 in Arabidopsis dampens SnRK1 signaling and interferes with adaptation to dark-induced starvation. The presence of DUF581-9 significantly reduced SnRK1 activity in protoplasts and in vitro. This was accompanied by a reduction in T175 T-loop phosphorylation and also diminished KIN10 auto-phosphorylation. Furthermore, DUF581-9 reduced binding of the upstream activating kinase GRIK2 to KIN10, explaining the reduced KIN10 T-loop phosphorylation. Ectopically expressed DUF581-9 protein was rapidly turned over by the proteasome when Arabidopsis plants were subjected to starvation treatment, likely releasing its inhibitory activity on the SnRK1 complex. Taken together, our results support a model in which DUF581-9 negatively regulates SnRK1 activity under energy sufficient conditions. Turnover of the protein provides a rapid way for SnRK1 activation under energy deficit without the need of de novo protein synthesis.
Introduction
In plants, biotic and abiotic stresses typically lead to cellular energy depletion. As a response, transcriptional and metabolic reprograming of the cell results in the downregulation of energy-consuming processes, including a cessation of growth and an induction of catabolic reactions to ensure resource allocation in support for stress tolerance and survival (Baena-Gonzalez 2010). A central regulator of the low-energy response is the energy-sensor protein kinase sucrose nonfermenting 1 (SNF1)-related protein kinase 1 (SnRK1), which is orthologous to the AMP-activated protein kinase (AMPK) and SNF1 in mammals and yeast, respectively (Broeckx et al. 2016). Stress-mediated activation of SnRK1 results in the direct phosphorylation of several central biosynthetic enzymes to reduce their activity (Halford and Hey 2009; Nukarinen et al. 2016). In addition, SnRK1 phosphorylates a range of different transcription factors (summarized in Broeckx et al. 2016) to mediate large-scale transcriptional reprograming of the cell. Transient overexpression of the SnRK1.1 catalytic α subunit KIN10 in Arabidopsis (Arabidopsis thaliana) protoplasts resulted in a transcriptional profile reminiscent of various starvation conditions and led to the identification of ∼1,000 putative SnRK1 target genes (Baena-González et al. 2007).
The SnRK1 holoenzyme is a heterotrimeric complex consisting of a catalytic α subunit and regulatory β and γ subunits (Broeckx et al. 2016). The α subunit consists of a highly conserved N-terminal Ser/Thr kinase domain and a C-terminal regulatory domain, which mediates interaction with the β and γ subunits. The β subunit not only acts as complex scaffold but also contributes to complex localization and substrate specificity (Ramon et al. 2019). In Arabidopsis (A. thaliana), the catalytic α subunit is represented by 2 isoforms, KIN10 (At3g01090) and KIN11 (At3g29160), both of which are expressed ubiquitously, although KIN10 accounts for the majority of SnRK1 activity (Jossier et al. 2009). SnRK1 activity is regulated by phosphorylation/dephosphorylation of a T-loop threonine in the catalytic α subunit (T175 of KIN10 and T176 in KIN11) involving upstream geminivirus rep-interacting kinases (GRIK) 1 and 2 (Shen et al. 2009). SnRK1 also undergoes substantial auto-phosphorylation (Baena-González et al. 2007), and a model has been put forward in which upstream kinases are required for initial phosphorylation and activation of newly synthesized SnRK1 proteins, while full activation requires additional self-phosphorylation events. For SNF1 from yeast and AMPK from mammals, a strict association between T-loop phosphorylation with kinase activity on the one hand, and cellular energy level and T-loop phosphorylation on the other hand, has been firmly established (Gowans et al. 2013). This association is much less clear for SnRK1 (Broeckx et al. 2016). Although SnRK1 T-loop phosphorylation appears to be required for kinase activity per se (Glab et al. 2017), its overall phosphorylation level does generally not change substantially even under conditions in which there is either an increase or decrease in SnRK1 activity (Baena-González et al. 2007; Coello et al. 2012; Rodrigues et al. 2013). As an exception, a clear increase in SnRK1 T-loop phosphorylation has been observed under submergence (Cho et al. 2016).
Recent evidence suggests that, rather than being activated upon energy deficit like AMPK and SNF1, SnRK1 is activated by default but its activity is repressed under energy sufficient conditions (Crepin and Rolland 2019; Ramon et al. 2019). Several molecules, including metabolites and proteins, have been described to negatively regulate SnRK1 signaling. For instance, the intermediate of trehalose biosynthesis, trehalose-6-phosphate (T6P), which acts as fuel gauge to signal sucrose availability (Lunn et al. 2006), was shown to inhibit SnRK1 activity in a tissue-specific and developmental stage-specific manner (Zhang et al. 2009; Debast et al. 2011; Martínez-Barajas et al. 2011; Nunes et al. 2013). Recently, T6P was shown to directly bind to the SnRK1 α subunit to weaken the GRIK1–KIN10 association and thus interfering with T-loop phosphorylation (Zhai et al. 2018). Emanuelle et al. (2015) identified a heat-labile, >30 kDa, soluble proteinaceous factor present in the lysate of young, growing, 3-wk-old rosette leaves that inhibited SnRK1 catalytic activity when added to the recombinant kinase complex in vitro. However, the identity of this factor let alone its mode of action is currently unknown. Known SnRK1 interacting proteins that negatively regulate its signaling activity include PLEIOTROPIC REGULATORY LOCUS1 (Bhalerao et al. 1999) and SnRK1A INTERACTING NEGATIVE REGULATOR PROTEINS. The latter interacts with the catalytic domain (CD) of SnRK1A in rice in order to antagonize SnRK1 activity and thus prevent its overactivation in response to abscisic acid signaling (Lin et al. 2014).
We have previously demonstrated that proteins containing a domain of unknown function (DUF) 581 interact with the catalytic α subunits of SnRK1 (KIN10/11) from Arabidopsis via their zinc finger containing DUF581 domain (Nietzsche et al. 2014). DUF581 proteins are confined to the plant kingdom and constitute a family of 18 members in Arabidopsis. Besides the variable N- and C-termini, the conserved DUF581 is necessary and sufficient for the proteins to bind to KIN10/11, indicating that the variable portion could impart some sort of functional specificity to individual isoforms. Expression of the DUF581 genes in Arabidopsis is highly responsive to hormones and environmental cues, such as ABA treatment, hypoxia, heat, and nutrients (Nietzsche et al. 2014; Jamsheer and Laxmi 2015). In addition to SnRK1, DUF581 proteins interact with a range of additional proteins, many of which participate in central cellular signaling pathways or act in transcriptional regulation (Nietzsche et al. 2016). However, a functional relationship between SnRK1 signaling and DUF581 proteins has so far not been firmly established. A recent study suggests that at least 2 of the DUF581 proteins might act as negative regulators of SnRK1 activity, although their mode of action remains unclear (Jamsheer et al. 2018).
In the present study, we demonstrate that the DUF581 family member DUF581-9 (At2g44670/FLZ3) acts as a negative regulator of SnRK1 in planta and in vitro. Overexpression of DUF581-9 in transgenic Arabidopsis lines attenuates SnRK1-mediated responses. We show that DUF581-9 reduces SnRK1 activity by binding to KIN10 and weakening its interaction with the upstream activating kinase GRIK. The resulting reduction in T-loop phosphorylation prevents further auto-phosphorylation events. DUF581-9 itself appears to be degraded by the proteasome under energy limiting conditions, thus relieving its inhibitory effect on the signaling pathway when required.
Results
DUF581-9 expression is downregulated during dark-induced starvation
In order to obtain a deeper understanding concerning the functional relevance of the DUF581/KIN interaction for SnRK1 signaling, we initially concentrated our efforts on DUF581-9 (FLZ3; At2g44670), the smallest member of the protein family with only 9 amino acid residues N-terminal and 34 residues C-terminal, respectively, of the DUF581. To analyze the expression of DUF581-9 under SnRK1 activating conditions, 4-wk-old Arabidopsis plants were subjected to sudden darkness for 24 h, and subsequently mRNA levels were monitored by reverse transcription quantitative PCR (RT-qPCR). As shown in Fig. 1, DUF581-9 expression was reduced by ∼50% in dark treated rosette leaves when compared to the control. Conversely, when dark treated plants were allowed to recover in SD for 19 h, DUF581-9 expression was induced ∼2-fold relative to untreated leaves. Thus, DUF581-9 expression is reduced in conditions associated with the activation of SnRK1 signaling, while an induction of expression occurs during the recovery from starvation.
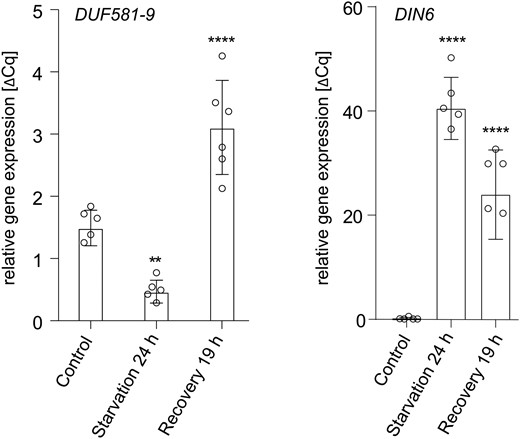
DUF581-9 expression is reduced under starvation conditions. Four-week-old Col-0 Arabidopsis plants grown in short day (8 h light/16 h dark) were subjected to 24 h darkness followed by 19 h recovery under normal light conditions. Whole rosettes were harvested and used for RNA extraction and subsequent cDNA synthesis followed by RT-qPCR. UBIQUITIN CONJUGATING ENZYME 9 (UBC9) was used as a reference gene. Each bar represents the mean of 5 to 6 biological replicates (indicated as single dots). Error bars indicate ±Sd, and asterisks mark statistically significant differences relative to the untreated control (1-way ANOVA analysis followed by Sidak’s multiple comparison test) **P < 0.01, ****P < 0.0001. The experiment was repeated twice with similar results.
To investigate DUF581-9 expression at a higher spatial resolution, a ProDUF581-9::GUS fusion construct was transformed into Arabidopsis. Multiple transgenic lines were examined for GUS activity at various developmental stages (Supplemental Fig. S1). In vegetatively growing plants, strongest GUS staining was observed in and around the shoot apex of the plants and in the proximal regions of the young emerging true leaves (Supplemental Fig. S1A). As the leaves grew, GUS expression decreased in a tip-to-base manner. In accordance with the RT-qPCR data of DUF581-9 expression, GUS staining faded when the plants were subjected to dark-induced starvation and resumed during a recovery period (Supplemental Fig. S1A). In flowers of ProDUF581-9::GUS lines, staining was mainly confined to the pistil (Supplemental Fig. S1B).
Modulation of DUF581-9 expression affects SnRK1-dependent responses in Arabidopsis
To study potential functional links between DUF581-9 and SnRK1 signaling in planta, a duf581-9 knock-out line as well as 2 transgenic Arabidopsis lines constitutively overexpressing DUF581-9 were established (DUF581-9 OE #1 and #2; Supplemental Fig. S2). Lines with altered DUF581-9 expression were grown alongside with Col-0 control plants under SD conditions in soil for 4 wk. The expression of selected SnRK1 marker genes (Baena-González et al. 2007) was investigated by RT-qPCR. As previously reported, 6 h of starvation treatment led to a strong induction of DARK INDUCED 6 (DIN6), encoding ASPARAGINE SYNTHETASE 1, as well as of TREHALOSE-6-PHOSPHATE SYNTHASE 8 (TPS8; Fig. 2A). In the case of DIN6, this induction was significantly enhanced in duf581-9 plants, while for both SnRK1 marker genes, expression was reduced in DUF581-9 OE lines when compared with the control under the same experimental conditions (Fig. 2A). In order to investigate if modulation of DUF581-9 expression affects the ability to cope with carbon limitation, wild type, DUF581-9 OE, and knock-out plants were grown for 3 wk under SD conditions. Subsequently, the plants were subjected to a dark period of 10 d followed by a recovery for further 7 d under the initial growth conditions. Plant survival was assessed based on the emergence of new leaves during the recovery period. Approximately 80% of the wild-type control plants were able to survive the treatment, while this rate was reduced to 40% and 20% in line DUF581-9 OE #1 and #2, respectively (Fig. 2B; Supplemental Fig. S3). Relative to control plants, both DUF581-9 OE lines appeared to be phenotypically more compromised already after the dark treatment and failed to recover after transfer to normal growth conditions (Supplemental Fig. S3). The duf581-9 line displayed unaltered survival relative to control plants (Fig. 2B; Supplemental Fig. S3).
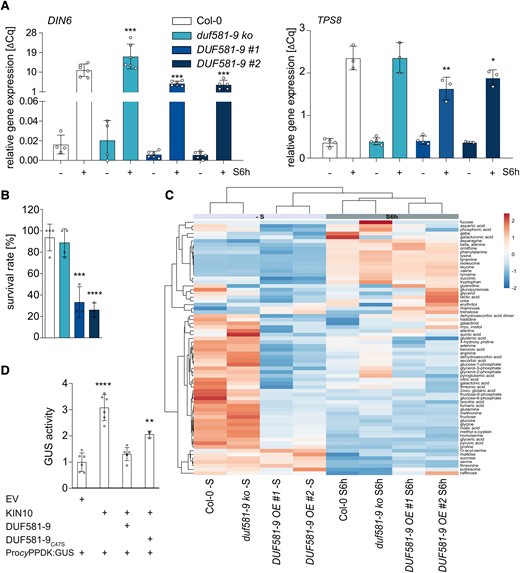
Ectopic overexpression of DUF581-9 inhibits SnRK1 signaling and decreases plant survival under starvation. A) Expression of SnRK1 marker gene DARK INDUCED 6 (DIN6) and TREHALOSE-PHOSPHATE SYNTHASE 8 (TPS8) in 4-wk-old plants exposed to 6 h darkness (S6h). UBC9 was used as reference gene. Each bar represents the mean of 4 to 6 biological replicates (indicated as single dots). Error bars indicate ±Sd, and asterisks mark statistically significant differences relative to Col-0 (1-way ANOVA analysis followed by Sidak’s multiple comparison test) *P < 0.05, **P < 0.01, ***P < 0.001. The experiment was repeated at least 3 times. B) Survival rate was determined in percentage after 10 d of dark-induced starvation and 7 d recovery of 3-wk-old Col-0, duf581-9 ko, and DUF581-9 OE plants. Bars represent mean of 4 pooled samples (5 biological replicates, respectively) ± Sd. Statistical analysis was carried out using 1-way ANOVA followed by Dunnett’s posttest. Significant differences against Col-0 ***P < 0.001, ****P < 0.0001. Three repetitions showed similar results. C) Gas chromatography-MS analysis of 4-wk-old Col-0, duf581 9 ko, and DUF581-9 OE plants (n = 6). Plants were grown in soil under short day conditions (8 h of light/16 h of dark), and rosettes were harvested either 6 h after the onset of light or after 6 h of darkness (30 min Zeitgeber time). Metabolite data represent absolute values during light and dark conditions. The log2 fold change scale is indicated above the heat map. A negative score, depicted in blue, represents decreased levels, while a positive score (red color) shows increased levels. The depth of the color corresponds to the magnitude of the change in levels. Rows are centered; unit variance scaling is applied to rows. Rows are clustered using correlation distance and average linkage. Columns are clustered using Euclidean distance and average linkage. For details, see Supplemental Table S1. The experiment was repeated twice with comparable results. D) Investigation of in vivo SnRK1 activity in a protoplast transactivation assay based on the SnRK1 responsive promoter of cyPPDK2 fused to the GUS reporter gene. The ProcyPPDK::GUS reporter construct was coexpressed with CaMV35S-driven KIN10 or DUF581-9/DUF581-9C47S effector constructs, respectively. Bars represent mean of GUS activity ± Sd (n = 3 to 6). Asterisks mark statistically significant differences relative to the EV control (1-way ANOVA analysis followed by Dunnett’s multiple comparison test) **** = P < 0.0001; **P < 0.01. The experiment was carried out twice with comparable results.
Metabolite profiling of Arabidopsis plants with altered expression of DUF581-9 revealed major metabolic shifts in DUF581-9 OE lines. While the duf581-9 mutant clustered with control plants, DUF581-9 OE lines formed a separate cluster in light grown plants as well as after 6 h starvation treatment (Fig. 2C; Supplemental Table S1). Surprisingly, metabolic changes in DUF581-9 OE lines relative to control plants were more pronounced during the light period. Under illumination, especially trehalose was increased in DUF581-9 OE lines, while hexoses like glucose or fructose were decreased, supporting the notion that DUF581-9 overexpression affects carbohydrate balance. Overexpression of DUF581-9 seems to grossly affect amino acid levels, most of which show a decrease in the light. Notably, DUF581-9 overexpression plants show reduced arginine, glutamate, glutamic acid as well as GABA levels in the dark relative to control and duf581-9 lines. In addition, intermediates of the tricarboxylic acid cycle such as citric acid, succinic acid, malate, and fumaric acid were decreased in DUF581-9 OE lines particularly during illumination. During dark-induced starvation, differences in the metabolic profile between DUF581-9 OE lines and controls were far less pronounced, although the increase in amino acid content, especially in branched chain amino acids and their degradation products, confirms the induction of the starvation response in all the plants tested (Fig. 2C; Supplemental Table S1).
These data thus suggest that DUF581-9 OE lines are affected in their ability to maintain metabolic homeostasis especially during the light period.
Given the previous observation that DUF581-9 interacts with KIN10/11 in yeast (Nietzsche et al. 2014), we assumed that the effect of DUF581-9 overexpression on SnRK1 signaling is directly mediated by this interaction. In order to test this hypothesis, the ectopically expressed DUF581-9 protein was pulled down from crude extracts by virtue of its C-terminal myc-tag. Subsequent immunoblotting of the eluate using an anti-KIN10 antibody yielded a strong signal in the pull-down from the transgenic lines, while no signal was observed in the wild-type control (Supplemental Fig. S4A). This indicates that the ectopically expressed DUF581-9 protein interacts with KIN10 in planta. Furthermore, an MS analysis of the eluate identified all SnRK1 subunits to be pulled down by DUF581-9 (Table 1). These data strongly suggest that DUF581-9 associates with the SnRK1 heterotrimeric complex in planta. No direct interaction of DUF581-9 with subunits of the SnRK1 complex other than KIN10 could be observed in yeast indicating that these are pulled down indirectly by virtue of their binding to the catalytic subunit (Supplemental Fig. S4B).
SnRK1 subunits identified in a DUF581-9 myc IP-MS
| Gene name | Sum PEP score | Coverage (%) | # Peptides | # PSMs | Col-0 | DUF581-9 OE |
|---|---|---|---|---|---|---|
| DUF581-9 (FLZ3) | 193.012 | 57 | 12 | 2733 | − | + |
| KIN10/KIN11 | 69.004 | 23 | 11 | 251 | − | + |
| KINß1 | 12.888 | 21 | 3 | 54 | − | + |
| KINß2 | 27.531 | 30 | 6 | 232 | − | + |
| KINßɣ (SNF4) | 50.905 | 15 | 8 | 458 | − | + |
We next assessed the effect of DUF581-9 on SnRK1 activity in a protoplast transactivation assay based on the SnRK1 responsive promoter of the Arabidopsis cytosolic pyruvate phosphate dikinase (cyPPDK) gene fused to the GUS reporter gene (Henninger et al. 2022). Cotransfection of Arabidopsis protoplasts with the pPPDK2::GUS plasmid and a construct expressing KIN10 led to significant induction of the GUS reporter gene when compared with a control with the reporter plasmid only (Fig. 2D). When the same plasmid combination was supplemented by a DUF581-9 expressing construct, no significant induction of GUS activity could be observed. Addition of the DUF581-9C47S variant, previously demonstrated to be unable to bind KIN10 in yeast (Nietzsche et al. 2014), the effect on reporter gene expression relative to the wild-type protein was reduced (Fig. 2D). This indicates that the full inhibitory effect of DUF581-9 on KIN10 requires integrity of the DUF581.
Taken together, the data strongly suggest that DUF581-9 acts as a negative regulator of SnRK1 signaling in Arabidopsis through direct interaction with the SnRK1 holocomplex.
DUF581-9 prevents activation of KIN10 by its upstream kinase GRIK
To further explore the inhibitory mechanism of DUF581-9 on KIN10, we employed an in vitro kinase assay based on Escherichia coli produced recombinant proteins coupled to a sensitive and specific staining of phosphorylated proteins in SDS gels. The assay mixture contained GRIK2, which is required for T-loop phosphorylation (T175) of KIN10 and thus activation of the catalytic α subunit KIN10, and the SAMS peptide fused to MBP acting as a generic SnRK1 substrate. When recombinant GRIK2, KIN10, and SAMS were combined into the same assay mixture, phosphorylation signal for all 3 proteins could be detected (Fig. 3A). In contrast, the inclusion of recombinant DUF581-9 into the assay mixture strongly suppressed KIN10 phosphorylation, also preventing SAMS phosphorylation by KIN10 (Fig. 3A), indicating that DUF581-9 interferes with SnRK1 activity in vitro. In accordance with previous observations, addition of the DUF581-9C47S variant did barely reduce the KIN10 phosphorylation signal as well as SAMS phosphorylation in vitro (Fig. 3A). In addition, DUF581-9 yields a phosphorylation signal in the presence of KIN10 and thus serves as a KIN10 phosphorylation substrate in vitro independent of the C47S substitution (Fig. 3A). When KIN10 was replaced by a catalytically inactive ATP-binding site mutant (KIN10K48R), no auto-phosphorylation of KIN10 as well as no DUF581-9 or SAMS signal was detected (Fig. 3A). To assess SAMS phosphorylation by KIN10 in a quantitative manner, we measured the incorporation of radiolabeled phosphate (32P-γATP) into the peptide using the same in vitro assay setup as above. The measurement revealed a significant reduction in the incorporation of label in the presence of DUF581-9 when compared with control conditions (Fig. 3B). Here, the presence of DUF581-9C47S had no inhibitory effect on KIN10 activity but rather led to a stimulation of label incorporation likely through increased DUF581-9C47S phosphorylation. Specificity of the assay conditions for KIN10 activity was verified by replacing the native enzyme with its inactive KIN10K48R variant (Fig. 3B).
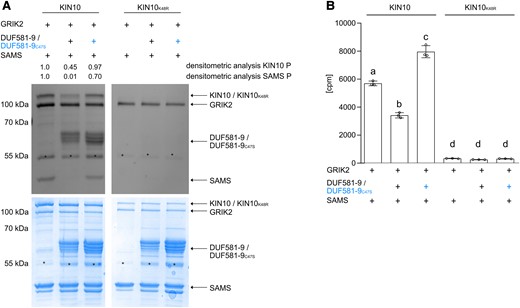
DUF581-9 inhibits KIN10 kinase activity in vitro. Analyses of KIN10 kinase activity in vitro using recombinant MBP-tagged full length GRIK2, KIN10, KIN10K48R, DUF581-9, DUF581-9C47S, and the generic KIN10 substrate SAMS. Protein phosphorylation was visualized by A) ProQ Diamond Phosphostain including densitometric analysis of KIN10 and SAMS phosphorylation levels, as well as the respective Coomassie stained protein loading control. Asterisks indicate an unspecific protein band. Experiment was carried out at least 3 times with similar results. B) In vitro kinase assay using 32P-γATP was performed with MBP-tagged recombinant proteins. Catalytically inactive MBP-KIN10K48R served as a negative control. Bars represent mean of 3 measurements ± Sd, and letters mark statistically significant differences relative to the control without DUF581-9 or DUF581-9C47S (1-way ANOVA analysis followed by Tukey’s multiple comparison test, P < 0.0001). Three repetitions showed similar results.
An incremental reduction of DUF581-9 amount in the assay mixture led to a partial recovery of SAMS phosphorylation and thus KIN10 activity (Fig. 4A). A densitometrical analysis of SAMS phosphorylation revealed a strong negative correlation between the amount of DUF581-9 and SAMS staining intensity (Fig. 4B). However, no correlation was found between the DUF581-9 phosphorylation signal and the amount of SAMS present in mixture (Supplemental Fig. S5). This indicates that the inhibitory effect of DUF581-9 on SAMS phosphorylation is not due to substrate competition.
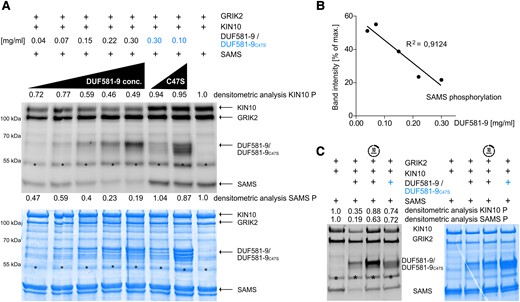
KIN10 inhibition by DUF581-9 is dose dependent. Assay of in vitro KIN10 kinase (full length) activity depending on DUF581-9 amount. Protein phosphorylation levels were visualized by A) ProQ Diamond Phosphostain and quantified by densitometric analysis of phosphorylated KIN10 and SAMS protein phosphorylation levels. One low and one high concentrations were used for the DUF581-9C47S negative control. As positive control served a kinase assay mixture containing GRIK2, KIN10 as well as its SAMS substrate (far right lane). B) Negative correlation of SAMS phosphorylation levels and DUF581-9 protein amounts. C) Kinase assay was performed as before, except that DUF581-9 was added to the mixture 10 min after all other components. Coomassie staining served as protein loading control. Asterisks indicate an unspecific protein band.
Since DUF581-9 has no obvious enzymatic function that could interfere with KIN10 phosphorylation, the dose dependence of its inhibitory effect points toward a stoichiometric mechanism of KIN10 inhibition. Indeed, when GRIK2, KIN10, and SAMS were allowed to preincubate for 10 min before the addition of DUF581-9, the inhibitory effect on KIN10 activity and, subsequently, SAMS phosphorylation was abolished (Fig. 4C). This shows that DUF581-9 is not able to interfere with KIN10 activity once the kinase has been activated by GRIK2 or revert its activation, suggesting a steric mechanism of inhibition.
DUF581-9 interferes with T-loop phosphorylation of KIN10
Phosphorylation of the T-loop within the CD of the SnRK1 α subunit is essential for its activation (Baena-González et al. 2007; Shen et al. 2009; Crozet et al. 2010; Rodrigues et al. 2013). To narrow down the effect of DUF581-9 on KIN10 phosphorylation, we assessed the T-loop phosphorylation in vitro more directly using an anti-phospho-α-AMPK (T172) antibody that specifically recognizes KIN10 phosphorylated at T175 (Sugden et al. 1999; Baena-González et al. 2007). T-loop phosphorylation of KIN10 by GRIK2 was readily detectable in the absence of DUF581-9, while only a faint signal was observed upon inclusion of the DUF581 protein (Fig. 5A). In turn, addition of the DUF581-9C47S variant did not reduce the T-loop phosphorylation signal. In order to obtain a broader picture of the effect of DUF581-9 on KIN10 in vitro phosphorylation, specific sites were mapped using LC-MS/MS. When GRIK2, KIN10, and the DUF581-9C47S variants were present in the assay mixture, 4 phosphorylation sites in addition to T175 could robustly be detected within the KIN10 polypeptide (S29; S152; S338/339; S361; Fig. 5B). As these sites remain unphosphorylated in the KIN10K48R variant, they likely result from auto-phosphorylation triggered by initial T-loop phosphorylation through GRIK2 (Fig. 5B). A quantitative analysis revealed that the presence of DUF581-9 significantly reduced protein phosphorylation at all sites up to ∼70% (Fig. 5B). Phosphorylation of GRIK2 activation loop (T153) was unaffected by DUF581-9, indicating that GRIK2 activity is not inhibited (Supplemental Table S2).
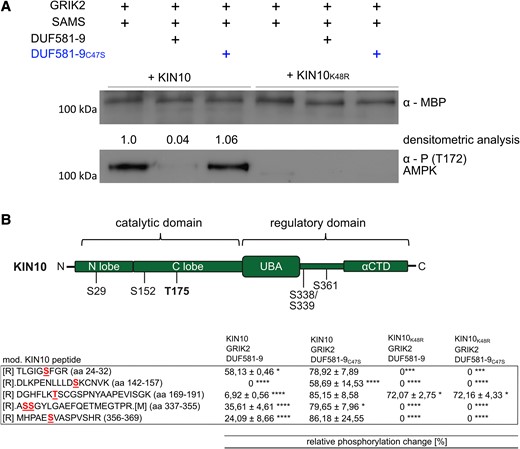
DUF581-9 interferes with KIN10 T175 T-loop phosphorylation. A) Western blot analysis of recombinant MBP-KIN10 (full length) kinase assay using an anti-MBP and anti-phospho-α-AMPK (T172) antibody specifically detecting phosphorylated KIN10 T175. Densitometric analysis mirrors the quantification of KIN10 T-loop phosphorylation. B) Mapping of KIN10 phosphorylation sites by LC-MS/MS. Schematic representation of robustly identified phosphorylation sites. Table indicates the relative changes in phosphorylation, calculated for different phosphorylation sites within the KIN10 polypeptide and compared with a positive control without DUF581-9 or DUF581-9C47S. Three technical replicates were measured and used for calculation. All experiments were carried out 3 times with similar results. Asterisks (*P < 0.05, ***P < 0.001, ****P < 0.0001) mark significant differences according to 1-way ANOVA analysis followed by Tukey’s multiple comparison test.
Thus, it is tempting to speculate that binding of DUF581-9 to KIN10 prevents the initial T-loop phosphorylation by GRIK2, which subsequently limits KIN10 activity and restricts auto-phosphorylation as well as downstream substrate phosphorylation.
DUF581-9 binds to the KIN10 CD to weaken GRIK/KIN10 interaction
The above data suggest that DUF581-9 binds to KIN10 to somehow shield the T-loop from being phosphorylated by GRIK. This mechanism would require DUF581-9 to interact with KIN10 close to or at the region of either GRIK binding or phosphorylation, i.e. close to the T-loop. A direct Y2H assay demonstrates that the mere 290-amino acid N-terminal CD of KIN10 is necessary and sufficient for DUF581-9 binding, while no interaction with the C-terminal regulatory domain could be detected (Supplemental Fig. S6A). We also tested whether DUF581-9 could directly interact with GRIK2 in yeast; however, no binding between these 2 proteins could be observed (Supplemental Fig. S6B). It has previously been shown that GRIK2 forms a stable complex with the CD of KIN10 in vitro (Shen et al. 2009). Because GRIK2 and DUF581-9 interact with the same region of KIN10, they may compete with each other for binding to KIN10. To test this hypothesis, we developed a bimolecular fluorescence complementation (BiFC)–based assay to examine the KIN10–GRIK2 dissociation by DUF581-9 in vivo. We coinfiltrated Agrobacterium strains carrying either a construct expressing KIN10-VenusN173 or GRIK2-VenusC155. Furthermore, a third construct expressing either DUF581-9 mCherry or a KINβ2 mCherry fusion protein, serving as a control, was coinfiltrated into leaves of Nicotiana benthamiana. Microscopic imaging and quantification of the fluorescence signal as a proxy for binding efficiency revealed that KIN10-VenusN173 and GRIK2-VenusC155 yielded readily detectable fluorescence (Fig. 6, A and B), indicative for protein–protein interaction. The BiFC signal was significantly reduced in cells that additionally expressed DUF581-9 mCherry, suggesting a reduced interaction between KIN10 and GRIK2 (Fig. 6, A and B). Coexpression of DUF581-9C47S mCherry did not affect the strength of the fluorescence signal, indicating that the mutation abolishes the ability of DUF581-9 to interfere with the KIN10/GRIK2 interaction (Fig. 6, A and B). In a similar vein, coexpression of the KINβ2 mCherry control protein did not reduce BiFC fluorescence (Fig. 6, A and B), although a BiFC experiment confirmed the interaction between KIN10 and KINβ2 (Fig. 6A right panel). In turn, DUF581-9 mCherry coexpression did not affect the BiFC of KIN10-VenusN173 in combination with KINβ2-VenusC155 (Fig. 6, A and B), indicating that DUF581-9 specifically disrupts the interaction of KIN10 with GRIK2 but not of KIN10 with other subunits of the SnRK1 holocomplex. Expression of all fusion proteins under investigation was verified by immunoblotting (Fig. 7). Leaf samples used for protein expression verification were also probed using the anti-phospho-α-AMPK (T172) antibody to assess T-loop phosphorylation of KIN10 in the presence of DUF581-9 in planta. The results indicate that KIN10 T-loop phosphorylation was substantially reduced in the presence of DUF581-9, especially when no additional GRIK2 was overexpressed, while coexpression of DUF581-9C47S led to a much weaker reduction in KIN10 T-loop phosphorylation (Fig. 7).
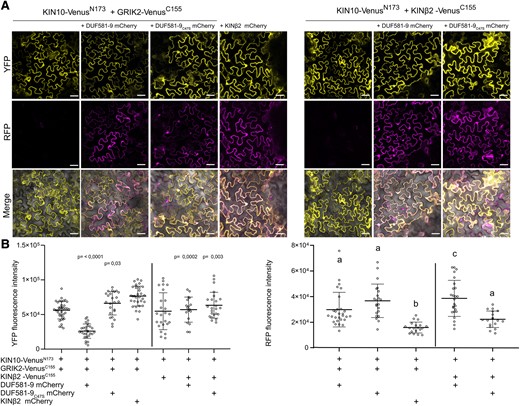
DUF581-9 weakens the interaction between KIN10 and GRIK2 in vivo. A) DUF581-9 mCherry disrupts the BiFC signal generated from the association of KIN10 VenusN173 and GRIK2-VenusC155 in planta. Proteins were transiently expressed in leaves of N. benthamiana using Agrobacterium infiltration. Yellow fluorescent protein (YFP) and red fluorescence (mCherry) was monitored by confocal microscopy 48 h post-infiltration. Upper panel shows the reconstituted YFP fluorescence in the absence or presence of a third partner. Middle panel shows mCherry fluorescence of DUF581-9 mCherry, DUF581-9C47S mCherry, or KINß2 mCherry. Lower panel shows the merge of YFP and mCherry fluorescence. The homomerization of KIN10-VenusN173 and KINß2-VenusC155 was used as control and is not negatively affected by DUF581-9 mCherry. The scale bar represents 20 µm. B) The fluorescence signal intensities of YFP and mCherry (effector) were determined along a line drawn on the confocal images using ImageJ software. Box plots represent the mean ± Sd of n = 18 to 38 individual cells for YFP fluorescence intensity and n = 17 to 28 cells for RFP fluorescence intensity (indicated as single dots). Statistically significant differences are shown as P-value between the samples against KIN10 VenusN173 and GRIK2-VenusC155 or against KIN10 VenusN173 and KINß2-VenusC155 control as determined by 1-way ANOVA followed by Dunnett’s multiple comparisons test. Regarding the RFP fluorescence signal, box plots represent the mean ± Sd, and letters above the bars represent a statistical significance determined by 1-way ANOVA (P < 0.05). The experiment was carried out twice with similar results.
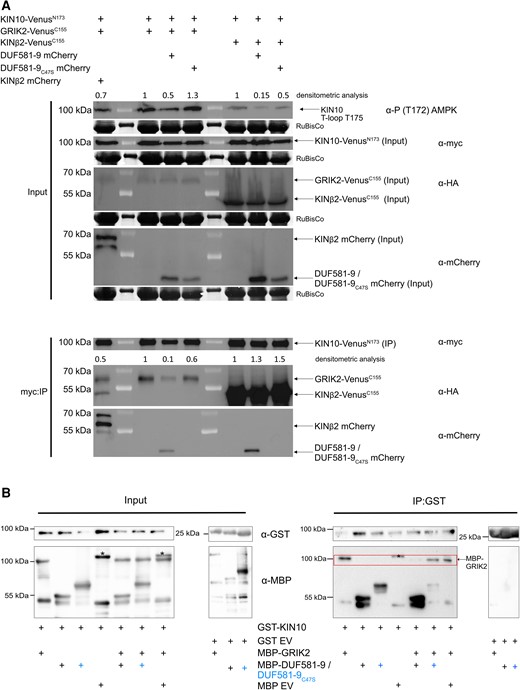
DUF581-9 interferes with KIN10/GRIK2 interaction in vivo and in vitro leading to diminished KIN10 T175 T-loop phosphorylation in vivo. A) Validation of KIN10 and GRIK2 interaction after KIN10 myc:IP (immunoprecipitation). Furthermore, KIN10 T-loop phosphorylation is weakened by DUF581-9 but not by KIN10-binding inefficient DUF581-9C47S protein. Proteins were transiently expressed in leaves of N. benthamiana using Agrobacterium infiltration. Samples were harvested 48 h post infiltration. Crude extract mirrors input signal of KIN10 (anti-myc), GRIK2 or KINß2 (anti-HA), and DUF581-9/DUF581-9C47S (anti-mCherry) protein. For KIN10 T-loop phosphorylation, immunoblot analysis was performed with anti-P T172 AMPK antibody. Densitometric analysis of anti-P T172 AMPK signal confirms the weaker KIN10 T-loop phosphorylation only in the presence of DUF581-9 protein. Pulldown of KIN10 protein was performed by anti-myc affinity matrix followed by immunoblot analysis using anti-myc, anti-HA, or anti-mCherry antibodies. Densitometric analysis of KIN10 VenusN173 and GRIK2-VenusC155 association confirms the weaker protein interaction of KIN10 and GRIK2 in the presence of DUF581-9. The homomerization of KIN10-VenusN173 and KINß2-VenusC155 was used as control and is not affected by DUF581-9 mCherry and DUF581-9C47S mCherry. B) Proteins were mixed as indicated, and KIN10-GST (full length) was pulled down from the mixture. Recombinant proteins were detected before (Input) and after (IP:GST) by immunoblotting using anti-MBP or anti-GST antibodies. Red box highlights GRIK2 MBP protein abundance after KIN10 IP:GST. The experiment was carried out at least twice with similar results. Asterisks indicate an unspecific protein band present in MBP empty vector control.
Coimmunoprecipitation of transiently expressed protein combinations using anti-myc antibodies further demonstrated that KIN10 binds substantially less GRIK2 in the presence of DUF581-9 when compared with a combination with DUF581-9C47S, while the binding of the KINβ2 subunit to KIN10 remained unaffected by DUF581-9 (Fig. 7A).
These results indicate that DUF581-9 specifically reduces the interaction between KIN10 and GRIK2 in planta eventually leading to a reduced T-loop phosphorylation of KIN10.
To exclude the possibility that additional plant proteins participate in the effect of DUF581-9 on the KIN10/GRIK2 interaction, an in vitro pull-down competition assay using recombinant proteins was conducted. The data showed that GST-KIN10 was able to pull-down either MBP-GRIK2 or MBP-DUF581-9 when each protein was added alone (Fig. 7B). The addition of free MBP as a third protein did not affect the ability of GST-KIN10 to pull-down MBP-GRIK2. However, the interaction was substantially weakened when MBP-DUF581-9 was present as a third protein (Fig. 7B). Although the MBP-DUF581-9C47S variant was still able to bind KIN10 in vitro, it had no obvious effect on the ability of GST-KIN10 to pull-down MBP-GRIK2 (Fig. 7B).
Taken together, the data suggest that DUF581-9 prevents KIN10 activation by interfering with GRIK binding and eventually blocks phosphorylation of the critical T-loop.
DUF581-9 undergoes proteasomal degradation under SnRK1 activating conditions
The question arises how KIN10 complexed with DUF581-9 can be activated when SnRK1 signaling is required. One possible mechanism could include removal of KIN10-bound DUF581-9 by proteolysis. Therefore, we monitored DUF581-9 protein stability in CaMV35S-driven overexpression lines under energy limiting conditions. A DUF581-9 myc protein signal is readily detectable in samples taken from illuminated plants, while the same signal vanished when the plants were subjected to dark-induced starvation for 6 h (Fig. 8). However, when the proteasome inhibitor bortezomib was infiltrated before the initiation of starvation, DUF581-9 protein degradation was greatly diminished. Analysis by RT-qPCR of DUF581-9 expression excluded an effect of the treatment on mRNA levels (Supplemental Fig. S7), indicating destabilization and degradation of the protein under energy limiting conditions by the proteasome.
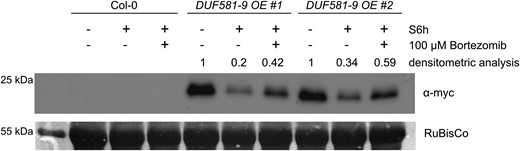
Ectopically expressed DUF581-9 is degraded under dark-induced starvation. Four-week-old Col 0 and DUF581-9 OE plants were subjected to 6 h darkness (S6h), whereas control plants were sampled during the light phase. Myc affinity trap was added to plant crude extract to enrich myc-tagged DUF581-9 protein followed by immunoblot analysis using an anti-myc antibody. Densitometric analysis reflects changes in protein levels between light-treated and dark-treated plants. The experiment was repeated 3 times with similar results.
Discussion
SnRK1 protein kinases are central regulators of energy and stress signaling in plants integrating a multitude of environmental stimuli into a range of metabolic and developmental responses (Crepin and Rolland 2019). SnRK1 activity is under complex regulation involving posttranslational modifications, metabolites, protein–protein interactions, and complex localization (Crozet et al. 2014; Broeckx et al. 2016). However, how SnRK1 controls and coordinates this diversity of processes in time and space to ensure a proper signaling response in a context specific manner is largely unknown.
In this study, we provide evidence that the DUF581-9 protein acts as a negative regulator of SnRK1 activity, which is in line with a recent hypothesis that SnRK1 is activated by default but its activity is repressed under conditions when signaling is not required (Crepin and Rolland 2019; Ramon et al. 2019). Consistent with a role as negative regulator of SnRK1 activity, DUF581-9 expression is reduced during dark-induced starvation but induced during the recovery phase, likely to rapidly shut down starvation signaling when conditions ameliorate. This is in line with the previous observation that DUF581-9 expression is reduced upon sugar starvation (Jamsheer and Laxmi 2015).
Evidence for a role of DUF581-9 as negative regulator of SnRK1 signaling in vivo was obtained through the analysis of transgenic Arabidopsis lines with altered DUF581-9 expression. Constitutive overexpression of DUF581-9 decreased the expression of SnRK1 marker genes during short-term dark-induced starvation and also reduced plant survival after long-term starvation treatment. Dark treatment leads to a rapid decline in cellular energy levels resulting in the induction of alternative pathways to generate ATP from noncarbohydrate resources such as proteins, fatty acids, or chlorophyll catabolism (Usadel et al. 2008; Araujo et al. 2011; Zhu et al. 2022). This response is at least partially dependent on SnRK1-mediated transcriptional regulation (Baena-González et al. 2007; Pedrotti et al. 2018). Arabidopsis plants overexpressing DUF581-9 show distinct metabolic changes relative to wild type especially during the light period. Although the metabolic profile of DUF581-9 OE lines under starvation is still distinct from wild-type plants, the differences are less pronounced than during illumination. At first glance, this appears surprising given the assumption that DUF581-9 has a negative effect on SnRK1 activity. While there is still a possibility that the metabolic changes observed upon DUF581-9 overexpression are independent of a direct effect on SnRK1, recent literature and also data from the present study might provide possible explanations for these observations. A number of recent studies suggest that SnRK1 plays an important role also under benign conditions (Ramon et al. 2019; Peixoto et al. 2021). By using a reporter polypeptide phosphorylation assay, it was shown that in vivo SnRK1 activity rose toward the end of the night but remained high 12 h into the light period, irrespective of a rise in sugar levels during illumination (Avidan et al. 2023). The authors concluded that SnRK1 activity during the light period is required to maintain diel metabolic homeostasis (Avidan et al. 2023), which would be in line with the observation that DUF581-9 overexpression plants are impaired in their metabolic adjustment during benign illumination. Our own data suggest that ectopically expressed DUF581-9 is degraded upon dark-induced starvation and thus releasing its inhibitory effect on SnRK1 activity. This might explain why DUF581-9 overexpression lines are generally capable of inducing a starvation response during dark treatment and become more similar to wild-type plants in terms of their metabolite profile. However, it is currently unknown whether the kinetics of the starvation response might be affected by the overexpression of DUF581-9 or whether residual levels of the protein still affect metabolic adjustment in these plants that reduces the survival rate during long-term starvation and recovery.
DUF581-9 was able to pull-down the entire SnRK1 complex from plant extracts, including the catalytic α subunit, the β subunits as well as the β/γ subunit. Other DUF581 isoforms have been shown to also interact with regulatory SnRK1 subunits in yeast (Carianopol et al. 2020). However, for DUF581-9, a direct interaction could only be observed with the catalytic subunit. This suggests that DUF581-9 functions through direct binding to the readily assembled SnRK1 complex by a direct interaction with the catalytic α subunit. In line with a compromised SnRK1 response in DUF581-9 overexpression lines, the coexpression of KIN10 with DUF581-9 in protoplasts reduces the activation of a SnRK1-responsive reporter gene.
Thus, the data obtained so far suggest that DUF581-9 negatively regulates SnRK1 signaling through a direct interaction with the catalytic subunit of the kinase holocomplex.
The addition of DUF581-9 also inhibited KIN10 kinase activity in an in vitro reconstituted GRIK2/KIN10/SAMS cascade utilizing E. coli-produced recombinant proteins. This effect was dependent on an intact DUF581 domain, as the DUF581-9C47S variant did not inhibit phosphorylation activity in vitro to the same extent as the wild-type protein. Although a strong negative correlation between the concentration of DUF581-9 in the assay mix and the SAMS phosphorylation signal was observed, the increasing concentrations of SAMS had no effect on the concentration of DUF581-9 phosphorylation. This suggests that KIN10 inhibition by DUF581-9 is not a result of both proteins competing for binding at the same site. Furthermore, DUF581-9 was not able to inhibit the activity of preactivated KIN10, indicating it is not able to revert activation once it has occurred. These observations can be explained by a scenario in which DUF581-9 stoichiometrically binds to KIN10 to prevent its activation by steric or structural hindrance rather than through an inherent enzymatic activity.
The proposed sequences of events leading to KIN10 activation in the in vitro assay are as follows: (i) T153 auto-phosphorylation/activation of GRIK2; (ii) T175 KIN10 phosphorylation/activation by auto-activated GRIK2; and (iii) reciprocal S260 GRIK2 phosphorylation/inhibition by activated KIN10 (Crozet et al. 2010). An effect of DUF581-9 on the activity of the upstream activating kinase GRIK2 can largely be excluded since the GRIK2 auto-phosphorylation at T153, as a proxy for its activity, was not affected in the presence of DUF581-9. However, addition of DUF581-9 substantially reduced the KIN10 phosphorylation signal in phospho-stainings, corresponding with a reduction in T-loop phosphorylation as revealed by immunoblotting using phosphorylation site-specific antibodies as well as by a quantitative assessment of KIN10 T-loop phosphorylation using LC-MS/MS. The presence of DUF581-9 also affected the phosphorylation level of additional sites within the KIN10 polypeptide. Phosphorylation of residues other than T175 is likely the result of KIN10 auto-phosphorylation as the catalytically inactive KIN10K48R variant still shows detectable T175 phosphorylation, while additional sites remain unphosphorylated. The presence of DUF581-9 also reduces KIN10-mediated GRIK2 S260 transphosphorylation (Crozet et al. 2010), further supporting an inhibitory effect of the protein on kinase activity. Whether the auto-phosphorylation sites detected in vitro correspond to the KIN10 auto-phosphorylation pattern in planta (Baena-González et al. 2007), and whether this is required for full kinase activity is currently unknown.
Taken together, the data strongly suggest that DUF581-9 inhibits KIN10 activity by interference with GRIK2-mediated phosphorylation/activation, independent of affecting GRIK2 activity in general.
As prerequisite for T-loop phosphorylation, GRIKs tightly interact with the SnRK1 catalytic α subunits (Shen et al. 2009). We show here that DUF581-9 weakens the interaction between GRIK2 and KIN10 in vivo and in vitro, likely with repercussions on T-loop phosphorylation efficiency. The sugar-signaling molecule T6P has been reported to inhibit SnRK1 activity in different plants (Zhang et al. 2009; Debast et al. 2011), and recent evidence suggests that similar to DUF581-9, T6P directly binds to the CD of KIN10 to weaken the interaction with upstream GRIK and thereby reducing the KIN10 T-loop phosphorylation (Zhai et al. 2018). The mechanism through which T6P weakens the interaction between KIN10 and GRIK is currently unclear. For DUF581-9, it is possible that it competes with GRIK for the same binding site on the KIN10 surface and thereby reducing the accessibility of the T-loop for GRIK phosphorylation. Alternatively, DUF581-9 binding could induce structural changes in KIN10 that weaken GRIK binding.
Given the multitude of SnRK1 regulatory mechanisms that have already been described (Broeckx et al. 2016; Crepin and Rolland 2019), the question remains what the biological importance of the regulation of SnRK1 signaling by DUF581-9 could be? Although DUF581-9 expression was readily detectable in mature leaves by RT-qPCR, the DUF581-9 promoter GUS analyses suggest that expression mainly overlaps with the shoot apical meristem and with mitotic regions of developing leaves (Kazama et al. 2010), as well as in certain parts of the flower. This might also explain why duf581-9 mutants display indeed enhanced expression of the SnRK1 marker gene DIN6 during early starvation but behave like wild-type control plants with respect to metabolite changes and survival of long-term starvation. While examining the effects of DUF581-9 on SnRK1 regulation, valuable insights were gained by studying transgenic lines that strongly and constitutively overexpressed DUF581-9 throughout the plant, focusing on rosettes. However, it is important to note that the use of the CaMV 35S promoter for artificial expression may limit our ability to accurately deduce the protein's true biological function. The natural expression pattern of DUF581-9 largely resembles that of GRIK1 and GRIK2 for which RNA was detectable at comparable levels in all tissues investigated, but the protein was only found in the shoot apical meristem and very young leaves (Shen and Hanley-Bowdoin 2006). It has been suggested that at least in proliferating young tissues, the upstream kinases are required for initial phosphorylation and activation of newly synthesized SnRK1 (Shen et al. 2009). A knock-out of both GRIK isoforms in Arabidopsis severely affected plant growth and development, and double mutant plants did not grow without sugar supplementation (Glab et al. 2017). The double mutant contained wild-type levels of KIN10, but the protein exhibited no or highly reduced T-loop T175 phosphorylation with a concomitant reduction in catalytic activity (Glab et al. 2017). This suggests that SnRK1 activation through GRIK phosphorylation is essential for SnRK1 function and also for overall plant growth and development. Young proliferating tissues are likely to have a high energy demand and carbohydrate supply in the form of sucrose, and its metabolites have been shown to be a major regulator of cell cycle progression (Riou-Khamlichi et al. 2000). In addition to SnRK1 regulation through mechanisms such as regulatory β subunit myristoylation and nuclear exclusion of the preactivated complex (Ramon et al. 2019), these cells might require an additional layer of SnRK1 regulation that safe-guards its unintentional activation under conditions prioritizing cell division and growth. Binding of DUF581-9 to the SnRK1α subunit would prevent the phosphorylation and thus preactivation of newly synthesized KIN protein. Upon starvation conditions, DUF581-9 is rapidly turned over by the proteasome exposing the T-loop for phosphorylation by the constitutively active GRIK upstream kinases and thus allowing for rapid SnRK1 activation without the need of de novo KIN protein synthesis or complex assembly.
Future studies will have to clarify whether other members of the DUF581/FLZ protein family have similar functions in the regulation of SnRK1 activity and what role the additional interaction partners of these regulatory proteins play within the SnRK1 signaling network (Nietzsche et al. 2016).
Materials and methods
Plant material
Arabidopsis (A. thaliana) plants were grown on soil in an 8 h light/16 h dark cycle (22 °C/18 °C), 70 μmol m−2 s−1 light intensity, and 70% humidity (=SD) or in a 16 h light/8 h dark cycle (22 °C/18 °C), 70 μmol m−2 s−1 light intensity, and 70% humidity (=LD). Transgenic plants were generated in the Col-0 ecotype. T-DNA insertion line duf581-9 ko (SALK_062585) was obtained from Nottingham Arabidopsis Stock Centre. Transgenic overexpression lines DUF581-9 OE #1 and #2 were generated following the Agrobacterium tumefaciens (strain GV3101)–based transformation via the floral dip method (Clough and Bent 1998), and independent transformants were selected by kanamycin selection. N. benthamiana plants were grown in soil in a growth chamber and subjected to a 16 h light/8 h dark cycle (25 °C/20 °C) at 240 to 300 µmol m−2 s−1 light and 70% relative humidity.
Plasmid construction
Full-length coding regions of DUF581-9/FLZ3 (At2g44670) and of the DUF581-9C47S variant (Nietzsche et al. 2014) were cloned into pENTR-D/TOPO (Thermo Fisher). For stable overexpression lines, the vector pRB-35S-3xmyc (Bartetzko et al. 2009) was used. For transient expression in N. benthamiana, the DUF581-9, DUF581-9C47S, or KINβ2 sequence was inserted into pRB-35S-mCherry. Constructs for bi-molecular fluorescence complementation analysis are based on Gateway-cloning (GW) compatible versions of pRB-C-VenusN173 and pRB-C-VenusC155 (Üstün and Börnke 2015). To create the ProDUF581-9::GUS construct, a 1828 bp fragment upstream of the At2g44670 gene and spanning the intergenic region to the next annotated gene were amplified and inserted into the GW compatible vector pBGWFS7.0 (Karimi et al. 2002). For recombinant protein expression, we used GW versions of pMAL-C2 (New England Biolabs) and pDEST-17 (Thermo Fisher) with N-terminal MBP or GST tag, respectively. For yeast 2-hybrid (Y2H) analyses, fragments were recombined into GW versions of the GAL4 DNA-binding domain vector pGBT-9 and the activation domain vector pGAD424 (Clontech). Oligonucleotides used for cloning are listed in Supplemental Table S3.
Starvation and survival assays
Short-term starvation experiments were conducted with 4-wk-old plants, grown under SD conditions as stated above. Thirty minutes into the photoperiod, lights were switched off for 6 h before samples were taken. To analyze the survival rate after long-term starvation, 3-wk-old Arabidopsis plants grown under SD conditions were subjected to a dark-treatment for 10 d. Recovery performance was quantified 7 d after resuming normal light and growth conditions. Plants with a clearly visible intact green apex were considered survivors.
Analysis of GUS reporter lines
Different developmental stages of several independent transgenic ProDUF581-9::GUS lines were investigated for tissue-specific localization patterns using histochemical staining according to Jefferson et al. (1987).
RNA extraction and RT-qPCR
RNA was extracted from ground leaf tissue using NucleoZOL (Machery-Nagel) reagent. First strand cDNA synthesis and RT-qPCR were conducted as described (Nietzsche et al. 2018). Oligonucleotides used for RT-qPCR are listed in Supplemental Table S3.
Immuno-affinity purification
Two grams of frozen Arabidopsis leaf material were ground in liquid nitrogen and thawed in 4 mL extraction buffer (100 mm Tris-HCl, pH 8.0; 100 mm NaCl; 5 mm EDTA; 5 mm EGTA; 20 mm DTT; 10 mm NaF; 10 mm Na3VO4; 1:200 plant protease inhibitor cocktail [Sigma P9599]; and 0.5% [v/v] Triton X-100). After centrifugation, the supernatant was incubated with 40 μL of magnetic Myc-Trap (50% [v/v] slurry, Chromotek) and incubated for 60 min at 4 °C. After 5 washing steps (100 mm Tris-HCl, pH 8.0; 100 mm NaCl; 0.5 mm EDTA; and 1 mm DTT), the purified myc-tagged DUF581-9 protein was either used for immunoblot or for LC-MS/MS analysis.
Immunoblotting
Protein extracts were boiled with 5 × SDS sample buffer and separated by SDS-page. Immunoblotting was carried out with anti-myc antibody (1:2.500, Abcam), followed by Goat Anti-Rabbit IgA alpha chain (HRP; 1:5.000) secondary antibody (Abcam). HA-tagged proteins were detected by anti-HA peroxidase high-affinity antibody (Sigma). KIN10 was detected by an anti-KIN10 (1:500) antibody (Agrisera). To detect KIN10 T-loop phosphorylation, a phospho-AMPK alpha-1 (Thr172) polyclonal antibody (Cell Signalling Technology) was used (1:500). Signals were visualized using chemiluminescence (Thermo Fisher Scientific) with a ChemiDoc Imaging system (Biorad).
Purification of recombinant proteins
Recombinant proteins were expressed either in E. coli M15 (MBP fusions) or E. coli BL21 (GST fusions) cells. Bacteria were lysed by sonication. After centrifugation, the MBP fusion proteins were purified using amylose resin (New England Biolabs) and GST fusions by glutathione resin (GE Healthcare), each according to the manufacturer's instructions.
Pull-down assays
Purified KIN10-GST recombinant protein was incubated with crude extract of MBP EV, MBP-GRIK2, MBP-DUF581-9, or the DUF581-9C47S variant in pull-down buffer (20 mm Tris-HCl, pH 8; 100 mm NaCl; and 1 mm EDTA) at 4 °C for 1 h. Subsequently, the glutathione resin was washed 5 times with pull-down buffer. The proteins were eluted from beads by boiling in 80 μL 2 × SDS sample buffer and separated on 12% (w/v) SDS-PAGE gels. Gel blots were analyzed using anti-MBP (NEB, 1:10.000) and anti-GST antibodies (Santa Cruz Biotechnology, 1:1.000).
In vitro SnRK1 kinase assay
In vitro kinase assay was performed with purified MBP-tagged AtKIN10, AtKIN10K48R, AtGRIK2, AtDUF581-9, and AtDUF581-9C47S proteins as well as MBP-SAMS peptide expressed in E. coli. The reactions were started by adding kinase buffer (50 mm Tris HCl, pH 7.5; 10 mm MgCl2; 0.1 mm EGTA; 1 mm DTT; and 0.1 mm ATP), subsequently incubated for 30 min at 30 °C and stopped by adding SDS sample buffer or directly frozen in N2 for further LC-MS/MS analysis. Alternatively, the assay was carried out in the presence of 2 µCi 32P γ-ATP, and the incorporation of radiolabel into the SAMS peptide was carried out as described previously (Debast et al. 2011).
ProQ Diamond stain of phosphorylated proteins
Twenty microliters of each kinase assay reaction mix was applied to SDS PAGE. To expose phosphorylated proteins, the Pro-Q Diamond Phosphoprotein Gel Stain (Thermo Fisher Scientific) was used according to the manufacturer's specifications. Fluorescence-labeled phospho-proteins were detected with an Octoplus QPLEX Fluorescence Imager (NH DyeAGNOSTICS GmbH, Halle, Germany) with the excitation and emission wavelengths set at 555 and 580 nm, respectively. Afterwards, gels were stained with InstantBlue Protein Stain (Expedeon Ltd, Cambridge, UK) to confirm comparable protein amounts.
Protoplast isolation and transformation
Protoplast transfection assays were performed according to Yoo et al. (2007) with modifications as described in Ehlert et al. (2006). GUS enzyme assays were performed after 16 h of incubation in light (110 µmols−1m−2). Reporter and effector plasmids have previously been described (Pedrotti et al. 2018; Henninger et al. 2022).
MS and data analysis
Bead-bound DUF581-9 myc was supplemented with 0.1% (w/v) RapiGest SF (Waters, Eschborn, Germany), whereas in vitro kinase assay mixture was directly reduced and digested following the method of Kaspar et al. (2010). Subsequently, desalting of peptides was carried out according to Witzel et al. (2019). Protein digests were analyzed using the Thermo Fisher Q Exactive high-field MS by reverse-phase HPLC-ESI-MS/MS using the Dionex UltiMate 3000 RSLC nano System coupled to the Q Exactive High Field (HF) Hybrid Quadrupole Orbitrap MS (Thermo Fisher Scientific) and a Nano electrospray Flex ion source (Thermo Fisher Scientific) as described previously by Witzel et al. (2019). Each sample was measured in triplicate. Proteome discoverer software (PD2.4) was used to analyze and align the LC-MS raw data files, with its built-in MS Amanda, MS Mascot, and Sequest HT search engine (Thermo Scientific) (Witzel et al. 2019). The MS/MS spectra were searched against Swissprot database for A. thaliana (UP000006548) and common contaminants for protein identification. Analysis parameters were set as described by Witzel et al. (2019). The result lists were filtered for high confident peptides, and their signals were mapped across all LC-MS experiments (Col-0, DUF581-9 #1, DUF581-9 #2 lines) and normalized to the total peptide amount per same LC-MS/MS experiment. Only unique peptides were selected for quantification, and abundances of all peptides allocated to a specific protein were summed and compared.
Metabolite analysis
Four-week-old Arabidopsis plants grown under SD conditions were treated as described above. Rosettes of 6 biological replicates were used for metabolite profiling and performed exactly as described by Lisec et al. (2011). Metabolite identities were verified via comparison with spectral libraries of authentic standards housed in the Golm Metabolome Database (Kopka et al. 2005).
Y2H analyses
Direct protein–protein interaction was tested by Y2H technique according to the yeast protocols handbook and the Matchmaker GAL4 Two-hybrid System 3 manual (both Clontech, Heidelberg, Germany). Yeast strain Y190 was cotransformed with respective plasmids, followed by the selection of transformants on medium lacking Leu and Trp at 30 °C for 3 d and the subsequent transfer to medium lacking Leu, Trp, and His (supplemented with 25 mm 3-amino-triazole) for growth selection. Cells growing on selective medium were further tested for activity of the lacZ reporter gene using filter lift assays.
BiFC analysis
To investigate in planta protein–protein interaction between KIN10-VenusN173 and GRIK2-VenusC155 in the absence/presence of DUF581-9 mCherry, constructs were transformed into A. tumefaciens GV3101 and transiently expressed by Agrobacterium infiltration in N. benthamiana. KIN10-VenusN173 and KINβ2-VenusC155 (At1g43670) served as positive control, whereas KINβ2 mCherry and DUF581-9C47S mCherry were coinfiltrated as negative control. The BiFC-induced YFP and mcherry fluorescence were detected by CLSM (LSM880, Axio Observer; Zeiss) after 48 h post infiltration. The specimens were examined using the LD LCI Plan-Apochromat 25×/0.8 water-immersion Imm Korr DIC M27 objective for detailed images with excitation using the argon laser. YFP and mCherry were excited with 514 or 561 nm, respectively, and an emission range between 517 and 553 nm for YFP or 597 and 642 nm for mCherry was used for detection. Gain was set to 850, and laser intensity settings were adjusted individually to have comparable baseline intensity values for each experiment. Pinhole was set between 0.9 and 1.5 airy units. Imaging conditions were kept identical for all samples pertaining to the same experiment. Fluorescence was quantified by ImageJ (Fiji).
Statistical analysis and data presentation
Depending on the experiment, statistical significances were based on either Student's t-test or 1-way ANOVA followed by Tukey's, Dunnett’s, or Sidak’s multiple comparisons test. ANOVA and Student's t-test tables are provided in the Supplemental Table S4. Each experiment was repeated at least twice unless otherwise stated. The number of biological replicates (individual plants, n) is stated in the figure legends.
Accession numbers
Sequence data for genes relevant to this article can be found in the Arabidopsis Genome Initiative under the following accession numbers: AtFLZ3 (At2g44670); AtKIN10 (At301090); AtKIN11 (At3g29160); AtGRIK2 (At5g60550); AtKINß1 (At5g21170); AtKINß2 (At4g16360); AtKINß3 (At2g28060), AtKINßγ (At1g09020); AtDIN6 (At3g47340); AtTPS8 (At1g70290); AtUBC9 (At4g27960); and AtPPDK (At4g15530).
Acknowledgments
We thank Kerstin Bieler and Mandy Heinze for their skillful technical help.
Author contributions
J.B. and F.B. conceived the study. J.B., J.L., S.A. and C.W. performed the experiments. J.B., J.L., S.A., C.W., A.R.F., W.D.-L. and F.B. analyzed the data. J.B. generated the figures. J.B. and F.B. wrote the paper with input from all authors.
Supplemental data
The following materials are available in the online version of this article.
Supplemental Figure S1. Tissue and developmental stage-specific expression pattern of DUF581-9 as revealed by the analysis of ProDUF581-9::GUS Arabidopsis plants.
Supplemental Figure S2. Characterization of Arabidopsis plants with modulated DUF581-9 expression.
Supplemental Figure S3. Overexpression of DUF581-9 reduces plant survival after long-term dark treatment.
Supplemental Figure S4. DUF581-9 interacts with KIN10 catalytic subunit in vivo and in vitro but not with SnRK1 regulatory subunits.
Supplemental Figure S5. Increasing amounts of SAMS do not affect DUF581-9 phosphorylation.
Supplemental Figure S6. DUF581-9 interacts with the KIN10 CD but not with GRIK2.
Supplemental Figure S7. Starvation treatment does not affect DUF581-9 transcript levels in 35S::DUF581-9 OE lines.
Supplemental Table S1. Metabolite levels.
Supplemental Table S2. GRIK2 phosphorylation in the presence or absence of DUF581-9.
Supplemental Table S3. Oligonucleotides used in this study.
Supplemental Table S4. ANOVA and Student's t-test tables.
Funding
S.A. and A.R.F. acknowledge funding of the PlantaSYST project by the European Union’s Horizon 2020 Framework Program (SGA-CSA no. 664621 and no. 739582 under FPA no. 664620).
Data availability
The data that support the findings of this study are available from the corresponding author upon request.
Dive Curated Terms
The following phenotypic, genotypic, and functional terms are of significance to the work described in this paper:
References
Author notes
The author responsible for distribution of materials integral to the findings presented in this article in accordance with the policy described in the Instructions for Authors (https://dbpia.nl.go.kr/plphys/pages/General-Instructions) is: Jennifer Bortlik ([email protected]).
Conflict of interest statement. None declared.
