


Abstract
Grain yield and grain quality are major determinants in modern breeding controlled by many quantitative traits loci (QTLs) in rice (Oryza sativa). However, the mechanisms underlying grain shape and quality are poorly understood. Here, we characterize a QTL for grain size and grain quality via map-based cloning from wild rice (W1943), GS10 (Grain Size on Chromosome 10), which encodes a protein with 6 tandem armadillo repeats. The null mutant gs10 shows slender and narrow grains with altered cell size, which has a pleiotropic effect on other agronomical traits. Functional analysis reveals that GS10 interacts with TUD1 (Taihu Dwarf1) and is epistatic to OsGSK2 (glycogen synthase kinase 2) through regulating grain shape and lamina joint inclination, indicating it is negatively involved in brassinosteroid (BR) signaling. Pyramiding gs10 and the grain size gene GW5 into cultivar GLA4 substantially improved grain shape and appearance quality. Natural variation analysis revealed that gs10 from the wild rice Oryza rufipogon W1943 is a rare allele across the rice population. Collectively, these findings advance our understanding of the underlying mechanism of grain shape and provide the beneficial allele of gs10 for future rice breeding and genetic improvement.
Introduction
Rice is one of the major cereal food crops in the world. Rice grain yield has been involved in many important agronomical traits, such as flowering time, plant height, grain size, and grain weight (Huang et al. 2016). Grain yield and grain quality are the 2 main determinants of modern rice breeding. The mechanisms underlying grain-size-related traits are mainly involved in the ubiquitin-proteasome pathway, G-protein signaling, mitogen-activated protein kinase signaling, phytohormone perception, and homoeostasis, and some transcriptional regulators (Li et al. 2019). More than 20 quantitative traits loci (QTLs) regarding grain size and quality have been characterized by QTL mapping and genome-wide association study (GWAS). The well-characterized G protein pathway determines grain size and grain weight in rice. Gα protein provides a foundation for grain size expansion, and Gβ is essential for plant survival and growth (Sun et al. 2018). Three Gγ proteins, DENSE AND ERECT PANICLE1 (DEP1), GGC2, and GS3, antagonistically regulate grain size. Furthermore, GS3 and DEP1 interact directly with OsMADS1 (qLGY3) to regulate grain size by enhancing OsMADS1 transcriptional activity and promoting the co-operative transactivation of common target genes (Liu et al. 2018; Yu et al. 2018). GW2 encodes an unknown RING-type protein with E3 ubiquitin ligase activity involved in the ubiquitin-proteasome pathway, which regulates grain width (GW) and weight. Loss of GW2 increases cell numbers, resulting in a larger (wider) spikelet hull and accelerating the grain milk filling rate (Song et al. 2007). Furthermore, qSW5/GW5/GSE5 encodes a calmodulin-binding protein and physically interacts with OsGSK2, which is involved in brassinosteroid (BR) signaling for regulating GW and weight (Shomura et al. 2008; Weng et al. 2008; Duan et al. 2017; Liu et al. 2017). GLW7 encoding the plant-specific transcription factor OsSPL13, identified by GWAS analysis on grain size in a diverse rice population, positively regulates cell size in the grain hull and enhances rice grain length and yield (Si et al. 2016). Although many related QTLs have been well characterized for grain size, the underlying molecular mechanisms of grain size regulation are still insufficiently addressed.
Grain quality (cooking, eating, and appearance quality) is closely associated with grain size in the hybrid rice population (Gong et al. 2017; Zhao et al. 2022). GW8 encodes OsSPL16, which acts as a positive regulator for cell proliferation, GW, and grain filling in rice. The loss-of-function mutation gw8 in the elite cultivar Basmati could cause more slender grain and better quality of appearance (Wang et al. 2012). GL7/GW7 encoding a TONNEAU1-recruiting motif protein positively regulates grain length and improves rice yield and grain quality in rice (Wang et al. 2015a, 2015b). Besides, OsSPL16 (GW8) represses GW7 expression by bounding directly to the GW7 promoter. The OsSPL16-GW7 module provides a strategy to improve rice yield and quality in future rice breeding (Wang et al. 2015a). GS9 encodes a protein with an unknown conserved functional domain and positively regulates grain shape by affecting cell division. GS9 functions independently from other previously identified grain-size genes, and applying gs9 null mutant substantially improves grain shape and appearance quality (Zhao et al. 2018a). Understanding the mechanism underlying gain size and quality can facilitate hybrid rice breeding with optimal grain shape and appearance quality.
Armadillo (ARM)-repeat proteins consist of a repeating ∼42 amino acid motif that is conserved both in animals and in plants (Coates 2003). This superfamily has more than 100 ARM members in plants and animals, mainly involved in biotic, abiotic, and hormonal signaling networks (Tewari et al. 2010). In animals, the fascinating protein β-catenin (ARM in Drosophila) interacts with microtubules, which play an essential role in Wnt/β-catenin signaling to control multiple biological phenomena during the development and adult life of all animals (Tewari et al. 2010; Clevers and Nusse 2012). Unlike animals, the plant ARM subfamily where the ARM repeat region is preceded with a different motif, including F-box, U-box, and other domains, which may function diversely, such as cold stress response, stomatal movement, immune response, and other development processes (Zeng et al. 2004; Ngo et al. 2012; Hu et al. 2013; Sakamoto et al. 2013; Vogelmann et al. 2014; Jung et al. 2015). For example, 3 Arabidopsis thaliana ARMADILLO REPEAT ONLY (ARO) proteins interact with ROP1 enhancer GAPs (RENGAPs) and binding to the plasma membrane through the ARO amino terminus, which is essential for the stabilization of growth sites in root hair cells and trichomes (Kulich et al. 2020). The spotted leaf11 (spl11) contains a U-box domain and 6 ARM repeats with E3 ubiquitin ligase activity, negatively regulating rice plant cell death and defense (Zeng et al. 2004). Ptr is reported as an atypical resistance gene with 4 ARM repeats, and targeted mutation of Ptr confers blast susceptibility in resistant cultivars (Zhao et al. 2018b). Even though ARM repeats play an essential role in many development processes, we know little about the mechanisms underlying grain shape and yield, especially in rice.
In our study, we characterized a gene, GS10, with 6 ARM repeats from wild rice. We demonstrated that GS10 positively regulates grain size (especially grain length/GW) and that the allele gs10 from wild rice could improve grain appearance quality without reducing total grain yield. Interestingly, pyramiding gs10 with major beneficial grain size and quality gene GW5 in the Oryza sativa indica cultivar GLA4 background results in increased grain length-to-width ratio and improved appearance quality, implying that loss-of-function allele gs10 has the potentiality for grain quality improvement. We demonstrate that the tradeoff between grain size and grain quality in GS10 facilitates our understanding of the mechanism of grain shape. This study also provides a new genetic framework and wild rice resources for improving rice breeding.
Results
Map-based cloning of GS10 and polymorphism analysis
We developed backcross inbred lines (BILs) between the O. sativa indica variety Guangluai 4 (GLA4) and the wild rice O. rufipogon W1943. We mapped several grain-size related QTLs using this population, including the well-characterized genes GW5/qSW5/GSE5, GL7/GW7, and GL6 (Shomura et al. 2008; Weng et al. 2008; Wang et al. 2015a, 2015b, 2019; Duan et al. 2017; Liu et al. 2017; Supplemental Fig. S1A). In terms of GW, QTL analysis revealed there is a semidominant GW and grain length to GW ratio QTL on chromosome 10 (Supplemental Fig. S1B).
To clone this gene, we chose the chromosome segment substitutional line 50 (CSSL50) as the parental line, with substitution of 5-Mb fragment from W1943 on chromosome 10 in the GLA4 background (Fig. 1A; Supplemental Fig. S2A). Compared to its recipient GLA4, the grain length of CSSL50 was not changed, while the GW, 1,000-grain weight, and grain thickness decreased by 9%, 10%, and 4%, respectively (Fig. 1, B and E–I). The locus was initially mapped between marker loci OP10-6 and OP10-7 using 155 BC2F2 plants and then fine-mapped to a 10-kilobase (kb) genomic region between marker loci SNP10-6 and SNP10-3 using the BC2F4 population (n = 5,250; Fig. 1, C and D). There was only a candidate gene within this region, LOC_Os10g37850, hereafter referred to as GS10 (Fig. 1D).
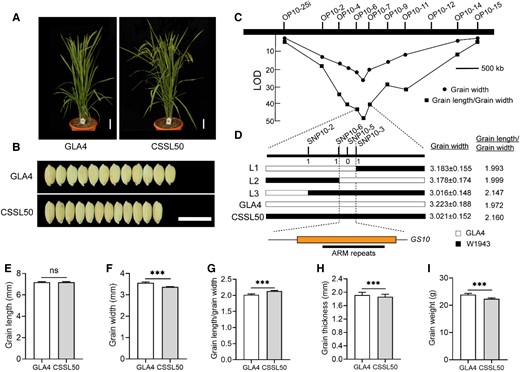
Map-based cloning of GS10. Plant morphology and grain shape phenotype between GLA4 and CSSL50. Scale bar, 5 cm (A), 1 cm (B, both panels). C)GS10 was initially mapped between marker loci OP10-6 and OP10-7 using 155 BC2F2 plants based on the phenotype of GW and grain length/GW. D)GS10 was then fine-mapped to a 10-kilobase (kb) genomic region between the marker SNP10-6 and SNP10-3 using the BC2F4 population. Genotype (left), GW (middle), and grain length/GW (right) were shown for recombinant plants and the control plants. White and black bars represent chromosomal segments homozygous for GLA4 and W1943 alleles, respectively. The only 1 predicted open reading frame in the 10-kb delimited region among 3 CSSLs and their parents. The numbers below the molecular markers in (D) indicate the number of recombinants. Statistics of grain length E), GW F), grain length/GW G), grain thickness H), and grain weight I) between GLA4 and CSSSL50, n ≥ 18. Values are given as the mean ± Sd. Student's t-test significant difference, ***P < 0.001; ns, not significant.
Based on GS10 sequence analysis (IRGSP 1.0), 4 polymorphisms were identified in the coding region between GLA4 and W1943, of which 2 SNPs lead to nonsynonymous mutation, and a 5-bp deletion can cause a frameshift and truncation of the predicted protein (Fig. 2A; Supplemental Fig. S3). These results suggested that the 5-bp deletion from wild rice may be the causative mutation for the slender and narrow grain in CSSL50.
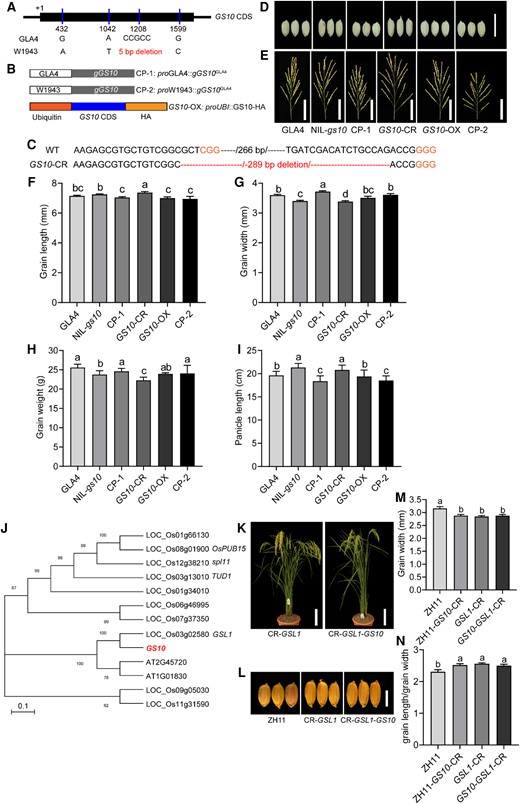
Conformation of GS10 by the transgenic test. A) Schematic representation of gene structure and allelic variation of the GS10, the numbers below the gene bar indicate the number of polymorphic nucleotide(s) located in the coding region. The nucleotides of the causative mutation are in red. CDS, coding region sequence. B) Transgenic validation of GS10. Two complementary transgenic lines, CP-1 (pGLA4::gGS10GLA4) and CP-2 (pW1943::gGS10GLA4) were constructed, expressing the GS10 gDNAGLA4 fused with a native promoter from GLA4 and W1943 based on the background of NIL-gs10; the overexpressing lines (OX, Ubi::GS10GLA4) and knock-out lines GS10-CR based on the GLA4 background. C) Schematic representation of CRISPR/Cas9-edited sequence in GS10-CR alleles. The GS10-CR mutant has a 289-bp deletion (the resulting knock-out region is in red) in the coding region. Confirmation by using the near-isogenic line. Morphology of grain shape D), panicle E) of GLA4, the near-isogenic line NIL-gs10, and different transgenic lines (CP-1, GS10-CR, GS10-OX, and CP-2) during maturation from the field. Scale bars, 1 cm (D, for all panels), 5 cm (E). Comparison of grain length F), GW G), grain weight H), and panicle length I) between different lines (GLA4, NIL-gs10, CP-1, GS10-CR, GS10-OX, and CP-2), n = 6. J) Phylogenetic analysis of putative ARM proteins in representative species. OsPUB15, spl11, and TUD1 are all characterized genes. Scale bar, 0.1. K) Plant morphology phenotype between CR-GSL1 and CR-GS10-GSL1. Scale bars, 10 cm. L) Grain shape between ZH11, CR-GSL1, and CR-GS10-GSL1. Scale bar, 5 mm (for all panels). M, N) Statistics of GW and grain length/GW between ZH11, CR-GS10, CR-GSL1, and CR-GS10-GSL1, n = 6. Values are given as the mean ± Sd. As determined by Duncan's multiple-range test, lowercase letters indicate significant differences (P < 0.05).
Confirmation of GS10 by the transgenic test
To characterize the genetic effect of the candidate gene, GS10, we first constructed a nearly isogenic line (NIL) containing a 170-kb chromosomal region from W1943 under the background of GLA4 (Supplemental Fig. S2B). In contrast to GLA4, NIL-gs10 displays a pleiotropic effect on many agronomical traits, including panicle length, secondary branches, plant height, flag leaf length, flag leaf width, and grain yield per plant. Notably, gs10 slightly decreases yield per plant but has a similar actual yield per plot to GLA4 (Supplemental Fig. S4).
To confirm whether GS10 is responsible for the change of grain size, 2 complementary transgenic lines, CP-1 (pGLA4::gGS10GLA4) and CP-2 (pW1943::gGS10GLA4), based on the background of NIL-gs10 were constructed, expressing the GS10 gDNAGLA4 fused with a native promoter from GLA4 and W1943, respectively (Fig. 2B). At least 10 individual T0 transgenic lines were obtained, and we examined their GW and grain length/GW (Supplemental Fig. S5). Then, we constructed the overexpressing lines (OX, Ubi::GS10GLA4) and knock-out lines GS10-CR (where CR indicates CRISPR-Cas9-induced) based on the GLA4 background (Fig. 2, B and C). There is no apparent difference in plant architecture except for plant height before grain filling. The plant height was increased by 7% in NIL-gs10 and GS10-CR, while that of CP-1, GS10-OX, and CP-2 was decreased due to elevated gene expression (Supplemental Fig. S6). Besides, the results showed that CP-1 and CP-2 could rescue the phenotype in grain shape (grain length and GW) with a round and shorter grain compared with the NIL-gs10 (Fig. 2, D and F–G). The GS10-OX exhibited a weaker difference in grain length and GW, but the GS10-CR showed a longer and narrower grain (Fig. 2, D and F–G). Regarding other agronomical traits, CP-1 and CP-2 decreased the panicle length and had no difference in grain weight and spikelets per panicle. The flag leaf length was longer in NIL-gs10 and GS10-CR than in GS10-OX (Supplemental Fig. S7, B and C). The panicle length and spikelets per panicle were increased in NIL-gs10 and GS10-CR, while the grain weight was decreased, suggesting GS10 had a tradeoff between grain size, panicle number, and grain weight (Fig. 2, E and H–I; Supplemental Fig. S7D).
We also construct the transgenic lines using CRISPR-Cas9 in japonica lines. The grains formed by the 2 knock-out lines from Nipponbare (Nip) and Dongjin (DJ) significantly changed plant architecture, panicle length, and grain shape compared with its wild type (Supplemental Fig. S8). Consistently, we got a transfer DNA (T-DNA) insertion line (PFG_1C-02357.L) based on the japonica background “Hwayoung” (HY), named gs10 (Supplemental Fig. S9, A and B). The T-DNA insertion site locates on the 1,480 bp upstream of the GS10 coding region, and the expression of GS10 was downregulated (Supplemental Fig. S9, C, D, and G). The complementary line HY-CP-1 showed wider and shorter grain than gs10 (Supplemental Fig. S9, E and F). Taken together, these results demonstrated that GS10 is the causative gene for the change of grain size.
Phylogenetic analysis revealed that GS10 belongs to the ARM family, and amino acid sequence analysis showed that LOC_Os03g02580 (GS10-LIKE-PROTEIN 1, GSL1) shared high sequence similarity with GS10 (Fig. 2J; Supplemental Fig. 10A). To further investigate the genetic relationship between GS10 and its homolog gene in rice, we designed 2 targets using CRISPR-Cas9 (Fig. 2K; Supplemental Fig. S11). As expected, GSL1 also played an essential role in regulating grain size (e.g. GW and grain length/GW) like GS10 but had a redundant function in the ARM subfamily (Fig. 2, M–N).
Expression pattern and subcellular localization of GS10
To investigate the expression pattern of GS10, we examine the transcript levels in various tissues in GLA4, including young panicles, flag leaf, leaf sheath, tiller bud, and endosperm. Reverse transcription quantitative PCR (RT-qPCR) revealed that the GS10 transcript level was high in both younger seedlings and young panicles (Fig. 3A). These results suggested GS10 might play an important role in leaf and panicle development. Observations during grain filling showed that the caryopsis of NIL-gs10 was more slender than that of GLA4 from 7 days after fertilization (DAF) (Fig. 3, B and C).
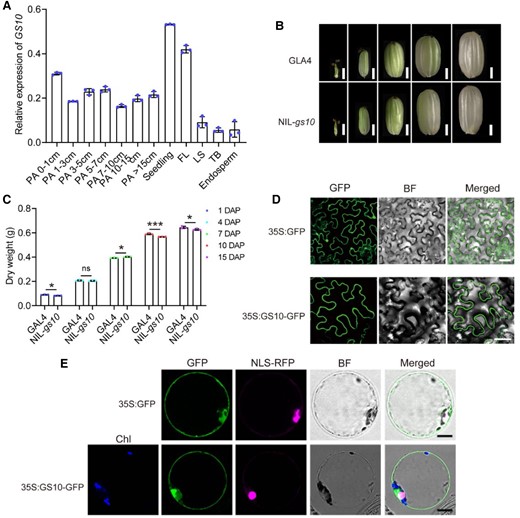
Expression pattern and subcellular localization of GS10. A) Relative expression of GS10 in different tissues of GLA4. PA, panicle before heading; FL, flag leaf; LS, leaf sheath; TB, tiller bud. OsUBQ5 was used as the control. Data are presented as mean values ± Sd, n = 3 biologically independent samples. B) Comparison of the shape of developing caryopsis at indicated DAF between GLA4 (left) and NIL-gs10 (right). Scale bars, 1 mm. C) Statistics of developing caryopsis dry weight at indicated days between GLA4 and NIL-gs10. Data are presented as mean values ± Sd, n = 3 biologically independent samples. Subcellular localization of GS10 (35S::GS10-GFP) in N. benthamiana leaf D) and rice protoplasts E). The plasmid 35S::GFP and NLS-RFP (nuclei marker) were used as the control. Scale bar, 10 μm D) and 20 μm E) in N. benthamiana leaf; 10 μm in rice protoplasts. Chl, chlorophyll. BF, bright field. Student's t-test significant difference, *P < 0.05 and ***P < 0.001; ns, not significant.
To determine the subcellular localization of GS10, p35S::GS10-GFP (the full-length cDNA of GS10 fused to the N terminus of GFP) and NLS (nuclear localization signal)-RFP plasmids were transformed into rice, Arabidopsis protoplast or Nicotiana benthamiana epidermal cells, and the results showed GS10 localized in the cytoplasm (Fig. 3, D and E; Supplemental Fig. S12A). We also detected the subcellular localization between GW5 (plasma membrane marker) and GS10; the results showed GS10 mainly distributed in the cytoplasm (Supplemental Fig. S12B). The loss-of-function allele protein gs10 fused with GFP was also constructed and transformed into N. benthamiana epidermal cells; the results showed that the truncated protein was distributed randomly in the cell and could not be appropriately located in the cytoplasm (Supplemental Fig. S12C).
GS10 regulates grain size by affecting cell size
The spikelet hull just before fertilization was much more slender in NIL-gs10 than in GLA4 and the outer hull size depends upon the developmental processes of cell division and cell expansion (Fig. 4, A–C). Scanning electron microscopy observation showed no difference in cell number in the longitude and latitude of the outer surface of the glumes. The reduced cell width suggested that GS10 might regulate grain size by affecting cell size (Fig. 4, C–E).
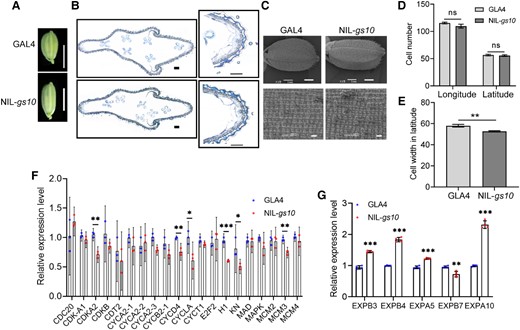
GS10 regulates grain shape by altering cell size. A) Histological comparison of spikelet hulls between GLA4 and NIL-gs10. Scale bars, 5 mm. B) Cross-sections of spikelet hulls. The right images show closeup views of the boxed region. Scale bars, 100 μm. C) Scanning electron microscopy observation of the outer glumes between GLA4 and NIL-gs10. D) Cell number in longitude and latitude of glumes (n = 4). E) Statistics of cell width in latitude (n = 4). Relative expression levels of cell cycle-related genes F) and cell-expansion genes G) in young panicles (1 to 3 cm) of GLA4 and NIL-gs10. OsUBQ5 was used as the control, and the expression levels in GLA4 were set to 1. n = 3 biologically independent samples. Values are given as the mean ± Sd. Student's t-test significant difference: *P < 0.05, **P < 0.01 and ***P < 0.001; ns, not significant.
Meanwhile, we compared the expression level of cell division- and cell expansion-related genes in the young panicles of GLA4 and NIL-gs10 using RT-qPCR. Only a small amount of cell division-related genes, like CDKA2, CYCA2-3, CYCD4, H1, and MCM3, were significantly changed (Fig. 4F). But in terms of expansion genes, the expression of OsEXPB3, OsEXPB4, OsEXPB5, and OsEXPB10 were increased in NIL-gs10 (Fig. 4G). Taken together, we demonstrated that GS10 regulated grain shape mainly by affecting cell expansion.
GS10 interacts with TUD1 that is involved in BR signaling
ARM repeat proteins play a vital role in regulating many biological processes in plants and animals (Tewari et al. 2010; Ye et al. 2012; Supplemental Fig. 10B). GS10 encodes an unknown protein with only 6 ARM repeats, with many putative orthologs in land plants. TUD1/ELF1 encodes a functional U-box E3 ubiquitin ligase and ARM repeats that interacts with D1 (RGA1), which acts as a positive regulator of BR signaling by affecting plant height and grain size (Hu et al. 2013). TUD1 predominantly localizes to the plasma membrane and physically interacts with D1 (RGA1). We also investigated the relationship between TUD1, D1, and GS10 using yeast-two-hybrid (Y2H), firefly luciferase (LUC) complementation imaging (LCI), and biomolecular fluorescence complementation (BiFC) assays (Fig. 5, A–C). Interestingly, GS10 could physically interact with TUD1 but not with D1, indicating GS10 may act as a membrane-interacting protein and be involved in BR signaling.
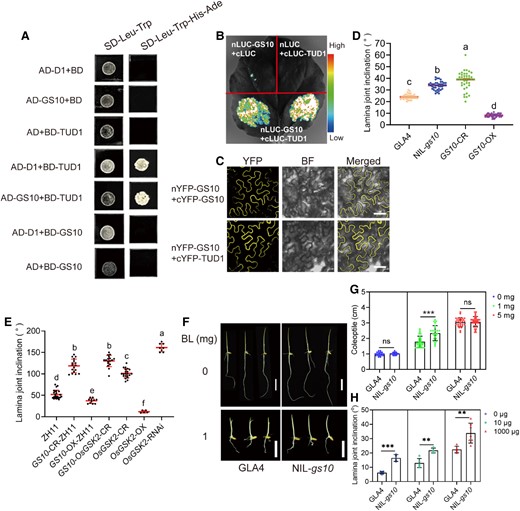
GS10 interacts with TUD1, which is involved in BR signaling. A) Y2H assay of GS10, TUD1, and D1. AD, activation domain; BD, binding domain. SD–Leu–Trp–His–Ade (or SD–Leu–Trp), SD medium lacks Leu, Trp, Ade, and His (or lacks Leu, Trp). B) In vivo protein interaction of GS10 and TUD1 based on LCI in N. benthamiana leaf. C) BiFC assay between GS10 and TUD1 in N. benthamiana leaf. nYFP-GS10 and cYFP-GS10 were used as the control. BF, bright field. D) Statistics of lamina joint inclination in GLA4, NIL-gs10, GS10-CR, and GS10-OX. n = 40. E) Statistics of lamina joint inclination in ZH11, GS10-CR-ZH11, GS10-OX-ZH11, GS10-OsGSK2-CR, OsGSK2-CR, OsGSK2-OX, and OsGSK2-RNAi transgenic lines. n ≥ 40. F) Comparison of 3-d seedlings after 0 and 1 mg BL treatment based on GLA4 and NIL-gs10 background. BL, brassinolide. Scale bars, 1 cm. G) Statistics of coleoptile after 0 and 1 mg BL treatment based on GLA4 and NIL-gs10 background. n = 19. H) Lamina joint inclination comparison of GLA4 and NIL-gs10 after 0 and 1 mg BL treatment, n ≥ 4. As determined by Duncan's multiple-range test, lowercase letters indicate significant differences (P < 0.05). Values are given as the mean ± Sd. Student's t-test significant difference: *P < 0.05, **P < 0.01, and ***P < 0.001; ns, not significant.
It is generally accepted that BR plays a vital role in many important agronomical traits of rice, including plant height, grain size, and lamina joint inclination (Tong and Chu 2018). From the transgenic test, we found that the CRISPR transgenic plants exhibited very loose plant architecture in both indica (GS10-CR) and japonica subspecies (DJ-CR and NIP-CR), compared to its wild type (Fig. 5D; Supplemental Fig. S7A). Given that GS10 acts as a negative regulator in BR signaling, we tried to find the coregulator (mainly distributed in the cytoplasm) in the BR pathway. We firstly examined the relationship between GS10 and BR signaling-related genes, including GW5-C2, OsBZR1, OsBRI1, OsBAK1, OsGSK2, OsGSK3, and OsGSK5. Using Y2H, the results showed that GS10 could not interact with them (Supplemental Fig. S13A). Interestingly, we found OsOFP8 (OVATE Family Protein 8) could physically interact with GS10 (Supplemental Fig. S14, A–C; Yang et al. 2016). Previous studies have shown OsGSK2 can interact with OsOFP8 and phosphorylate it, and the phosphorylated OsOFP8 could shuttle to the cytoplasm (Yang et al. 2016). Based on that study, we wondered whether GS10 could also affect the subcellular distribution of OsOFP8. Indeed, OsOFP8 shuttles to the cytoplasm in the presence of GS10, suggesting GS10 interacts with OsOFP8 by affecting its subcellular location (Supplemental Fig. S14D).
Considering the OsGSK2-OX line could dramatically affect plant height and grain size in rice, which is consistent with the transgenic lines tud1 and d1 (Liu et al. 2022). We also investigated the relationship between OsGSK2 and TUD1 using Y2H and LCI. The results showed that OsGSK2 could interact with TUD1, which is consistent with the previous studies (Supplemental Fig. S13, B and C; Liu et al. 2022). Furthermore, the double mutants tud1-CR1; gs10-CR4 exhibited similar grain shape and plant height phenotype compared to the tud1-CR1 (Supplemental Fig. S13, D–J). Besides, we constructed the double mutant lines (OsGSK2-GS10-CR) to investigate the genetic relationship between OsGSK2 and GS10. Compared to OsGSK2-CR and GS10-CR-ZH11, the double mutant OsGSK2-GS10-CR showed a phenotype of loose plant architecture and larger leaf inclination (Fig. 5E; Supplemental Fig. S15, A and C). In terms of grain shape, the double mutant GS10-OsGSK2-CR showed a similar phenotype, indicating GS10 was epigenetic to OsGSK2 and may play a downstream role in BR signaling (Supplemental Fig. S15, B and D–H). We speculated that GS10 might be involved in BR signaling by regulating grain size and leaf inclination, then we examined the relative expression of BR synthesis genes, including D2, D11, OsBRD1, D61, and BU1. Among them, the expression of D2, D11, and OsBRD1 in NIL-gs10 was increased compared to GLA4, indicating GS10 could negatively regulate BR synthesis (Supplemental Fig. S16). When treated with BL, the GS10-CR-ZH11 plant showed much longer coleoptile and larger leaf inclination than wildtype (Fig. 5, F–H).
Combining GW5 and GS10 can improve the appearance quality
GW5 and GW7/GL7 are the 2 master genes identified in the BILs, regulating grain shape and grain quality, as previously reported (Shomura et al. 2008; Weng et al. 2008; Wang et al. 2015a, 2015b; Liu et al. 2017). To investigate the relationship between gs10 and other grain size-related genes in future rice breeding, we got different pyramiding lines through the combination of NIL-gs10, NIL-GW5, and NIL-GL7 (Fig. 6A). From the analysis of grain shape between NIL-GW5/gs10, NIL-GL7/gs10, and NIL-gs10, we found that gs10 has an additive effect on GW7 and GW5 in both GW and grain length/GW, while the grain weight was decreased in pyramiding line NIL-gs10/GL7, NIL-gs10/GW5, indicating GS10 regulate grain size independent of GL7/GW7 and GW5. Consequently, the grain weight of GW5/GW7/gs10 was significantly changed, which was reduced by 20%, suggesting that introgressing gs10 into cultivars could improve grain shape and appearance quality but reduce grain yield (Fig. 6, B–D).
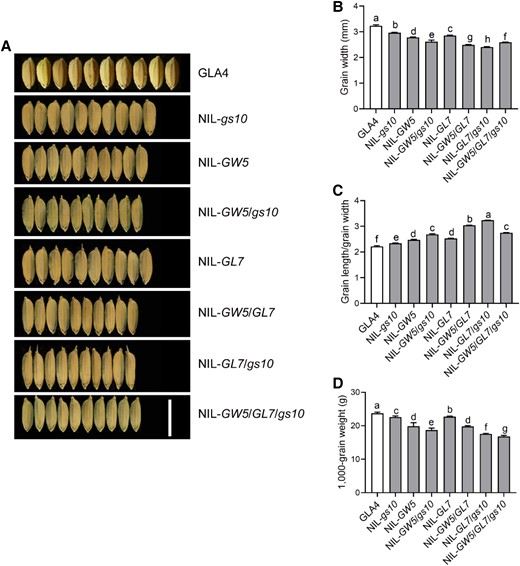
Relationship between gs10 and other grain-size QTLs. A) Phenotypes of grain shape between different pyramiding lines. The pyramiding lines NIL-gs10/GL7, NIL-gs10/GW5, NIL-GL7/GW5, and NIL-gs10/GW5/GL7 were constructed through the combination between NIL-gs10, NIL-GW5, and NIL-GL7 (also referred to NIL-GW7); NIL-GW5, the near-isogenic line contains the GW5 allele in GLA4; NIL-GL7/GW7, the near-isogenic line has the GL7/GW7 allele in GLA4; Scale bar, 1 cm (for all panels). Comparison of GW B), grain length/GW C) and 1,000-grain weight D) between different pyramiding lines, n = 6. Values are given as the mean ± Sd. As determined by Duncan's multiple-range test, lowercase letters indicate significant differences (P < 0.05).
To date, grain shape change (especially the grain length/GW ratio) is closely associated to grain quality (Wang et al. 2012; Liu et al. 2018). For transparency of the brown rice, NIL-gs10 shows no obvious change in chalkiness compared to GLA4 in terms of the percentage of chalky grain and chalkiness degree (Fig. 7). Interestingly, pyramiding gs10 and GW5 into GLA4 can significantly produce much better quality, as well as improve grain shape and reduce chalkiness (Supplemental Fig. S17A). To further investigate the inner grain quality of gs10, we detected taste value, protein content, apparent amylose content, and fatty acid content using the taste analyzer. Intriguingly, we found that gs10 could slightly decrease protein content but not affect taste value, obvious amylose content, and fatty acid content (Supplemental Fig. S17, B–E). Besides, GW5 and gs10 significantly improve the taste value by decreasing protein content and apparent amylose content compared to GW5 and GS10.
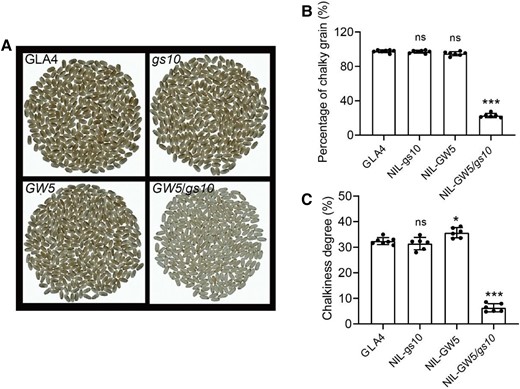
Pyramiding gs10 and GW5 could significantly improve rice grain appearance quality. A) The shape of milled rice of NIL-gs10, NIL-GW5, and NIL-GW5/gs10 and its recipient GLA4. Decreased chalkiness in milled rice of NIL-GW5/gs10 compared with those of GLA4. Statistics of the percentage of chalky grain B) and chalkiness degree C) between GLA4, NIL-gs10, NIL-GW5, and NIL-GW5/gs10; n = 6. Values are given as the mean ± Sd. Student's t-test significant difference: *P < 0.05 and ***P < 0.001; ns, not significant.
Natural variation of GS10
To further uncover the natural variation in the rice population, 111 wild rice accessions and 989 landraces (including 19 aus, 5 aromatic, 22 intermedia, 539 indica, 49 tropical japonica, and 363 temperate japonica) were selected to investigate the natural variation of GS10 (Huang et al. 2012). Based on the sequencing of the coding region of GS10, 11 polymorphic sites, including 7 SNP and 5 insertions or deletions (InDels), were identified to form 16 haplotypes across the whole rice species (Supplemental Fig. S18, A, B and Data Set S1). The wild rice population was classified into 13 haplotypes, of which 6 with insertion–deletion mutation may cause a premature stop in the coding region. But in landraces, the population could be divided into 6 haplotypes, of which the allele that causes loss-of-function mainly within aus and aromatic.
Previous studies have assumed that a selective sweep conferring GW exists within the flanking region of GS10 (Huang et al. 2012). We also tested whether GS10 is a domesticated gene that regulates grain size during domestication using Tajima's D test, indicating GS10 is not a domestication gene (Fig. 8A; Supplemental Fig. S18C). Comparative analysis revealed that gs10 from W1943 is a rare allele across the rice population. Allelic mutation of GS10 in the wild rice population may act as a natural pool to provide more variations to improve rice appearance quality.
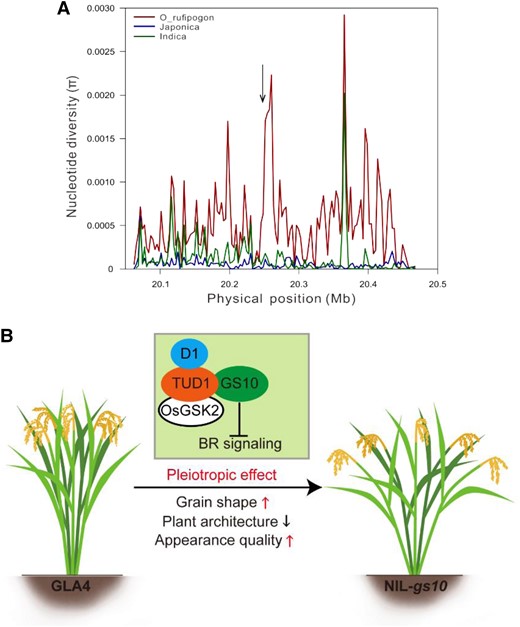
Natural variation of GS10 in rice population. A) Genetic diversity around the GS10 region. Red, green, and blue lines indicate nucleotide diversity (π) of all sites in O. rufipogon, O. indica, and O. japonica, respectively. The arrow indicates the position of GS10. B) A proposed working model of GS10 for regulating grain shape, plant architecture, and grain quality.
Discussion
GS10 confers grain size and grain quality
The Tandem repeated protein family, which widely exists in plants and animals, plays a vital role in the growth and development process (Coates 2003; Barkan and Small 2014). There are 158 ARM proteins in rice (Sharma et al. 2014). However, limited mechanisms of this superfamily have been characterized to date. Research on plant ARM proteins has mainly focused on plant U-box (PUB) subfamily proteins. The PUB proteins contain a modified RING domain (U-box E3 ligases), which is known to be involved in biotic stress responses through the ubiquitin-proteasome system. Nevertheless, the subfamily proteins with 6 ARO proteins are mostly unknown.
In our study, we cloned a gene GS10 with 6 ARO from wild rice, a component that regulates grain size by affecting cell size (Fig. 8B). We proposed that GS10 has a pleiotropic effect on many agronomic traits, which might coincide with its transcriptome regulation. Notably, the allele gs10 from W1943 displays the slender and narrow grain, improving appearance quality without reducing grain yield and overcoming the tradeoff between grain quality and yield (Supplemental Fig. S4).
GS10 acts as a negative regulator involved in BR signaling
BRs play a vital role in plant growth and development (Tong and Chu 2018). OsGSK2, homologs of AtBIN2 and GSK3, acts as a central kinase in BR signaling in Arabidopsis and rice (Tong and Chu 2018). OsGSK2 interacts with and phosphorylates many BR downstream proteins, like OsOFP8, OsGRF4/GL2, and OsBZR1 (Che et al. 2016; Yang et al. 2016; Fang et al. 2020). Unlike plants, GSK3 interacts with and phosphorylates β-catenin or Arm coupling with Axin and APC (Youn and Kim 2015). From our results, TUD1 could interact with GS10, but GS10 could not physically interact with OsGSK2 and D1, indicating GS10 might act as a plasma membrane interacting protein, participating in the G protein module (D1-TUD1-GS10) and BR signaling (OsGSK2-OsOFP8-GS10) (Fig. 5). We speculated that GS10 regulated grain shape and plant architecture in an OsGSK2-OsOFP8-dependent manner. For the potential mechanism of the TUD1-GS10 module involved in BR signaling, TUD1 might modulate the stability of GS10 in a ubiquitin-dependent manner. This hypothesis requires further research.
In our study, we demonstrate GS10 interacts with TUD1 which is involved in BR signaling, then regulating grain shape and plant architecture. We tried to address the protein relationship between GS10, TUD1, and OsGSK2. Recently, a paper demonstrated that TUD1 promotes BR-induced OsGSK2 degradation in rice (Liu et al. 2022). In their model, TUD1 could interact with OsGSK2 which is involved in BR signaling. We found GSK2 could interact with TUD1 in SD–Leu–Trp–His, rather than in SD–Leu–Trp–His–Ade (Supplemental Fig. S13B). We also use LCI to validate it (Supplemental Fig. S13C). The double mutant tud1-CR1; gs10-CR4 has similar grain shape and plant architecture phenotype compared to tud1-CR1, indicating TUD1 is epistatic to GS10 (Supplemental Fig. S13, D–I).The mutant tud1-CR1 has striking phenotype that is involved in BR signaling, we want to uncover whether TUD1 promotes GS10 degradation at the protein level in the future. In our system, we assumed that TUD1 and OsGSK2 have a weak interaction at protein level. So, we assumed that GS10, TUD1, and OsGSK2 may form a protein complex in BR signaling. We want to investigate the relationship between GS10 and OsGSK2, and the results showed OsGSK2 could not interact with GS10. We construct the double mutants CR-GS10-OsGSK2 to further demonstrate that GS10 is indeed involved in BR signaling.
We also found that GS10-CR transgenic plants in indica and japonica lines exhibited a BR-sensitive phenotype, indicating that GS10 could affect BR syntheses- and signaling-related gene expressions, like D2, D11, and OsBRD1 (Supplemental Fig. S17A). GS9 encodes an unknown transcription activator interacting with OsOFP14 and OsOFP8 to regulate grain shape and quality (Zhao et al. 2018a). We also got the targeted double mutant line GS9-GS10-CR using CRISPR-cas9, showing that GS10 had an addictive effect on grain length and GW with GS9, resulting in a more slender and narrower grain hull (Supplemental Fig. S19). We assumed that GS10 might function dependently on GS9 in BR signaling, and the resulting GS9-GS10-CR mutant could further improve grain shape.
GS10 is a rare allele and has the potential for future breeding
The null mutant gs10 with a slender and narrow grain could affect apparent amylose and protein contents to regulate grain quality. Pyramiding gs10 and GW5 could substantially improve the appearance quality of brown rice, and these results were consistent with the mechanism underlying grain quality of GW8 and OsMADS1 (Fig. 7; Supplemental Fig. S17; Wang et al. 2012; Liu et al. 2018). Previous studies have shown that GW5 acted as a domestication gene conferring GW and quality, favored in modern cultivars (Liu et al. 2017). We speculated that the rare allele gs10 was not favored to be selected during domestication, which might be attributed to its negative role in pyramiding breeding regarding grain weight. We also analyzed the milled rice rate between GLA4 and NIL-gs10, and GS10 could change the speed of milled rice by regulating cell size, thereby improving grain quality in rice (Fig. 3, B and C).
In summary, GS10 could balance grain yield, plant architecture, and grain quality during rice domestication. In the future, the wild rice population should be used as a natural resource to identify more beneficial alleles of GS10, thus improving grain quality. We confirm that the GW5-gs10 pyramiding lines will provide a strategy for improving the grain quality in hybrid rice.
Materials and methods
Plant materials, trait measurement, and BL treatment
All the rice materials grew in the experimental field in Shanghai and Hainan, China. The grain length, GW, and grain weight of mature seeds were measured by the image method provided with SC-E software (Hangzhou Wanshen Detection Technology Co., LTD). For inner grain quality, we measured taste value, protein content, apparent amylose content, and fatty acid content using the taste analyzer (SATAKE). The elite breeding line Koshihikari was used as the control, and the taste value is 78.
For the BL treatment assay, the lamina inclination assay was performed as previously described (Hong et al. 2003). Plants were grown for 3 d (d) after 2-d germination at 30 °C. Then, ethanol (1 mL) containing 0, 10, 100, or 1,000 ng of BL (sigma) was spotted on the top of the lamina. Images were taken after a 3-d incubation, and the angles of lamina joint inclination bending were measured.
Molecular mapping of GS10
For the fine-mapping of GS10, we developed 5,250 BC2F4 populations derived from the backcross between CSSL50 and the recipient parent GLA4. The mapping primers were designed based on the reference genome of GLA4 and W1943, and the primer sequences are given in Supplemental Data Set 2.
Histological analysis
For the cross-sections, fresh young spikelet hulls were fixed in formaldehyde:acetic acid (FAA: 50% [v/v] ethanol = 5:5:90), dehydrated, embedded in Eponate 12 (Ted Pella), and then sectioned. Cross-sections were captured by Zeiss Axio imager.M2, and the cell number in the outer parenchyma cell layer of hulls was measured using ImageJ.
Mature seeds were first cleaned ultrasonically several times to remove epidermal hairs and dust. The samples were then dried in a critical point drier and coated with a gold sputter. For glume cell observation, the outer surfaces of the spikelet glumes were observed by scanning electron microscope (S-4800, Hitachi). Cell size and cell number were calculated along the longitudinal axis. For starch granule observation, natural cross-sections of mature milled rice were observed by scanning electron microscope.
Vector construction and rice transformation
For the complementary test, we constructed the 2 kinds of complementary plasmids, CP-1, and CP-2. The 3-kb promoter fragments of GS10 were amplified from GLA4 and W1943 with the primers. The genomic sequence containing the GS10 promoter from GLA4 fused with the coding region of GS10 from GLA4 was inserted into the pCAMBIA1300 binary vector to generate the CP-1 (pGLA4::gGS10GLA4) expression vector. Similarly, CP-2 (pW1943::gGS10GLA4) was generated using the promoter of GS10 from W1943 and the cDNA of GS10 from GLA4.
For overexpressing construction, the coding region of GS10 was amplified and then introduced into pCAMBIA1300 under the control of the maize ubiquitin promoter. To knock out genes by CRISPR-Cas9, the sgRNAs of GS10, GSL1, OsGSK2, and GS9 were selected by CRISPR-P 2.0 (http://crispr.hzau.edu.cn/CRISPR2/) (Ma et al. 2015). The above-constructed plasmids were then transformed into rice callus using Agrobacterium tumefaciens-mediated methods. Each T0 transgenic plant with positive lines was more than 10 lines. The above primer sequences are given in Supplemental Data Set 2.
Y2H assays
The Y2H assay was performed according to the manufacturer's instructions (Clontech). The coding region of GS10, TUD1, GSL1, GW5-C2 (Liu et al. 2017), OsBZR1, OsBRI1, OsBAK1, OsGSK2, OsGSK3, OsGSK5, and OsOFP8 were amplified and then inserted into pGBKT7 or pGADT7. The constructed vectors were transformed into yeast strain AH109 or Y2H. The yeast cells were spotted on the plates that contain SD medium lacking Leu, Trp, Ade, and His. The pictures were taken 3 d later after incubation at 30 °C.
BiFC, LCI, and subcellular localization
For BiFC and LCI, the coding region of GS10, TUD1, GSL1, OsGSK2, and OsOFP8 were amplified and fused with the N terminal or C terminal of YFP and LUC, respectively. For subcellular localization, the CDS of GS10, GW5, and OsOFP8 were inserted into 35S-GFP and 35S-mCherry. The NLS sequence was fused in-frame with RFP into PA7-35S-RFP as a nuclear marker. The constructed plasmids were transformed into N. benthamiana leaves or rice protoplasts. Agrobacterium tumefaciens GV3101, suspended in infiltration buffer (10 mM MgCl2, 10 mM methyl ester sulfonate, 150 μ M acetosyringone) and then expressed in the leaves of N. benthamiana. Fluorescence was observed by confocal microscopy (ZEISS880; Carl Zeiss). YFP signals were excited at 514 nm and emission was detected at 520 to 545 nm. For LCI assay, the sample leaves were injected with 1× luciferin, and the resulting LUC signals were detected using the Tanon-5200M image system.
RNA extraction and RT-qPCR
Total RNA was extracted using the TRIzol reagent (Invitrogen) according to the manufacturer's instructions. Then 500 to 1,000 ng of total RNA was used to synthesize the first-strand cDNA using ReverTra Ace qPCR RT Master Mix with gDNA Remover (Toyobo). RT-qPCR was performed on the Applied Bio-systems QuantStudio 5 PCR system with diluted cDNA as a template using THUNDERBIRD SYBR qPCR Master Mix (Toyobo), and OsUBQ5 was used as a control. Each set of experiments was repeated 3 times.
Phylogenetic analysis
Homologs of GS10 in rice and A. thaliana were obtained using the NCBI BLASTP program (Supplemental Data Set 3). Multiple sequence alignments of protein were performed using the ClustalW program. The phylogenetic tree of the aligned sequence was constructed by MEGA-X using a neighbor-joining tree with 1,000 bootstrapped replicates. A graphic view was displayed as black color, indicating identical or conserved amino acids, respectively.
Haplotype analysis and neutrality test
For GS10 nature variation analysis, the landraces were collected and sequenced in low coverage (Huang et al. 2012). The sequence of GS10 was aligned using Blast (Version 2.2.26) to confirm the target sequence. Then target sequences in the rice population were extracted using a customized Perl script, and the diffseq program further called sequence variants in the EMBOSS package (Version 4.0). Haplotype analysis for GS10 among the rice population was conducted by customized Perl script. Nucleotide diversity and Tajima's D test were performed using DnaSP version 6.12.03 (Rozas et al. 2017).
Statistical analysis
Statistical analyses were carried out using GraphPad Prism software (Version 8.0) and Microsoft Excel 2010 with a 2-tailed Student's t-test for the comparison of 2 groups and R package “agricolae” with Duncan's multiple-range tests for multiple mean comparisons.
Accession numbers
The sequence data from this article can be found on the China Rice Data Center website (http://www.ricedata.cn/gene/) under the following accession numbers: GS10 (LOC_Os10g37850), GSL1 (LOC_Os03g02580), TUD1/ELF1 (LOC_Os03g13010), OsOFP8 (LOC_Os01g64430), and OsGSK2 (LOC_Os05g11730).
Acknowledgments
We thank Prof. Chengcai Chu (Institute of Plant Physiology and Ecology, Chinese Academy of Sciences) and Hongning Tong (Institute of Crop Sciences, Chinese Academy of Agricultural Sciences) for providing GO (OsGSK2-OX) and Gi (OsGSK2-RNAi) transgenic lines. We thank Yaoguang Liu (South China Agricultural University) for providing the CRISPR-Cas9 vector. We thank Jiqin Li, Xiaoyan Gao, and Shuining Yin (CAS Center for Excellence in Molecular Plant Sciences, Institute of Plant Physiology and Ecology, Chinese Academy of Sciences) for their technical support.
Author Contributions
B.H. conceived the research; E.C. and B.H. designed the study. E.C. performed most of the experiments. E.C., Q.H., K.L., B.D., J.Z., Y.S., D.L., and Z.W. all performed the experiments; Z.G. Y.Z. and X.H. did the informatics analysis; E.C., Q.H., K.L., A.W., Y.W., and Z.W. were responsible for field management and phenotype investigation; T.H. managed server station; Q.F., C.Z., and D.F. performed library construction and whole genome sequencing; E.C. and B.H. wrote the article; E.C., Q.H., K.L., and B.H. read and approved the writing.
Supplemental data
The following materials are available in the online version of this article.
Supplemental Figure S1. Identification and selection of grain size-related QTLs derived from the BILs of W1943 and GLA4.
Supplemental Figure S2. Identification and selection of the NIL-gs10.
Supplemental Figure S3. Comparison of nucleic acid and protein sequences between 2 different GS10 alleles of GLA4 and W1943 (supports Fig. 2).
Supplemental Figure S4. Comparison of other important agronomic traits between GLA4 and NIL-gs10.
Supplemental Figure S5. Comparison of GW and grain length/GW between 2 T1 complementary lines (CP1-T1 and CP2-T1).
Supplemental Figure S6. Analysis of plant architecture and relative expression levels in different lines (supports Fig. 2).
Supplemental Figure S7. The lamina inclination and flag leaf comparison between GLA4, NIL-gs10, GS10-CR, and GS10-OX (supports Fig. 2).
Supplemental Figure S8. GS10 knock-out line in japonica backgrounds using CRISPR-Cas9.
Supplemental Figure S9. GS10 transgenic validation using T-DNA mutant.
Supplemental Figure S10. Diagram of the ARM protein structure.
Supplemental Figure S11. Protein sequence comparison and GSL1 gene-editing analysis using CRISPR-Cas9.
Supplemental Figure S12. Subcellular localization of GS10 (supports Fig. 3).
Supplemental Figure S13. Y2H assay analysis and protein interaction validation between TUD1 and OsGSK2 (supports Fig. 5).
Supplemental Figure S14. In vivo and in vitro analysis of the interaction between GS10 and OsOFP8.
Supplemental Figure S15. Genetic analysis of plant architecture and grain size between GS10 and OsGSK2 transgenic lines (supports Fig. 5).
Supplemental Figure S16. Relative expression of BR synthesis genes.
Supplemental Figure S17. Comparison of appearance and taste quality between GLA4, NIL-gs10, NIL-GW5, and NIL-gs10/GW5 (supports Fig. 7).
Supplemental Figure S18. Haplotype analysis and Tajima's D test across the rice population (supports Fig. 8).
Supplemental Figure S19. Genetic analysis between GS9 and GS10 using CRISPR-Cas9.
Supplemental Data Set S1. The coding region sequencing of GS10 across the rice population.
Supplemental Data Set S2. Primers were used in the study.
Supplemental Data Set S3. Phylogenetic analysis of putative ARM proteins in representative species.
Funding
This work was supported by grants from the National Natural Science Foundation of China (31788103), the Chinese Academy of Sciences (XDB27010301), Shanghai Municipal Commission of Science and Technology (18JC1415000).
Data availability
All data are available from the corresponding author upon requests.
References
Author notes
Erwang Chen, Qingqing Hou and Kun Liu contributed equally to this work.
The author responsible for distribution of materials integral to the findings presented in this article in accordance with the policy described in the Instructions for Authors (https://dbpia.nl.go.kr/plphys/pages/General-Instructions) is Bin Han ([email protected]).
Conflict of interest statement. None declared.
