


Abstract
Leaf margins are complex plant morphological features that contribute to leaf shape diversity, which affects plant structure, yield, and adaptation. Although several leaf margin regulators have been identified to date, the genetic basis of their natural variation has not been fully elucidated. In this study, we profiled two distinct leaf morphology types (serrated and smooth) using the persistent homology mathematical framework (PHMF) in two poplar species (Populus tomentosa and Populus simonii, respectively). A combined genome-wide association study (GWAS) and expression quantitative trait nucleotide (eQTN) mapping were applied to create a leaf morphology control module using data from P. tomentosa and P. simonii populations. Natural variation in leaf margins was associated with YABBY11 (YAB11) transcript abundance in poplar. In P. tomentosa, PtoYAB11 carries a premature stop codon (PtoYAB11PSC), resulting in the loss of its positive regulation of NGATHA-LIKE1 (PtoNGAL-1) and RIBULOSE BISPHOSPHATE CARBOXYLASE LARGE SUBUNIT (PtoRBCL). Overexpression of PtoYAB11PSC promoted serrated leaf margins, enlarged leaves, enhanced photosynthesis, and increased biomass. Overexpression of PsiYAB11 in P. tomentosa promoted smooth leaf margins, higher stomatal density, and greater light damage repair ability. In poplar, YAB11-NGAL1 is sensitive to environmental conditions, acts as a positive regulator of leaf margin serration, and may also link environmental signaling to leaf morphological plasticity.
Introduction
Leaf shape strongly influences plant structure, fruit yield, and quality (Murchie et al., 2009; Rowland et al., 2020). Wider and thinner leaves promote plant photosynthesis and gas exchange (Tsukaya, 2006). In terms of ecological function, leaf shape also prevents damage by insects (Higuchi and Kawakita, 2019). Therefore, optimizing leaf shape is a major challenge in plant breeding. Leaves of eudicots exhibit a staggering diversity of forms, including smooth, serrated (with shallow protrusions), and lobed (with deeper protrusions) (Nikolov et al., 2019). Diverse eudicot leaf shapes result from small variations in three interwoven processes: the patterning of serrations, lobes, and/or leaflets on the leaf margin; vascular system patterning; and growth of the leaf blade spanning the main veins (Runions et al., 2017). The establishment of leaf margins depends on the delimitation of the adaxial and abaxial sides of the leaf relative to the central axis. In Arabidopsis (Arabidopsis thaliana) leaf epidermal cells, the auxin maxima and CUP-SHAPED COTYLEDON2 (CUC2) form an alternating pattern along the proximal margin of leaves that is necessary for normal serration patterns (Nikovics et al., 2006). Auxin is active in miR164a, a negative regulator of CUC2 in the establishment of alternating leaf margin patterns (Bilsborough et al., 2011). NGATHA-LIKE1–3 (NGAL1–3) also negatively regulates leaf margin serration formation by modulating CUC2 transcript abundance (Shao et al., 2020). In addition to the auxin response regulator, REDUCED COMPLEXITY (RCO) also controls the final shape of protrusions by promoting growth repression near the leaf base (Vlad et al., 2014). Thus, a multi-layered regulatory network is involved in leaf margin development.
Quantitative trait locus (QTL) mapping, linkage mapping, and genome-wide association studies (GWAS) are powerful tools used to understand complex genetic traits. In poplar (Populus trichocarpa), single-nucleotide polymorphisms (SNPs) in GALACTURONOSYL-TRANSFERASE 9 (GAUT9) are significantly associated with leaf length (LL), leaf width (LW), leaf area (LA), and the length-to-width ratio (Chhetri et al., 2019). PtrYABBY3, a plant-specific transcription factor (TF) linking adaxial–abaxial polarity with leaf growth activity, is significantly associated with LA (Chhetri et al., 2019). LA, LL, LW, and the length-to-width ratio can be determined using manual or digital measurements, whereas more complex phenotypes such as leaf margins must be defined algorithmically (Biot et al., 2016). To determine the main regulators of natural leaf margin variation, accurate high-throughput leaf morphological feature analysis is required.
Leaf Shape Determination (LAMINA) software provides an efficient and accurate means of analyzing LA from large datasets (Bylesjö et al., 2008). The MowJoe image processing algorithm converts leaf data into graphs through image skeletonization to yield information on leaflets and leaf shapes (Failmezger et al., 2018). Elliptical Fourier descriptors (EFDs) have been used for global analyses of grape leaf outlines and lobe positions (Chitwood and Topp, 2015). The persistent homology mathematical framework (PHMF) inputs pixels of the leaf contour as a two-dimensional point cloud, and then applies a neighborhood density estimator to each pixel (Li et al., 2018). Integrating complex plant morphological features into a single descriptor can capture morphological variation more comprehensively than measuring univariate features (Li et al., 2018). These studies indicate that integrating high-throughput, accurate leaf morphological feature analysis and GWAS offers a powerful genetics tool for identifying the major regulators of leaf margin.
Although several leaf morphology regulators have been identified to date, environmental influences on leaf shape should not be ignored. Heterophylly is a striking feature of plants that grow at the borders of terrestrial and aquatic environments and are often subjected to partial submergence (Nakayama et al., 2017). Gibberellic acid (GA), abscisic acid (ABA), ethylene, and auxin have also been found to play important roles in the interplay between leaf development and the environment (Nakayama et al., 2017; He et al., 2021; Zhang et al., 2020). In P. trichocarpa, PtrYAB3 was not only associated with leaf morphology, but also had substantial effects on stomatal density and carbon isotopes (Chhetri et al., 2019). Understanding the genetic basis of leaf morphology development may also shed light on its adaptive importance.
Populus consist of five subgenera, Aigeiros, Leuce, Leucoides, Tacamahaca, and Turanga, which contain abundant leaf morphological diversity within and among species, making poplar an ideal model plant for analyzing the genetic basis of natural leaf type variation (Song et al., 2020). In this study, PHMF was used to accurately characterize two distinct leaf morphological features in the natural populations of Populus tomentosa and Populus simonii. We performed integrated GWAS and eQTN analyses to identify the major regulator of leaf margins in Populus. The results of this study introduce a molecular mechanism involved in leaf morphological development that responds to environmental conditions.
Results
Profiling distinct poplar leaf traits
Poplar leaf morphology varied among subgroups. In this study, P. tomentosa and P. simonii leaves with two markedly different leaf traits were analyzed using PHMF. PHMF-based features integrate completely different plant morphological features into a single descriptor (Figure 1). In total, 112 leaf traits were derived from 435 unrelated P. tomentosa individuals and 505 unrelated P. simonii individuals collected from natural populations (Supplemental Data Set 1). The top five principal components (PC1–5) explained 61.2% and 72.9% of the variation in leaf traits in P. tomentosa and P. simonii, respectively (Supplemental Figure 1). For future analyses, we selected 35 and 27 PHMF-based leaf traits with >2% contribution to the leaf phenotypic variation in the top five principal components from P. tomentosa and P. simonii, respectively. In P. tomentosa, 420 of 595 (77.1%) PHMF-derived leaf traits were significantly correlated with each other (P < 0.01). Of 35 estimated coefficients of variation (CVs), 9 (25.7%) were >50% (Supplemental Data Set 2). Leaf traits 14, 19, 20, and 29–34 showed H2 >0.4 (Supplemental Data Set 2). In P. simonii, 252 of 351 (71.7%) PHMF-derived leaf traits were significantly correlated with each other (P < 0.01). Further, 10 of 27 (37.1%) estimated CVs of PHMF-derived traits were >50% (Supplemental Data Set 2). Leaf traits 14, 17–19, and 21–24 showed H2 >0.4 (Supplemental Data Set 2). TMLP traits including LL, LW, LA, LP, AR, AP, and PL were also determined in both populations (Supplemental Data Set 3). Only an average of approximately 4.7% PHMF-TMLP trait pairs were substantially correlated (Figure 2A and Supplemental Figure 2), suggesting that the PHMF-derived traits represent unknown morphological characteristics of poplar leaves. Except for leaf traits 29–32 in P. tomentosa and leaf traits 14, 17–19, and 21 in P. simonii, the leaf traits showed no significant differences among the three climate zones (Supplemental Tables 1 and 2).
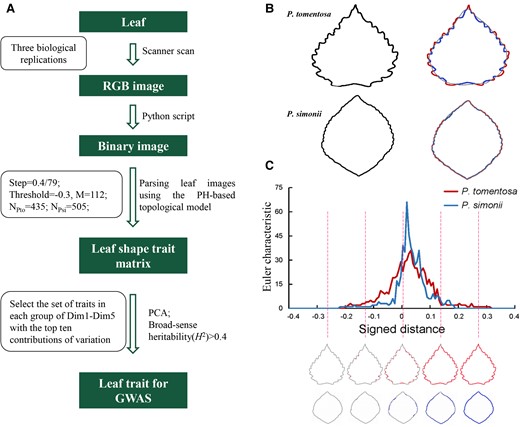
Persistent homology mathematical framework (PHMF) for leaf trait analysis. A, Flowchart showing the genetic basis of leaf morphological characteristics, as revealed by PHMF and topological methods. Important parameters are indicated in the box. B, Contour of P. tomentosa and P. simonii leaves. Plot of the signed distance function from the leaf contour to the elliptical Fourier descriptors; values outside the contour are positive and those inside the contour are negative. C, Euler curve showing Euler characteristic values according to the signed distance function. The number of components connected at the indicated locations (dashed lines) are shown in the curve. Euler characteristic represent the number of connected components minus the number of holes.
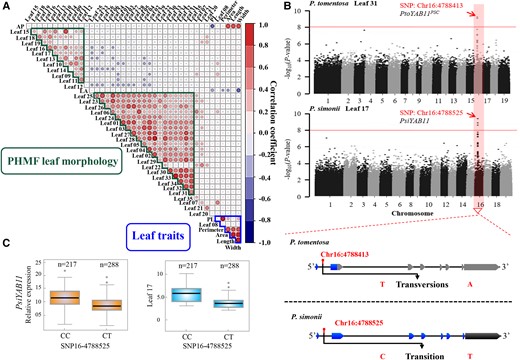
Identification of possible mechanisms underlying natural variation in leaf morphology. A, Correlations of 35 PHMF-based phenotypic values with six traditional multivariate leaf phenotype values in P. tomentosa. Color scale represents correlation coefficient. B, Manhattan plot displaying genome-wide association study (GWAS) results for the PHMF-based phenotypic values in 435 P. tomentosa and 505 P. simonii unrelated individuals. C, Genetic effect of PsiYAB11 (SNP16-4788525) on leaf traits and transcript abundance. The number of each genotype is given above the graph. Middle line indicates the median. Box shows the 5th to 95th percentiles. Whiskers indicate the interquartile range. Dots are outliers.
YAB11 gene SNPs associated with leaf morphology variation in Populus
All PHMF-derived leaf morphology traits with a high H2 value (>0.4) and normal distribution were analyzed (Supplemental Figure 3). In total, 161 significant associations were detected among 138 SNPs and 9 leaf morphology traits (P < 1.81 × 10⁻⁸) in P. tomentosa (Supplemental Data Set 4). The most significant association was to SNP16_4788413 for leaf 31 in the P. tomentosa population (P = 1.16 × 10⁻⁹) (Figure 2B). SNP16_4788413 is located in the first intron of the YAB11 gene. Gene cloning showed that the YAB11 gene carries a premature stop codon in P. tomentosa, which was defined as PtoYAB11 with a premature stop codon (PtoYAB11PSC). In the P. simonii population, eight leaf morphology traits were significantly associated with 171 SNPs (P < 7.65 × 10⁻⁸). Among the SNP-PHMF leaf morphology pairs, 161 SNPs were associated with a single trait and 10 SNPs showed pleiotropy (Supplemental Data Set 4). The most highly significant association was with SNP16_4788525 (P = 6.39 × 10⁻⁹) for leaf trait 17, which was also located in the first intron of the YAB11 gene (Figure 2B). SNP16_4788525, the SNP most significantly associated with leaf trait 17, showed high transcript abundance of the CC genotype, conferring higher levels of phenotype variation and expression (Figure 2C). Candidate gene cloning defined a YAB11 gene with a complete open reading frame in P. simonii as PsiYAB11. Combining the GWAS results for the P. tomentosa and P. simonii populations and potential functional annotation led to the selection of the YAB11 gene as a candidate for further analysis. Sanger sequencing results of candidate genes indicated that NGS-based resequencing is highly reliable (Supplemental Figure 4).
YAB gene family organization and phylogeny in Populus
YAB transcription factors have two conserved domains: a C2C2 zinc-finger-like domain and a YABBY domain (Supplemental Figure 5). In the P. simonii genome, the 12 members of the YAB gene family were divided into five subgroups: INNER NO OUTER (INO)-like, CRABS CLAW (CRC)-like, FILAMENTOUS FLOWER (FIL)-like, YAB2-like, and YAB5-like (Supplemental Figure 6A). The YAB2-like subgroup contains three members: PsiYAB2, PtsiYAB8, and PsiYAB11. In the P. tomentosa genome, INO-like, FIL-like, YAB5-like, and CRC-like subgroup organization was conserved in comparison with the P. simonii genome. The YAB2-like subgroup was further divided into two groups, with the mutated PtoYAB11PSC in a separate clade (Figure 3A). These results suggest that the mutation of PtoYAB11PSC substantially altered YAB2-like subgroup genome organization. In both poplar populations, three YAB gene family members (YAB4, YAB7, and YAB10) were associated with five PHFM leaf traits (Supplemental Data Set 4), suggesting that other YAB gene family members play synergistic roles in leaf morphological variation.
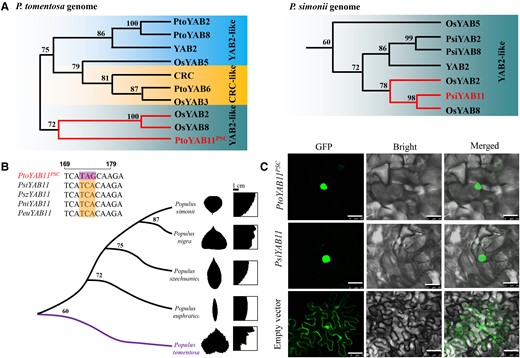
Nucleic acid sequence variation in poplar. A, Phylogenetic consensus tree of YAB2 group in the P. tomentosa and P. simonii genomes. The number on the branch represents the frequency parameter of the branch. B, Phylogenetic relationships of the poplar YABBY11 gene. Phylogenetic consensus tree was performed using the full-length protein sequences of YABBY11 from four subgenera of Populus, including Leuce (P. tomentosa), Aigeiros (P. nigra), Turanga (P. euphratica), and Tacamahaca (P. simonii and P. szechuanica). The number on the branch represents the frequency parameter of the branch. Bars, 1 cm. C, Subcellular localization of PtoYAB11 and PsiYAB11. Transient expression of 35S:PtoYAB11-GFP and 35S:PsiYAB11-GFP in Nicotiana benthamiana leaves is shown. Empty vector was used as a control. Bars, 20 μm.
The phylogenetic dendrogram of different subgenera of Populus constructed by the ML method formed two well-defined branches (Figure 3B). One branch contained only PtoYAB11PSC derived from P. tomentosa, and the other contained four YAB11 genes from P. simonii (PsiYAB11), Populus nigra (PniYAB11), Populus szechuanica (PszYAB11), and Populus euphratica (PeuYAB11). Sequence analysis revealed that DNA sequence identity ranged from 72% to 99%. A stop-gained variant was identified only at the 174-bp region of the second exon of PtoYAB11PSC (Figure 3B). It was also identified in Populus tremula, Populus alba, and P. alba × Populus glandulosa, which are the other members of Leuce and a hybrid, indicating that YAB11PSC may be a Leuce-specific variant (Supplemental Figure 6B). Subcellular localization analysis was performed to reveal the nuclear localization of PtoYAB11PSC-GFP and PsiYAB11-GFP, indicating that both PsiYAB11 and the truncated protein PtoYAB11PSC were located in the cell nucleus (Figure 3C). Gene expression patterns indicated that both PtoYAB11PSC and PsiYAB11 were expressed in the leaf margin and induced by drought, cold, heat, salt stress, auxin, GA, and 6-BA treatment (Supplemental Figures 7 and 8).
eQTN analysis of YAB11 in Populus
To further elucidate the regulatory network of PtoYAB11PSC and PsiYAB11, P. tomentosa and P. simonii population gene expression and genetic variants among all genes were subjected to eQTN analysis. In the P. tomentosa population, the analyses included 326 common SNPs (MAF > 0.05 and missing rate <20%) derived from PtoYAB11PSC and its flanking region (± 2,000 bp). A total of 32,073 gene transcripts were used as phenotypic variables in the eQTN analysis. A total of 97 unique SNPs were found to be significantly associated with the expression of 55 genes (P < 1.5 × 10⁻⁴). eQTNs were divided into cis-eQTNs and trans-eQTNs according to the distance between the SNP and the gene in question. In total, 42 cis-eQTNs were detected for 7 genes, and 65 trans-eQTNs were detected for 48 genes (P < 1.3 × 10⁻⁵; Supplemental Data Sets 5 and 6). Notably, PtoYAB4 expression levels were negatively associated with PtoYAB11PSC sequence variation (r = −0.79, P < 0.01; Supplemental Figure 9), suggesting that PtoYAB4 and PtoYAB11PSC have an antagonistic regulatory relationship.
In the P. simonii population, eQTN analyses included 217 common SNPs (MAF > 0.05 and missing rate <20%) derived from PsiYAB11 and its flanking region (± 2,000 bp). A total of 30,193 gene transcripts were used as the phenotypic variables in the eQTN analysis. A total of 61 unique SNPs were found to be significantly associated with the expression of 52 genes (P < 2.3 × 10⁻⁴). In total, 27 cis-eQTNs were detected for 10 genes and 44 trans-eQTNs were detected for 42 genes (P < 1.0 × 10⁻⁵; Supplemental Data Sets 7 and 8). Notably, the most highly significant associations were between PsiNGAL1 expression and SNP16_4792605 (trans-eQTNs, P = 7.98 × 10⁻³¹). For SNP16_4792605, the thymine (T) allele is the derived allele (A to T) that encodes a nonsynonymous mutation resulting in the replacement of a lysine (Lys) residue with an isoleucine (IIe) one. This mutation changed the sequences of the HMG box element. Thus, PsiNGAL1 may be a downstream target of PsiYAB11. However, none of the common genes were found in trans-eQTNs of PtoYAB11PSC and PsiYAB11, implying that the downstream regulatory networks of PtoYAB11PSC and PsiYAB11 have been substantially changed.
Genome-wide binding targets of YAB11 in Populus
PtoYAB11PSC lost its C2C2 zinc-finger-like domain and a YABBY domain, resulting in the loss of its DNA binding and transcriptional activation capacity. Next, PsiYAB11 was used to further identify potential genome-wide binding targets of YAB11 in poplar using DAP-seq. The average number of total clean sequencing reads was 21,825,083.3, with 97.4% reads mapped to the reference genome (Supplemental Table 3). In total, 220 PsiYAB11 binding sites were identified and 164 genes were annotated as target genes (Supplemental Data Set 9). The average PsiYAB11 binding site width was approximately 287.5 bp. PsiYAB11 binding sites were highly centered on target gene transcriptional start sites (TSS) (Supplemental Figure 10) and up to 60.9% overlapped with gene features (Figure 4A). Approximately 37.5% of PsiYAB11 binding sites were located in the promoter region 2.0 kb from the TSS. Kyoto Encyclopedia of Genes and Genomes (KEGG) pathway enrichment analysis of PsiYAB11 targets showed that the photosynthesis, oxidative phosphorylation, starch and sucrose metabolism, and ribosome pathways were significantly enriched (Supplemental Figure 11). Gene ontology (GO) enrichment analysis of PsiYAB11 targets showed that electron transport chain (GO: 0022900, P = 6.7 × 10⁻⁸) and transcription regulator activity (GO: 0030528, P = 2.1 × 10⁻⁶) were significantly enriched among molecular functions (Supplemental Table 4).
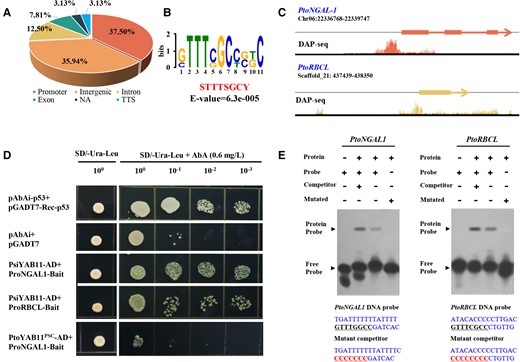
PtoYAB11PSC lost the ability to bind directly to downstream targets. A, Distribution of PsiYAB11 binding sites relative to gene features. B, Enriched DNA motif identified in PsiYAB11 binding sites. E values are shown. C, Integrative genomics viewer images of the PsiYAB11 DNA affinity purification sequencing (DAP-seq) read mapping to the promoters of the PtoRBCL and PtoNGAL-1 genes. D, Y1H assay showing loss of PtoYAB11PSC binding ability to PtoNGALs1 and PtoRBCL promoter fragments. Full-length constructs of PtoYAB11PSC and PsiYAB11 were fused to the GAL4 DBD and expressed in yeast strain AH109 Gold. Transformed yeast was grown in either SD/-Ura-leu-AbA, Trp, or SD/-Ura-leu + AbA media. pGAD-p53 + p53-pAbAi and pGADT7-Ad + Pro-PtoNGALs1–pAbAi were carried out in the same manner as for the positive and negative controls, respectively. E, Electrophoretic mobility shift assay (EMSA) of PtoYAB11 binding to DNA probes of the PtoRBCL and PtoNGAL-1 promoters in vitro. Free and bound DNA (arrows) were separated by acrylamide gel electrophoresis. Unlabeled probes were used as competitors, and mutated probes were produced by replacing the cis-regulating motifs with CCCCCCCC.
The genomic sequences (<700 bp) underlying binding sites with −log10P > 100 were used to identify putative motifs bound by PsiYAB11. Three significantly enriched motifs were identified, including “STTTSGCY” (E = 6.3 × 10⁻⁵), “AAWSAARAAAAA” (E = 3.4 × 10⁻³), and “ACRGGTTAAC” (E = 1.2 × 10⁻²) (Figure 4B). Among these motifs, “STTTSGCY” was only significantly enriched in trans-eQTNs of PsiYAB11(χ2 = 1.74, P < 1.2 × 10⁻³), implying that PtoYAB11PSC might have lost its capacity to regulate downstream target genes with the YAB11 cis-regulatory motif. DAP-PCR results showed that eight potential PsiYAB11 targets were amplified from input control and PsiYAB11 DAP samples, but not negative control samples (Supplemental Figure 12), supporting the specificity of the DAP-seq analysis (Figure 4C).
YAB11 binds directly to the NGAL1 and RBCL promoter and activates their transcription
The NGAL1, RBCL, PHOTOSYSTEM II REACTION CENTER PROTEIN B (PSBB), ATP SYNTHASE SUBUNIT ALPHA (ATPA), and ATP SYNTHASE EPSILON CHAIN (ATPE) genes were identified from our eQTN and DAP-seq analysis results as PsiYAB11 candidate downstream targets. Y1H assays and EMSA provided direct evidence that PsiYAB11 is specifically bound to the promoters of the PtoNGAL1 and PtoRBCL genes in vivo (Figure 4, D and E). By contrast, PtoYAB11PSC lost its capacity to regulate downstream target genes. A LUC assay was performed to validate the transcriptional regulation of YAB11 and NGAL1 in poplar. The results showed that both 35S::PsiYAB11 and 35S::PtoYAB4 were co-expressed with PtoNGAL1 promoters and induced a clear increase in luminescence intensity (Figure 5A), indicating that PsiYAB11 and PtoYAB4 are positive regulators of PtoNGAL1. By contrast, 35S::PtoYAB11PSC co-expressed with PtoNGAL1 promoters did not significantly alter luminescence intensity, revealing that PtoYAB11PSC had lost its transcriptional activation on downstream targets (Figure 5A). The LUC assay results also showed that PsiYAB11 is a positive regulator of PtoRCBL (Figure 5B).
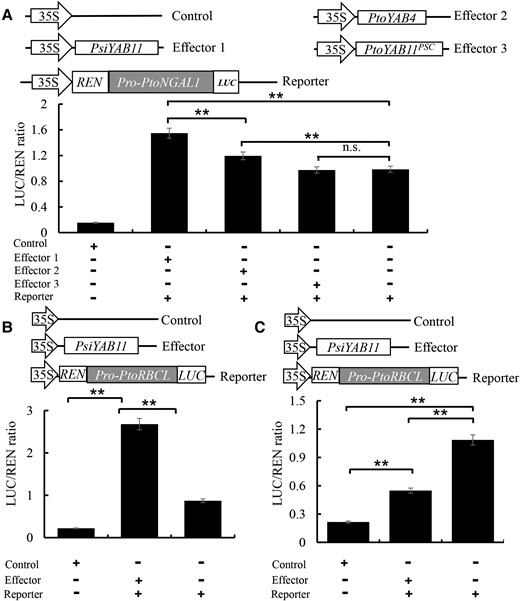
PtoYAB11PSC lost the ability to positively regulate downstream targets. A, Positive regulation of PtoNGALs1 by PsiYAB11 was assayed using the dual-LUC system. B, PsiYAB11 positive regulated PtoRBCL genes. C, Negative regulation of PtoCUC2 by PtoNGAL1 was assayed using the dual-LUC system. The data are means of three biological replicates; error bars represent the standard deviation (SD). Capital letters over each bar indicate significant difference as determined via one-way ANOVA at P < 0.01.
YAB11-NGAL1 module inhibits CUC2 gene expression regulating leaf traits
To further explore the molecular mechanism of YAB11-NGAL1 module function in leaf development, we performed assays to identify downstream targets of NGAL1. CUC2 has been reported as a downstream target of NGAL1 that plays an important role in leaf serration development (Nikovics et al., 2006; Shao et al., 2020). In this study, the expression of PtoNGAL1 and PtoCUC2 in the buds, cambium, and immature xylem of P. tomentosa was significantly negatively correlated (r = −0.72, P < 0.001) (Supplemental Figure 13).
Analysis of population genetic variation, gene expression and phenotypic variation were used to detect relationships of YAB11-NGAL1-CUC2 module transcript abundances and leaf margin variation. The possible genotypic combinations of significant SNPs of YAB11 for the leaf margin variation and NGAL1 gene transcript abundances were identified. SNP-Chr16:4788525 and SNP-Chr16:4792605 had six possible common genotypic combinations (frequency ≥ 5%, P < 0.01). The CC-AA combinations at the two candidate SNPs represent the maximum transcript abundances of YAB11-NGAL1 module and leaf traits, respectively (Supplemental Figure 14). In contrast, CUC2 transcript abundance was lowest within the CC-AA genotype context. These results indicated that CUC2 transcript abundances are associated with leaf margin variation and might be repressed by NGAL1 in poplar. It is indicated that the YAB11-NGAL1-CUC2 module has a function in leaf trait regulation in poplar. Then, CUC2 was selected as a potential target of NGAL for additional Y1H assays. The Y1H results confirmed that NGAL1 is specifically bound to the promoters of CUC2 in poplar (Supplemental Figure 15). 35S::PtoNGAL1 co-expressed with PtoCUC2 promoters led to significantly decreased luminescence intensity, suggesting that PtoNGAL1 is a negative regulator of PtoCUC2 (Figure 5C).
Overexpression of PsiYAB11 causes smooth leaf margins
To assess the potential biological functions of YAB11 in leaf morphology regulation, transgenic P. tomentosa lines overexpressing PtoYAB11PSC and PsiYAB11 were generated (Supplemental Figure 2). In total, three PtoYAB11PSC-overexpressing (OE #11, #19, and #28), three PtoYAB11PSC-knockout (KO, #4, #14, and #17), and three PsiYAB11-OE lines (#4, #11, and #16) were identified (Supplemental Figure 16). Regarding leaf morphology, the LL, LW, LP, and LA were markedly reduced in PsiYAB11-OE compared to the wild-type. By contrast, PtoYAB11PSC-OE showed substantially increased LL, LW, LP, and LA and highly serrated leaf margins (Figure 6, A and B). PtoYAB11PSC-OE also showed substantially larger abaxial stomata, leaves, ground diameter (stem diameter near the ground), and height. Overexpression of PsiYAB11 and the knockout of PtoYAB11PSC in P. tomentosa resulted in smooth leaf margins (Figure 6A). Surprisingly, adaxial stoma also appeared in PsiYAB11-OE seedlings (Figure 6C). Overexpression of PsiYAB11 reduced seedling height, ground diameter, and leaf vein thickness, and increased stomatal density (Figure 6D and Supplemental Figure 17). Given the essential role of photosynthesis in leaf and plant development, detailed photosynthesis and fluorescent analyses were performed. PtoYAB11PSC-OE seedlings showed significantly higher Pn, Gs, FV/FM, Fv/Fo, and FV’/FM’ values compared with the other samples. iWUE, LEF, NPQ, and qL were also significantly induced in PsiYAB11-OE samples (Figure 7A). YII, YNPQ, YNO, ECSt, vH+, and gH+ did not differ significantly among the WT, PtoYAB11PSC, and PsiYAB11-OE samples (Supplemental Table 5). Photosynthesis and leaf size did not differ significantly between PtoYAB11PSC-KO and WT samples.
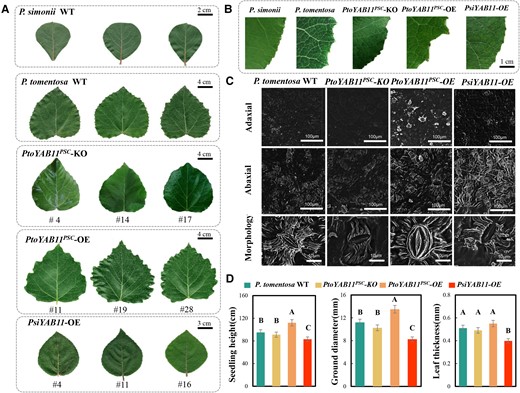
Overexpression of PtoYAB11PSC positively regulates serrated leaf margins and photosynthesis. A, Overexpression of PtoYAB11PSC leading to serrated leaf margins in P. tomentosa. B, Detailed view of serrated leaf margins in PtoYAB11PSC-overexpressing (OE) seedlings. C, Stomatal size and stomatal density in wild-type (WT), PtoYAB11PSC-OE, PtoYAB11PSC-KO, and PsiYAB11-OE seedlings. D, Growth traits of WT, PtoYAB11PSC-OE, PtoYAB11 PSC-KO, and PsiYAB11-OE seedlings. Data are the means of three biological replicates; error bars represent SDs. Capital letters over each bar indicate significant difference as determined via one-way ANOVA at P < 0.01.
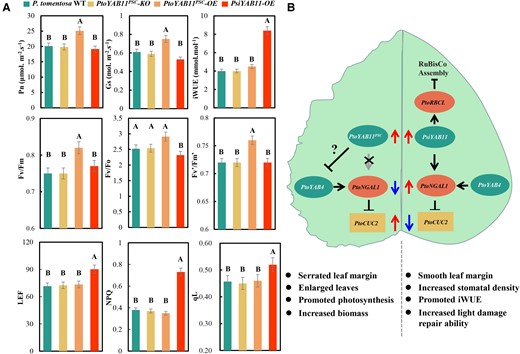
Schematic diagram of PtoYAB11PSC-PtoNGAL1 module involvement in serrated leaf margins. A, Comparison of photosynthesis and chlorophyll fluorescence parameters among WT, PtoYAB11PSC-OE, PtoYAB11PSC-KO, and PsiYAB11-OE P. tomentosa seedlings. Pn, net photosynthesis rate; Gs, stomatal conductance; iWUE, intrinsic water use efficiency; Fv, variable fluorescence in the dark-adapted state; Fm, maximum fluorescence in the dark-adapted state; Fo, minimum fluorescence in the dark-adapted state; Fv’, variable fluorescence in the light-adapted state; Fm’, maximum fluorescence in the light-adapted state; LEF, linear electron transport; NPQ, non-photochemical quenching; and qL, photochemical quenching (lake model). B, Schematic diagram of the PtoYAB11PSC-PtoNGAL1 module that leads to serrated leaf margins. Data are means ± standard error (n = 3). Capital letters over each bar indicate significant difference as determined via one-way ANOVA at P < 0.01.
Discussion
PHMF enhanced our GWAS of Populus leaf morphology
In previous studies, LW, LA, LL, and LR were measured for genetic regulator mapping (Drost et al., 2015; Chhetri et al., 2019). However, these traits are unsuitable for multidimensional morphometric analyses of plant morphology and features. Landmarks, pseudo-landmarks, and EFDs have also been used to assess plant morphology (Chitwood and Topp, 2015; Chitwood et al., 2014; Fu et al., 2017). The combination of these accurate high-throughput leaf morphological feature analyses greatly improves the accuracy of leaf morphological regulator identification. In this study, 112 leaf traits representing Populus leaf morphology were obtained using PHMF, which allowed us to identify previously unknown morphological characteristics of Populus leaves, substantially extending genotype–phenotype association analysis in Populus. However, this approach provides another major challenge for future studies, in interpreting the biological importance of these unknown morphological characteristics. Although accurate high-throughput leaf morphological feature analysis is a powerful tool for analyzing leaf morphology, it does not guarantee a positive outcome in core regulator mapping. In P. tremula, leaf size and shape metrics obtained by LAMINA were used for additional GWAS. The results showed that leaf shape traits of P. tremula were likely determined by numerous small-effect variations (Mähler et al., 2020). Heterochrony and heterophylly are two key features to consider for future study. Heterochrony refers to age-dependent variation in leaf development, whereas heterophylly may depend on local adaptation (Li et al., 2022). It is indicated that functional mapping of multiple locations over many years is of great importance for further candidate gene mapping in relation to leaf morphology.
PtoYAB11PSC truncated protein loses its ability to modulate NGAL1 expression
eQTN mapping is a powerful tool for understanding complex regulatory networks (Zhang et al., 2018). A common example of a trans-acting eQTN is a TF showing expression polymorphism that regulates downstream transcript targets (Hansen et al., 2008). SNP16_4792605 is associated with NGAL1 transcript levels in P. simonii. SNP16_4792605, located in the HMG box of PsiYAB11, has a DNA binding domain that binds only non-B-type DNA conformations (kinked or unwound) with high affinity (Xin et al., 2000; Shamimuzzaman and Vodkin, 2013). In our study, PsiYAB11 regulated the expression of its downstream target NGAL1 through its DNA binding domain in P. simonii. PtoYAB11PSC truncated protein was lost in the HMG box element, leading to a loss of ability to modulate its downstream target NGAL1 in P. tomentosa.
In Arabidopsis, NGALs act as negative regulators of leaf margin serration (Alvarez et al., 2009; Trigueros et al., 2009). NGAL1 can bind directly to the CUC2 promoter, repressing CUC2 expression (Shao et al., 2020). Repressed CUC2 expression leads to smooth leaf margins, suggesting that they promote leaf margin outgrowth and serration formation (Nikovics et al., 2006; Hasson et al., 2011). Our results also indicated that PsiCUC2 transcript abundance was substantially associated with leaf margin variation. In this study, PsiYAB11, with a complete HMG box element, is an upstream regulator of the NGAL-CUC2 module. Overexpression of PsiYAB11 induced NGAL1 gene expression and repressed CUC2 transcript abundance, resulting in smooth leaf margin.
In P. tomentosa, PtoYAB11PSC truncated protein lost the ability to promote NGAL1 expression, leading to increased CUC2 transcript expression and serrated leaf margins. Furthermore, auxin has been reported to be an important regulator of leaf margin morphogenesis through negative regulation of CUC2 expression by activating miRNA164a (Bilsborough et al., 2011). In this study, PsiYAB11 and PtoYAB11PSC were both induced by auxin treatment, indicating that the YAB11-NGAL1-CUC2 module is responsive to auxin. These findings suggest that YAB11-NGAL1-CUC2 transcript regulation is complementary to auxin-responsive post-transcriptional regulation of leaf margin morphogenesis.
PtoYAB11PSC repressed PtoYAB4 transcript abundance, promoting serrated leaf margins
YAB genes play an important role in lamina outgrowth, cell polarity maintenance, and leaf margin establishment (Chen et al., 1999; Watanabe and Okada, 2003; Finet et al., 2016). Genes in the FIL-like, YAB2-like, and YAB5-like subgroups, which are expressed in cotyledons, leaves, and floral organs, are considered to be candidate genes for vegetative development (Golz et al., 2004; Bartholmes et al., 2012). In this study, YAB11 was significantly associated with Populus leaf margin traits (P = 1.16 × 10⁻⁹) (Figure 2). Premature termination occurred in the second exon of PtoYAB11PSC, resulting in loss of the zinc finger and YABBY domain (Figure 3). Our results indicated that PtoYAB11PSC had lost its trans-acting capacity as a TF. However, PtoYAB11PSC remained located in the nucleus (Figure 3D), suggesting that premature termination trimmed the open reading frame of PtoYAB11PSC, which was still transcribed and translated. Inactive protein-coding genes are typically categorized as pseudogenes (ψs) (Balasubramanian et al., 2009; Xie et al., 2019). Although most ψs are inactive copies of protein-coding genes, a small fraction of ψs produce regulatory RNAs that are involved in various fundamental processes (Guo et al., 2009; Wen et al., 2011). PtoYAB4 transcript abundance was negatively associated with PtoYAB11PSC sequence variation. We speculated that PtoYAB11PSC might negatively regulate the PtoYAB4 through post transcription regulation. PtoYAB4 activated PtoNGAL-1 expression and positive regulation of leaf trait 31. Overexpressed PtoYAB11PSC interferes with the transcription abundance of the PtoYAB4-PtoNGAL-1 module and promotes CUC2 gene transcription, resulting in serrated leaf margins in poplar.
The YAB11 bridge environment signals leaf morphological plasticity
The YAB gene family is reported to be involved in diverse developmental processes in plants (Zhang et al., 2022), and also in responses to various environmental signals. In soybean (Glycine max), 70.5%, 35.2%, and 58.8% of YAB members were subjected to drought, NaCl, and ABA treatments (Zhao et al., 2017); GmYAB10 overexpression reduced the survival rate of soybean under polyethylene glycol and NaCl treatments, indicating that GmYAB10 is a negative regulator of plant resistance to drought and salt stress (Zhao et al., 2017). Overexpression of AcYAB4 shortened the root length of Arabidopsis in response to NaCl treatment, indicating that AcYAB4 also plays a negative regulatory role in plant resistance to salt stress (Li et al., 2019). Our results showed that both PtoYABPSC and PsiYAB11 were induced by heat, cold, salt, and drought stress, indicating sensitivity to these environmental signals in poplar. In Capsella rubella, RCO expression in response to environmental temperature changes resulted in phenotypic plasticity (Sicard et al., 2014). In the present study, PtoYAB11PSC played a core regulatory role in P. tomentosa leaf margin serration, and was sensitive to various environmental signals, suggesting its importance in the genotype–environment interactions involved in phenotypic plasticity.
Our results showed that RBCL genes are downstream targets of YAB11 in poplar. RBCL encodes a large subunit of ribulose-1, 5-bisphosphate carboxylase/oxygenase (Rubisco), which plays a key role in photosynthetic CO2 fixation. Expression of the Rubisco large and small subunits should be tightly coordinated to ensure successful assembly. Excessive accumulation of RBCL results in rapid degradation of the unassembled RBCS, inhibiting chloroplast development (Cohen et al., 2005). In P. tomentosa, mutated PtoYAB11PSC lost positive regulation of the RBCL gene, possibly influencing the tight coordination of large and small subunit expression and resulting in photosynthesis promotion and biomass accumulation. Leaf vein density and thickness are associated with hydraulic conductance and photosynthesis in rice (Tabassum et al., 2016). Our results showed that PsiYAB11 overexpression reduced leaf vein thickness, which may also result in photosynthesis reduction. Stomatal density and stomatal movements are important regulators of WUE in plants (Lawson and Blatt, 2014). Changes in leaf stomatal density are dependent on variations in stomatal development and epidermal cell size (Guo et al., 2019). Our results showed that PsiYAB11 overexpression resulted in a decreased leaf area, which may be the main reason for the observed increase in stomatal density. Higher stomatal density results in accelerated water loss and WUE reduction (Yu et al., 2008). In this study, PsiYAB11-OE showed a substantially higher stomatal density and substantially lower Gs, suggesting that limited stomatal movement contributes to WUE promotion in PsiYAB11-OE. By contrast, overexpression of PtoYAB11PSC led to enlarged stomatal size and Gs, which may be the main reason for iWUE reduction. In another study, iWUE was determined in various leaf locations; the tip and base of the leaf had the highest and lowest WUE, respectively (Kirkham, 2005). Overexpression of PtoYAB11PSC affected leaf morphology (LL, LW, perimeter, and leaf margin serration) in our study. We speculate that these changes in leaf morphology also contribute to iWUE regulation, providing evidence for the adaptive importance of leaf margin morphology.
In this study, we provided evidence that PtoYAB11PSC lost positive regulation of its downstream target PtoNGAL1 and repressed PtoYAB4 expression, promoting leaf margin serration. PtoYAB11PSC also lost positive regulation of PtoRBCL, which is the core component of the light reaction, resulting in P. tomentosa photosynthesis induction. PtoYAB11PSC was induced by environmental and phytohormone signaling. Thus, we revealed a mechanism involved in controlling leaf morphology and provided a candidate module for the genetic improvement of poplar yield and environmental adaptation.
Materials and methods
Plant materials for DNA and RNA extraction
We collected 435 unrelated poplar (P. tomentosa) individuals from throughout its natural distribution in China (Du et al., 2012), including 10 provinces (Shandong, Beijing, Hebei, Henan, Gansu, Anhui, Jiangsu, Shanxi, Shaanxi, and Ningxia), covering an area of 1 million km2 (Supplemental Figure 18). We collected 505 unrelated poplar (P. simonii) individuals from throughout its natural distribution range in China, including 10 provinces (Jilin, Inner Mongolia, Shandong, Beijing, Hebei, Gansu, Sichuan, Qinghai, Shanxi, and Shaanxi), covering an area of 2 million km2 (Supplemental Figure 1). All samples were planted with three clonal replicates in a clonal arboretum in a randomized complete block design (3 m × 4 m spacing) in Guanxian, Shandong Province (36°29′89″N, 115°27′34″E). We subjected 1-year-old P. tomentosa “1316” clones of the same height (∼50 cm) to abiotic stress, phytohormone treatments, and tissue-specific gene expression analysis (Supplemental Methods 1). The leaf plastochron index (LPI) was used to distinguish leaf development (Taylor et al., 2003). For P. tomentosa and P. simonii population expression variation analysis, mature leaves (LPI 7) were collected from all samples and frozen in liquid nitrogen.
PHMF for leaf morphology analysis
Five mature leaves (LPI 7) were sampled from each of three replicate clonal copies of each genotype and individually imaged using a CanoScan LIDE300 scanner (Canon, Tokyo, Japan). Binary images of the leaves were made using a Python script (available upon request). EFDs were used to approximate leaf contours (Iwata and Ukai, 2002). EFDs decompose the contour into a weighted sum of wave functions with different frequencies (Supplemental Methods 2). The Euler characteristic and EFD approximation were used to quantify leaf serrations. PHMF analyses were performed using the MATLAB software (MathWorks, Inc., Natick, MA, USA), and the R (R Development Core Team, Vienna, Austria) packages factoextra and FactoMineR were used for principal component analysis (PCA) mapping (Kassambara and Mundt, 2017). Image J software (National Institutes of Health, Bethesda, MD, USA) was used to measure traditional multivariate leaf phenotype (TMLP) traits, including LL, LW, LA, leaf perimeter (LP), aspect ratio (AR), area perimeter ratio (AP), and perimeter length ratio (PL).
GWAS of PHMF leaf morphology-related traits
Broad-sense heritability (H2) for each phenotype was estimated using the multiBLUP tool with a power of 0.25; the calculated significance thresholds were P1 = 1 × 10⁻⁴ and P2 = 0.05 for the whole population (Speed and Balding, 2014). All 940 Populus accessions (N = 435 for P. tomentosa and N = 505 for P. simonii) of the association population were sequenced, with an average of 15× (raw data) coverage using the Illumina GA2 sequencing platform (Illumina, San Diego, CA, USA). Clean reads were mapped to the Populus reference genome v3.0 and the SNP calling pipeline was executed as described previously (Xiao et al., 2020). In total, 2,757,176 and 1,305,980 SNPs [minor allele frequency (MAF) >5%; missing rate <20%] were derived in the P. tomentosa and P. simonii populations, respectively. The SNP diversity was 0.0054 and 0.0047 for the P. tomentosa and P. simonii populations, respectively (Supplemental Table 6). A mixed linear model (MLM) was implemented using TASSEL 5.2 software (Bradbury et al., 2007) to analyze associations between whole-genome SNPs and leaf morphology-related traits. To control for possible confounding effects of population structure (Q) and pairwise kinship (K), both were included in the MLM. The optimal substructure results (K = 3 for P. tomentosa and K = 4 for P. simonii) were assessed using a previously described statistical model (Du et al., 2012; Song et al., 2020). Significance was defined as P ≤ 1.81 × 10⁻⁸ for P. tomentosa (P < 0.05/n, n = 2,757,176) and P ≤ 7.65 × 10⁻⁸ for P. simonii (P < 0.05/n, n = 1,305,980) based on Bonferroni correction. Sanger sequencing was used to validate candidate SNPs (Supplemental Methods 3).
RNA-sequencing and eQTN mapping
Leaves from all 940 poplar accessions (LPI 7) were used for cDNA library construction and sequencing, performed by Beijing Biomarker Technology (Beijing, China) (Supplemental Methods 4). Raw sequencing reads were mapped to the P. trichocarpa reference genome v3.0 using the HISAT2 program (Kim et al., 2015). Expression levels were calculated in terms of fragments per kilobase of transcript per million fragments (FPKM) using the Cuffquant and Cuffnorm tools (Trapnell et al., 2012). Transcripts expressed in >80% of each population were selected for eQTNs analysis (Supplemental Methods 5). The linear regression mode of the Matrix eQTNs package was used to identify associations between SNPs derived from the PtoYAB11PSC and PsiYAB11 genes (± 2,000 bp flanking region) and the expression levels of genome-wide genes (Shabalin, 2012). Bonferroni correction was applied for multiple comparisons (P < 1.0 × 10⁻⁵) to control for genome-wide false positives. All eQTNs located within a 104-bp area around the transcription start site (TSS) of targets were regarded as cis-eQTNs, and all other eQTNs were regarded as trans-eQTNs (Quan et al., 2019).
Poplar YAB gene family identification and phylogenetic analysis
All YAB gene family member sequences were cloned from P. tomentosa “1316” and P. simonii “QL9”. YAB11 gene sequences were also cloned from P. simonii, P. nigra, P. szechuanica, and P. euphratica. The amino acid sequences of the Arabidopsis (A. thaliana) and rice (Oryza sativa) YABBY gene families were acquired from the Phytozome portal (https://phytozome.jgi.doe.gov/). Clustal X 2.0 (Larkin et al., 2007) and MUSCLE (Edgar and Myers, 2005) were used to align the YABBY protein sequences to identify the YABBY and zinc-finger domains. For phylogenetic analysis, Clustal W software (Kumar et al., 2016) was used to align full-length YABBY sequences from rice to poplar (Supplemental Methods 6).
Subcellular localization and tissue expression patterns
The full-length coding sequences of PsiYAB11 and PtoYAB11PSC were cloned into the pBI121 vector to generate green fluorescent protein (GFP) fusion constructs driven by the 35S promoter. The promoter of PtoYAB11PSC was cloned into the pCAMBIA1301 vector to drive β-glucuronidase (GUS) expression. Then, 35S:PsiYAB11-GFP, 35S:PtoYAB11PSC-GFP, and ProPtoYAB11PSC:GUS were transiently expressed in tobacco (Nicotiana benthamiana) leaves. The fluorescence signal was observed in N. benthamiana leaves with three biological repeats using confocal laser scanning microscopy (C2-ER; Nikon, Tokyo, Japan) 2 days after transformation (Supplemental Methods 7).
GFP was excitative by 488 nm solid-state laser. fluorescence was detected at 498–535 nm and the intensity and gain were 11.9% and 800, respectively.
DNA affinity purification sequencing (DAP-seq) and data processing
Five micrograms of P. tomentosa genomic DNA (gRNA) was fragmented to an average of 200 bp and used for DNA-seq library construction. PsiYAB11 protein was expressed using the TNT SP6 Coupled Wheat Germ Extract System (Promega, Madison, WI, USA). The protein-bound beads were incubated with 50 ng of adaptor-ligated gDNA fragments on a rotator for 1 h at room temperature. After the protein was denatured and the bound DNA fragments were released, eluted DNA fragments were sequenced on an Illumina NavoSeq system. Reads were mapped to the P. trichocarpa reference genome v3.0 using the HISAT2 program (Kim et al., 2015). DAP-seq peaks, which indicate transcription factor binding sites, were called by the MACS2 tool coupled with the IDR pipeline (Zhang et al., 2008). Motif discovery was performed using MEME-Chip suite v5.0.5 (Machanick and Bailey, 2011) (Supplemental Methods 8).
Stomatal density and size measurement
Stomatal morphological characteristics were measured by scanning electron microscopy (Hitachi S-3400 N II, Tokyo, Japan). Two small pieces were cut from leaves of each genotype between the midrib and leaf margin. One piece was used for adaxial observation and the other for abaxial observation. Observations were made at ×320–4,000 magnification. Five randomly selected fields of the leaf surface were recorded. Stomata counting and density calculation were performed as described previously (Pearce et al., 2006) (Supplemental Methods 9).
Transient transcription dual-luciferase (LUC) assay
The PtoNGAL1, PtoCUC2, and PtoRBCL promoters were amplified from P. tomentosa “1316” and cloned into the modified pGreenII 0900 vector containing the firefly luciferase (fLUC) gene and the Renilla luciferase gene (rLUC) as reporters, and PsiYAB11, PtoYAB11PSC, and PtoNGAL1 cDNAs were cloned into the pBI121 expression vector to construct an effector. Plasmids were transferred into Agrobacterium tumefaciens GV3101 by electroporation and coinfiltrated into N. benthamiana leaves. Luciferase activity was measured using the Dual Luciferase Reporter Assay System (Promega) according to the manufacturer’s instructions. Relative reporter gene expression levels were expressed as the ratio of fLUC to rLUC. Six independent transformations of each sample were performed (Supplemental Methods 10).
Yeast one-hybrid (Y1H) and electrophoretic mobility shift assays (EMSA)
The PsiYAB11, PtoYAB11PSC, and PtoNGAL1 genes were cloned into the pGADT7-rec vector (Clontech, Mountain View, CA, USA) with the GAL4 activation domain. The promoters of PtoNGAL1, PtoCUC2, and PtoRBCL were inserted into a pAbAi-BR yeast-integrating vector (Clontech), which was used as a bait-reporter construct. pGADT7-PsiYAB11, pGADT7-PtoYAB11PSC, pGADT7-PtoNGAL1, and pAbAi-Pro (PtoNGAL1, PtoCUC2, and PtoRBCL) were co-transformed into the Y1HGold yeast strain using a Matchmaker One-Hybrid Library Construction and Screening Kit (Clontech). The full-length CDS of PsiYAB11 was inserted into the pCzn1 vector (Zoonbio, Nanjing, China) to produce recombinant PsiYAB11 in Escherichia coli BL21. The His-PsiYAB11 fusion protein was purified using PureCube Ni-NTA Agarose (Cube Biotech, Monheim, Germany). Reactions were incubated at 25°C for 30 min after adding 2 mg of protein from the His purification eluate. The primers and probes used for these analyses are listed in Supplemental Table 7 (Supplemental Methods 11).
Overexpression and knockout of PtoYAB11PSC in P. tomentosa
The coding sequences of PsiYAB11 and PtoYAB11PSC were cloned into the pBI121 vector driven by a 35S promoter, and introduced into Agrobacterium GV3101 (Supplemental Figure 2). The CRISPR-Cas9 system was used to construct a PtoYAB11PSC knockout mutant in poplar with a Viewsolid Biotech Cas9/gRNA Kit (VK005-14). CRISPR-P 2.0 (http://crispr.hzau.edu.cn/) was used to identify potential target sites in the candidate genes. One gRNA was selected for each gene and inserted into the Cas9/gRNA vector using the Gateway system (Supplemental Figure 2). All primers for plasmid construction and reverse transcription quantitative PCR (RT-qPCR) are listed in Supplemental Table 7. Agrobacterium with the overexpressed vector was used to infect P. tomentosa “1316” leaf discs. Six transgenic P. tomentosa shoots were cut into 0.2–0.3-cm pieces and transferred to proliferation medium. Data were obtained from at least three transgenic lines and a wild-type (WT) line showing a stable phenotype. The height, ground diameter, and leaf morphology traits of all samples were measured at 120 days after the plants were transferred into plots (Supplemental Methods 12).
Chlorophyll fluorescence-based probes of photosynthetic parameters
The sixth fully expanded leaves of transgenic P. tomentosa “1316” were used for photosynthetic rate measurements and chlorophyll fluorescence analysis. Three independent biological clones were analyzed for each genotype. Photosynthetic rates were measured using a portable photosynthesis system (LI-6400XT; Li-Cor Biosciences, Lincoln, NE, USA) from 9:00 to 11:00 on August 15, 2020. The net photosynthetic rate (Pn), transpiration rate (Tr), intercellular CO2 concentration (Ci), and stomatal conductance (Gs) were measured simultaneously. Intrinsic water use efficiency (iWUE) was calculated from the ratio of Pn to Tr. Chlorophyll fluorescence parameters were estimated using a MultispeQ instrument (Photosynq, East Lansing, MI, USA) with pulse amplitude modulation (PAM) fluorometry (Baker et al., 2007). Variable fluorescence in the dark/light-adapted state (FV, FV’), maximum fluorescence in the dark/light-adapted state (FM, FM’), minimum fluorescence in the dark-adapted state (Fo), linear electron transport (LEF), quantum yield of non-photochemical quenching (NPQ), photochemical quenching (qL), yield of photochemistry (YII), yield for dissipation by downregulation (YNPQ), yield of other non-photochemical losses (YNO), electrochromic shift on rapid light/dark transition (ECSt), ATP synthase activity (gH+), and the steady-state rate of proton flux (vH+) were measured (Supplemental Methods 13).
Statistical analyses
All data analyses were performed using R software. One-way analyses of variance of fluorescence intensity and phenotypic values were performed using R, and significant differences between groups were evaluated following Bonferroni correction. The data of candidate gene expression and phenotypic values of transgenic poplar were analyzed via one-way ANOVA (P < 0.01). The values are presented as the mean ± standard deviation (SD) of biological triplicates. The correlation between PtoNGAL1 and PtoCUC2 gene expression was determined according to the correlation coefficient, at a significance level of P < 0.05.
Accession numbers
All transcriptome expression data (three biological replicates for each group) reported here are available from NCBI with the SRA database accession numbers PRJNA521819, PRJNA521855, PRJNA522886, PRJNA522891, PRJNA357670, SRP141094, SRP073689, and SRP060593. The raw data of genome sequencing have been deposited in the Genome Sequence Archive in the BIG Data Center (BIG, CAS, China) under accession numbers CRA000903 (https://bigd.big.ac.cn/). Euler characteristic curves for leaf serration used in this manuscript can be found at the following GitHub repository: https://github.com/maoli0923/Persistent-Homology-Tomato-Leaf-Root.
Supplemental data
The following materials are available in the online version of this article.
Supplemental Figure S1. Principal component analysis (PCA) analysis of persistent homology mathematical framework (PHMF)-based leaf morphology features.
Supplemental Figure S2. Correlations of 27 persistent homology mathematical framework (PHMF)-based phenotypic values with 6 “traditional multivariate leaf phenotype” (TMLP) values in P. simonii.
Supplemental Figure S3. Data distribution diagram of 17 of PHMF-based phenotypic values in poplar population.
Supplemental Figure S4. SNP validation by sanger sequencing. The second exon of PtoYAB11PSC was validated in the resequencing dataset.
Supplemental Figure S5. The gene structures of YABBY family genes in poplar.
Supplemental Figure S6. ML tree analysis and sequence alignment of YAB11.
Supplemental Figure S7. YAB11 leaf margin specific expression in poplar.
Supplemental Figure S8. Gene expression profiles of YABBY genes in response to different abiotic stress and phytohormone treatments.
Supplemental Figure S9. Genetic effect of PtoYAB11PSC (SNP16-4788413) on PtoYAB11PSC and PtoYAB4 transcript abundances.
Supplemental Figure S10. Genome-wide distribution of PsiYAB11 binding sites is centered on gene transcriptional start sites (TSS).
Supplemental Figure S11. KEGG enrichment of PsiYAB11 downstream targets.
Supplemental Figure S12. DAP-PCR verification of representative binding sites.
Supplemental Figure S13. Correlation analysis of PtoNGAL1 and PtoCUC2 gene expression in P. tomentosa population.
Supplemental Figure S14. The six possible genotypic combinations with a frequency of >5%, and their combined effects on PsiNGAL1 and PsiCUC2 transcript abundance and leaf traits in the P. simonii association population.
Supplemental Figure S15. Y1H assay showing loss of the ability of PtoNGAL1 to binding to PtoCUC2-2 promoter fragments.
Supplemental Figure S16. PCR validation and gene expression analysis of wild type, PtoYAB11PSC-OE, and PsiYAB11-OE samples.
Supplemental Figure S17. Leaf morphology, stomatal size, and stomatal density in wild-type (WT), PtoYAB11PSC-OE, PtoYAB11PSC-KO, and PsiYAB11-OE seedlings.
Supplemental Figure S18. Geographic location of each individual of P. tomentosa and P. simonii used for nucleotide nature variation analysis.
Supplemental Table S1. Descriptive statistics for PHMF leaf traits measured in three climatic regions of P. tomentosa.
Supplemental Table S2. Descriptive statistics for PHMF leaf traits measured in three climatic regions of P. simonii.
Supplemental Table S3. DAP-seq data mapping information.
Supplemental Table S4. Gene ontology term enrichment analysis of PsiYAB11 downstream targets.
Supplemental Table S5. Phenotype of overexpressed PtoYAB11 and PsiYAB11 in P. tomentosa.
Supplemental Table S6. Per-site nucleotide diversity estimated across genome for all annotated features of the P. tomentosa and P. simonii genome.
Supplemental Table S7. Primers used for this study.
Supplemental Methods S1. Plant materials for DNA and RNA extraction.
Supplemental Methods S2. Persistent homology mathematical framework for leaf morphology analysis.
Supplemental Methods S3. PHMF leaf morphology-related traits: Results of GWAS.
Supplemental Methods S4. RNA-sequencing and gene expression analysis.
Supplemental Methods S5. eQTNs mapping.
Supplemental Methods S6. Poplar YABBY (YAB) gene family identification and phylogenetic analysis.
Supplemental Methods S7. Subcellular localization.
Supplemental Methods S8. DNA affinity purification sequencing (DAP-seq) and data processing.
Supplemental Methods S9. Stomatal densities and size measurement.
Supplemental Methods S10. Transient transcription dual-luciferase (LUC) assay.
Supplemental Methods S11. Yeast one-hybrid (Y1H) assays.
Supplemental Methods S12. Overexpressed PsiYAB11 and PtoYAB11 in P. tomentosa.
Supplemental Methods S13. Chlorophyll fluorescence-based probes of photosynthetic parameters.
Supplemental Data Set S1. PH-based leaf shape traits in Populus population.
Supplemental Data Set S2. Variable coefficient and broad-sense heritability of PH-based leaf trait.
Supplemental Data Set S3. Traditional leaf shape traits in Populus population.
Supplemental Data Set S4. Association results identified using nine PH-based leaf trait.
Supplemental Data Set S5. The reported cis-eQTL of P. tomentosa population.
Supplemental Data Set S6. The reported trans-eQTL of P. tomentosa population.
Supplemental Data Set S7. The reported cis-eQTL of P. simonii population.
Supplemental Data Set S8. The reported trans-eQTL of P. simonii population.
Supplemental Data Set S9. Annotation of PsiYAB11 targets.
Funding
This work was supported by the State “14.5” Key Research Program of China (No. 2021YFD2200101), the Project of Youth talent program of Forestry and grassland Science and Technology Innovation (No. 2020132606), the Project of the National Natural Science Foundation of China (No. 31770707) and the 111 Project (No. B20050).
Acknowledgments
The authors would like to thank Pro. Nathaniel Street from the Umeå plant science center for providing constructive suggestion. We are grateful for the sequence information produced by the U.S. Department of Energy Joint Genome Institute (http://www.jgi.doe.gov).
References
Author notes
Peng Liu and Chenhao Bu contributed equally to this work.
Senior author.
Y.S. conceived and designed the experiments. P.L. carried out the gene expression analysis and drafted the manuscript. D.Z. and Y.E. assisted with the writing. P.F., L.Z., and C.B. performed the RNA extractions and participated in the statistical analyses. All authors read and approved the final manuscript.
The author responsible for distribution of materials integral to the findings presented in this article in accordance with the policy described in the Instructions for Authors (https://dbpia.nl.go.kr/plphys/pages/General-Instructions) is Yuepeng Song ([email protected]).
Conflict of interest statement. None declared.
