


Abstract
Sedoheptulose-1,7-bisphosphatase (SBPase) is one of the rate-limiting enzymes of the Calvin cycle, and increasing the abundance of SBPase in C3 plants provides higher photosynthetic rates and stimulates biomass and yield. C4 plants usually have higher photosynthetic rates because they operate a biochemical CO2-concentrating mechanism between mesophyll and bundle sheath cells. In the C4 system, SBPase and other enzymes of the Calvin cycle are localized to the bundle sheath cells. Here we tested what effect increasing abundance of SBPase would have on C4 photosynthesis. Using green foxtail millet (Setaria viridis), a model C4 plant of NADP-ME subtype, we created transgenic plants with 1.5 to 3.2 times higher SBPase content compared to wild-type plants. Transcripts of the transgene were found predominantly in the bundle sheaths suggesting the correct cellular localization of the protein. The abundance of ribulose-1,5-bisphosphate carboxylase/oxygenase large subunit was not affected in transgenic plants overexpressing SBPase, and neither was leaf chlorophyll content or photosynthetic electron transport parameters. We found no association between SBPase content in S. viridis and saturating rates of CO2 assimilation. Moreover, a detailed analysis of CO2 assimilation rates at different CO2 partial pressures, irradiances, and leaf temperatures showed no improvement of photosynthesis in plants overexpressing SBPase. We discuss the potential implications of these results for understanding the role of SBPase in regulation of C4 photosynthesis.
Introduction
Global crop production needs to double by 2050 to meet the projected demands from a rising population, diet shifts, and increasing biofuel consumption (Ray et al., 2013). Increasing the photosynthetic capacity of plants was proposed to substantially increase crop yield (Walter and Kromdijk, 2022; Long et al., 2006; Raines, 2011; Evans, 2013; Parry et al., 2013; Ort et al., 2015; Bailey-Serres et al., 2019; Simkin et al., 2019). This has led to research efforts focusing on improving various photosynthetic components in an attempt to improve plant productivity (Lefebvre et al., 2005; Kromdijk et al., 2016; López-Calcagno et al., 2019; South et al., 2019; López-Calcagno et al., 2020; Ermakova et al., 2021c).
The Calvin–Benson–Bassham (C3) cycle is the primary pathway for CO2 fixation in all terrestrial plants. This cycle plays a central role in plant metabolism providing intermediates for starch and sucrose synthesis as well as isoprenoid metabolism and the shikimic acid biosynthesis (Geiger and Servaites, 1994). The manipulation of C3-cycle enzymes has led to increases in photosynthetic rates (reviewed by Simkin et al., 2019). In particular, the overexpression of sedoheptulose-1,7-bisphosphatase (SBPase) in several C3 species has led to increases in photosynthetic rates and increased biomass in the laboratory and the field (Lefebvre et al., 2005; Feng et al., 2007; Rosenthal et al., 2011; Ding et al., 2016; Driever et al., 2017). SBPase catalyzes the dephosphorylation of sedoheptulose-1,7-bisphosphate, the reaction nested at the branch point between the regenerative phase of the C3 cycle and sucrose or starch biosynthesis. Due to this unique position, SBPase is one of the critical enzymes controlling the carbon flow in plants (Raines et al., 2000).
A major limitation of the C3 cycle is the enzyme ribulose-1,5-bisphosphate carboxylase/oxygenase (Rubisco) catalysing the fixation of CO2 into ribulose-1,5-bisphosphate (RuBP) producing glycerate-3-phosphate (3-PGA), a 3-C compound giving the name “C3 species” to those that use this cycle exclusively. However, Rubisco also catalyzes an oxygenase reaction that competes with CO2 fixation resulting in reductions in yield of over 25% (Walker et al., 2016). To get around this problem, ∼ 4% of plant species have evolved a biochemical CO2-concentrating mechanism, called the C4 pathway, which operates in addition to the C3 cycle and involves two functionally distinct cell types. In the C4 pathway, atmospheric CO2 diffuses into the leaf mesophyll cells where it is converted to by carbonic anhydrase which is then fixed by phosphoenolpyruvate (PEP) carboxylase (PEPC) to produce C4 acids (giving the name to this pathway). These C4 acids diffuse into the bundle sheath cells where they are decarboxylated, thereby elevating the CO2 partial pressure where Rubisco is located, allowing Rubisco to operate close to its maximal rate (Hatch, 1987). C4 crops are high yielding and are characterized by high photosynthetic rates, high nitrogen, and water use efficiency when compared to plants using only the C3 cycle. This has stimulated considerable interest in the C4 photosynthetic pathway (Mitchell and Sheehy, 2006), and a range of strategies to manipulate and enhance C4 photosynthesis are also being considered (von Caemmerer and Furbank, 2016). The rate of Rubisco catalysis and the regeneration of PEP and RuBP together with the electron transport capacity are all possible limiting factors of C4 photosynthesis under high CO2 and high irradiance conditions (von Caemmerer and Furbank, 2016).
To explore these limitations, green foxtail millet (Setaria viridis), has recently been used as a model species to study C4 plant biology. Like the major C4 crops maize (Zea mays) and sorghum (Sorghum bicolor), S. viridis primarily uses NADP-dependent malic enzyme (NADP-ME) for decarboxylation and is readily transformable opening opportunities to investigate the possibility of enhancing C4 photosynthesis (Brutnell et al., 2010). The overexpression of the Rieske FeS protein in S. viridis has been shown to enhance C4 photosynthesis (Ermakova et al., 2019), and the joint overexpression of Rubisco subunits with the RUBISCO ASSEMBLY FACTOR 1 in Z. mays has increased Rubisco protein content and photosynthetic rate (Salesse-Smith et al., 2018). Given that the C3 cycle plays an equally important role in C4 plants and the success reported in enhancing C3 photosynthesis by increasing SBPase content, here we investigated whether the overexpression of SBPase could also enhance C4 photosynthesis. To test this hypothesis, we produced and analyzed S. viridis plants expressing Brachypodium distachyon SBPase from the bundle sheath cell-preferential promoter. Our results showed that SBPase content does not limit C4 photosynthetic flux under any of the environmental conditions tested.
Results
Six S. viridis plants resistant to hygromycin were regenerated after the transformation with the construct for SBPase overexpression. The hpt (hygromycin phosphotransferase) copy number identified by the digital polymerase chain reaction (PCR) indicated that T0 plants contained one to three B. distachyon SBPase (BdSBPase) copies (Figure 1A). Immunodetection of SBPase and PEPC suggested increased SBPase abundance, relative to PEPC, in multiple T0 plants when compared to the wild-type (WT). Plants 2, 3, and 5 were selected, and the progeny of these lines was further analyzed. To verify bundle sheath cell-preferential expression of BdSBPase, the total RNA was isolated from leaves and bundle sheath strands of WT plants and homozygous T1 plants of line 3. Transcript abundance of BdSBPase and the native SBPase (SvSBPase) in the bundle sheaths exceeded the levels detected from whole leaves, indicating that both genes were preferentially expressed in bundle sheath cells (Figure 1B). Homozygous transgenic plants overexpressing SBPase grew similarly to the WT and accumulated similar aboveground biomass 3 weeks after germination (Figure 1C, Table 1).
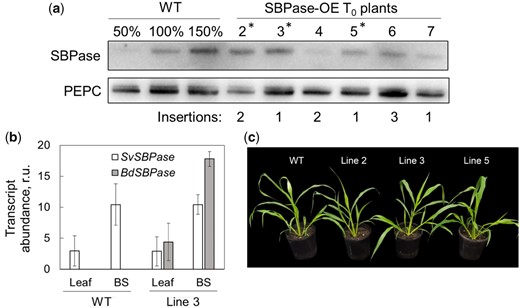
Selection of S. viridis plants overexpressing SBPase (SBPase-OE). A, Immunoblots of SBPase and PEPC (phosphoenolpyruvate carboxylase) in wild-type (WT) S. viridis and 6 T0 plants transformed with SBPase from B. distachion (BdSBPase) under the control of the bundle sheath cell-preferential promoter. The hpt copy numbers estimated by digital PCR suggesting the insertion numbers and the BdSBPase copy numbers are also shown. Asterisks indicate the plants whoose progenies were used in further experiments. B, Transcript abundance of S. viridis SBPase (SvSBPase) and BdSBPase in whole leaf tissue and isolated bundle sheath strands (BS) shows bundle sheath-preferential localization of the native gene and transgene transcripts. Mean ± Se, n = 3 biological replicates; r.u., relative units. C, Phenotype of homozygous plants of the three independent transgenic lines.
Photosynthetic and physiological parameters measured on leaves of wild-type (WT) S. viridis and two transgenic lines overexpressing SBPase at growth light intensity.
| Parameter | WT | Line 2 | Line 3 |
|---|---|---|---|
| Relative chlorophyll (SPAD) | 43.57 ± 0.83 | 42.02 ± 1.18 | 43.00 ± 0.95 |
| Starch content (g m−2) | 0.42 ± 0.15 | 0.69 ± 0.26 | 0.41 ± 0.05 |
| Leaf thickness (mm) | 0.59 ± 0.08 | 0.64 ± 0.07 | 0.58 ± 0.09 |
| Aboveground biomass, g (DW) plant-1 | 0.24 ± 0.03 | 0.25 ± 0.05 | 0.28 ± 0.03 |
| PhiPSII | 0.62 ± 0.01 | 0.62 ± 0.01 | 0.63 ± 0.02 |
| PhiNO | 0.21 ± 0.01 | 0.20 ± 0.01 | 0.20 ± 0.01 |
| PhiNPQ | 0.17 ± 0.01 | 0.18 ± 0.01 | 0.17 ± 0.01 |
| gH+ | 240.4 ± 18.2 | 239.4 ± 7.2 | 255.1 ± 15.2 |
SPAD, soil plant analysis development; DW, dry weight; PhiPSII, the effective quantum yield of Photosystem II; PhiNPQ, the yield of non-photochemical quenching; PhiNO, the yield of non-regulated non-photochemical reactions in PSII; gH+, proton conductivity of the thylakoid membrane. Mean ± Se, n = 6–7 biological replicates. No statistically significant differences were found between transgenic and WT plants (P < 0.05, t test).
We studied the impact of increased SBPase abundance on C4 photosynthesis first by analyzing T1 plants of lines 2 and 3 for hpt insertion number and SBPase and Rubisco large subunit (RBCL) content. Relative abundance of SBPase, quantified from the immunoblots (Figure 2A), showed a strong positive correlation with the insertion number in T1 plants and, thus, with the copy number of BdSBPase (Figure 2B). Homozygous plants of line 2, containing four copies of BdSBPase, showed the highest SBPase levels (about four times of WT). The relative content of RBCL showed no correlation with the insertion number (Figure 2C), indicating that neither increased SBPase abundance or insertion positions had an impact on Rubisco abundance in transgenic plants. In addition, neither relative chlorophyll abundance, leaf thickness, nor starch content was affected in plants with increased SBPase content, compared to the WT (Table 1).
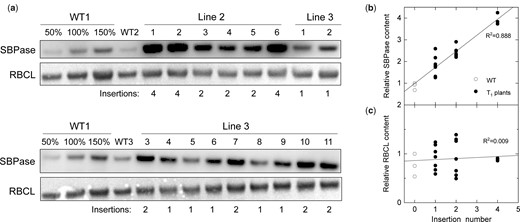
Analysis of S. viridis plants overexpressing SBPase. A, Immunodetection of SBPase and RBCL (ribulose-1,5-bisphosphate carboxylase/oxygenase large subunit) in leaf protein samples from wild-type (WT) plants and the T1 progeny of transgenic lines 2 and 3. Samples were loaded on a leaf area basis, and the titration series of the WT1 sample was used for relative quantification. Insertion number indicates hpt copy number estimated by digital PCR. B and C, Relative SBPase and RBCL content as a function of insertion number (data taken from A).
Next, we studied the photosynthetic properties of S. viridis plants with increased SBPase content. Figure 3 shows that CO2 assimilation rates measured from WT and T1 plants of lines 2 and 3 at ambient CO2 partial pressure were not affected by SBPase content quantified from the immunoblots (Figure 2A). Moreover, no difference in CO2 assimilation rates was detected between WT and transgenic plants overexpressing SBPase at different intercellular CO2 partial pressures or irradiances (Figure 4). Electron transport parameters measured at growth light intensity indicated that plants with increased SBPase content had WT-like activity of Photosystem II since no changes in partitioning of the absorbed light between photochemical (PhiPSII) and non-photochemical (PhiNPQ and PhiNO) reactions within Photosystem II were detected (Table 1). Activity of the chloroplast ATP synthase, estimated as proton conductivity of the thylakoid membrane (gH+), did not differ between the genotypes either (Table 1).
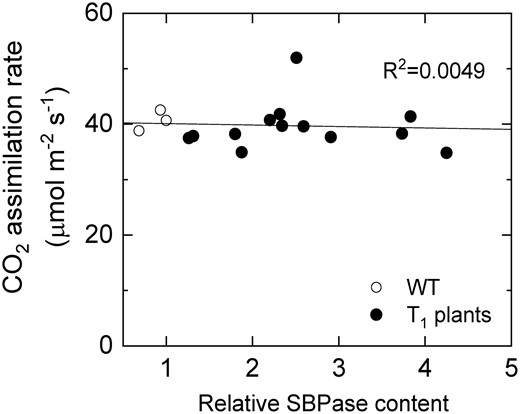
Saturating CO2 asimilation rate as a function of relative SBPase content in leaves of wild-type (WT) S. viridis and T1 progeny of lines 2 and 3 overexpressing SBPase. Measurements were made at an ambient CO2 partial pressure of 400 µbar, an irradiance of 1,500 µmol m−2 s−1 and a leaf temperature of 28°C.
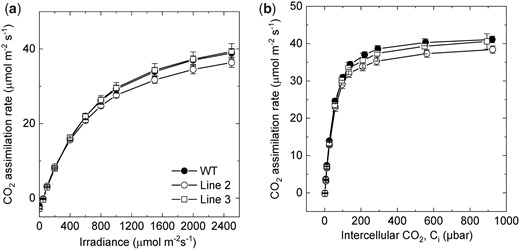
Gas exchange properties of wild-type (WT) S. viridis and transgenic plants overexpressing SBPase. A, CO2 assimilation rate as a function of intercellular CO2 partial pressure. Measurements were made at an irradiance of 1,500 µmol m−2 s−1 and a leaf temperature of 28°C. B, CO2 assimilation rate as a function of irradiance. Measurements were made at an ambient CO2 partial pressure of 400 µbar and a leaf temperature of 28°C. All measurements were made on the T1 progeny of lines 2 and 3. Average relative abundance of SBPase per leaf area, calculated from the immunoblots in Figure 2, was significantly increased in line 2 (3.2 times, P = 0.002, t test) and in line 3 (2.0 times, P = 0.001, t test), relative to WT. Mean ± Se, n = 3 biological replicates. No significant differences in CO2 assimilation rates were found between transgenic and WT plants (P < 0.05, t test).
We also tested CO2 assimilation rates at different temperatures in homozygous T2 plants of lines 3 and 5 with increased SBPase abundance confirmed by immunoblotting (Supplemental Figure S1). For this, CO2 response curves of assimilation were measured on leaves acclimated to 35°C and 15°C (Figure 5). No difference in CO2 assimilation was detected between WT and transgenic plants overexpressing SBPase at 35°C. At 15°C, both transgenic lines showed WT-like rates of assimilation, except for the plants of line 5 having significantly increased CO2 assimilation rate of 6.80 ± 0.04 µmol m−2 s−1 at the intercellular CO2 partial pressure of about 13 µbar, compared to the WT rate of 5.14 ± 0.35 µmol m−2 s−1 (P = 0.040, t test).
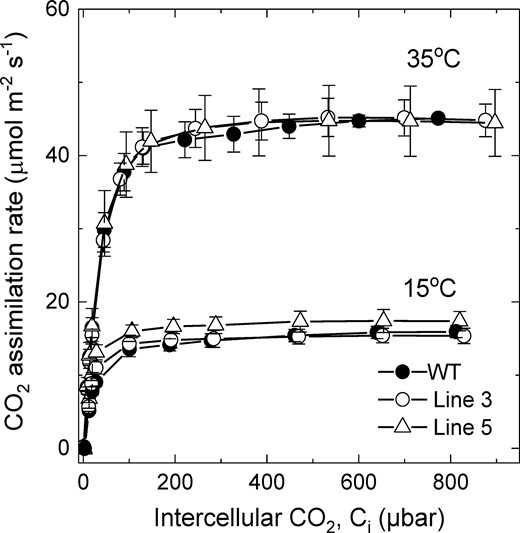
CO2 assimilation rate as a function of intercellular CO2 partial pressure at different temperatures in wild-type (WT) S. viridis and transgenic plants overexpressing SBPase. Measurements were made on the T2 progeny of lines 3 and 5 at an irradiance of 1,500 µmol m−2 s−1 and a leaf temperature of 35°C or 15°C. Average relative abundance of SBPase per leaf area, calculated from the immunoblots in Supplemental Figure S1, was increased two times in line 3 and 1.5 times in line 5, relative to the WT. Mean ± Se, n = 3 biological replicates. Details of statistical analysis of CO2 assimilation rates between transgenic and WT plants are provided in the results (P < 0.05, t test).
Discussion
The overexpression of SBPase has led to increases in photosynthetic rates and increased biomass in several C3 species (Lefebvre et al., 2005; Feng et al., 2007; Rosenthal et al., 2011; Ding et al., 2016; Driever et al., 2017). In the C4 photosynthetic system, SBPase and the C3 cycle are located in the bundle sheath cells, and therefore the C3 cycle in C4 photosynthesis is poised differently from the C3 cycle in C3 species. Because the C3 cycle operates at high CO2 partial pressure in the bundle sheath, C4 species have characteristically less Rubisco protein than C3 species (Sage and Pearcy, 1987; von Caemmerer and Furbank, 2016); however, to achieve high photosynthetic rates, SBPase levels will need to be similar to that in C3 species.
Here, we expressed BdSBPase from a bundle sheath cell-preferential promoter to test SBPase overexpression in a C4 photosynthetic system. We observed increased SBPase content in T0 plants and selected three T1 lines for our investigations (Figure 1). Transgenic plants had between 1.5 and 3.2 times the amount of SBPase, relative to the WT, as judged from the immunoblots (Figure 2A; Supplemental Figure S1). Despite these substantial increases in protein content, we observed no increase in photosynthetic rates under a range of environmental conditions including different irradiances, CO2 partial pressure, and temperatures. The C4 photosynthetic model suggests that SBPase limitation should be apparent at the CO2 partial pressure above ambient where SBPase content may well be co-limiting with electron transport capacity, Rubisco activity, and PEP regeneration (von Caemmerer and Furbank, 1999; von Caemmerer, 2021).
S. viridis uses NADP-ME decarboxylation system in the bundle sheath chloroplast (Figure 6) and, similar to most NADP-ME species, S. viridis has low Photosystem II activity and linear electron transport rate in bundle sheath cells (Ermakova et al., 2021b). This prompts the export of part of the 3-PGA pool to the mesophyll for conversion to triose phosphate, which then diffuses back to the bundle sheath, known as the triose phosphate shuttle (von Caemmerer and Furbank, 2016 and references therein; Figure 6). To support this movement of triose phosphate and 3-PGA, diffusion gradients between the mesophyll cells and the bundle sheath must be built up and maintained (Furbank and Kelly, 2021 and references therein). Moreover, reactions of sucrose and starch synthesis are distributed between the different cell types in the C4 system with sucrose being made mostly in the mesophyll cells and starch—in the bundle sheath (Furbank et al., 1985; Lunn and Furbank, 1997; Furbank and Kelly, 2021). The combination of the triose phosphate shuttle and the cellular localization of sucrose and starch biosynthesis may mean that the regulation of the regeneration of RuBP in C4 bundle sheath chloroplasts is somewhat different from that in C3 chloroplasts where sucrose and starch synthesis and 3-PGA reduction are all occurring in a single cell type. It has been proposed that both SBPase and FBPase play key roles in determining the fate of triose phosphate in the C3 cycle, i.e. whether it is recycled to regenerate RuBP or used to make sucrose and starch (Raines et al., 2000 and references therein). This regulation is important as the metabolite pools within the cycle need to be preserved and flux maintained while carbon is removed for storage. The regulation is controlled not only by the activities of these biphosphatases but also by a complex balance of orthophosphate consumption in photophosphorylation and its resupply from Pi release in sucrose biosynthesis and the activity of ADPG-pyrophosphorylase (Furbank and Kelly, 2021). Since in the C4 bundle sheath chloroplast, triose phosphate is imported in exchange for 3-PGA export, the Pi recycling process is by necessity different from the C3 case where triose phosphate is exchanged for Pi. This division of metabolism between the cell types and the higher flexibility of carbon flow in C4 plants might reduce the capacity to regulate carbon flux by the abundance of SBPase.
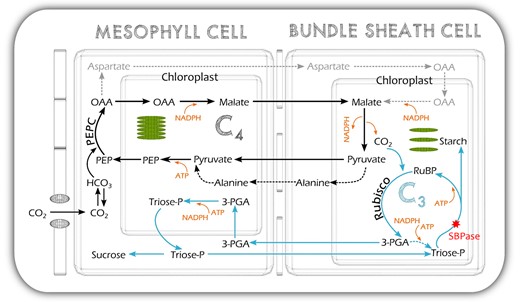
Schematic of the NADP-ME C4 photosynthetic pathway of S. viridis showing the location of SBPase in the pathway. C3, the Calvin–Benson–Bassham cycle, blue arrows; C4, the C4 cycle, black arrows; PEP, phosphoenolpyruvate; PEPC, PEP carboxylase; OAA, oxaloacetate; RuBP, ribulose-1,5-bisphosphate; Rubisco, RuBP carboxylase/oxygenase; 3-PGA, glycerate-3-phosphate; triose-P, triose phosphate.
Little is known about potential differences in the regulation of SBPase between C3 and C4 plants. There is evidence that the kinetic properties of enzymes such as cytosolic FBPase are quite different in C4 plants to support the cellular gradients required for fluxes of metabolites (Furbank and Kelly, 2021). Reported differences in the C3 cycle metabolites, like RuBP, 3-PGA, and triose phosphate, between C4 and C3 species also suggest possible alterations in abundances or regulation of the C3 cycle enzymes (Arrivault et al., 2019; Stitt et al., 2021). Interestingly, leaf SBP content has been progressively decreasing during the evolutionary transition from C3 to C4 plants in the genus Flaveria (Borghi et al., 2021). Low SBP levels could indicate already high SBPase activity and explain why increasing SBPase content did not affect photosynthesis in this study. Wheat SBPase was shown to be regulated by pH and Mg2+ concentrations consistent with its activity being stimulated under light (Woodrow et al., 1984). Moreover, like some other enzymes of the C3 cycle, SBPase is activated by the thioredoxin system via a light-dependent reduction of the disulfide bond (Breazeale et al., 1978; Dunford et al., 1998). Since we were not able to measure in vitro activity of SBPase, there is a possibility that SBPase from B. distachyon, a C3 plant, was inactive when expressed in bundle sheath cells of the C4 plant. However, amino acid sequences of SBPase from S. viridis and B. distachyon are 92.4% identical, and all cysteine residues are conserved (Supplemental Figure S2). Moreover, SBPase from Z. mays could be activated by thioredoxin f from spinach (Spinacia oleracea), suggesting a cross-reactivity between enzymes and thioredoxins from different species (Nishizawa and Buchanan, 1981). Nevertheless, although a positive association was typically observed between the active form and total enzyme abundance in C3 plants overexpressing SBPase (Driever et al., 2017), there is a possibility that the additional SBPase was not active in S. viridis due to a limited availability of reducing power to the thioredoxin system in C4 bundle sheath cells. In that case, C4 photosynthesis would not be limited by SBPase directly, but rather by electron transport, which has been previously confirmed (Ermakova et al., 2019).
Conclusion
Under the range of conditions tested in this study, increasing SBPase levels did not increase the photosynthetic flux in the C4 grass S. viridis, in contrast to observations of SBPase overexpression in C3 plants. We propose that this is because of (1) the triose phosphate shuttle in C4 plants, where part of the 3-PGA produced by Rubisco is reduced in the mesophyll chloroplasts and returned to the bundle sheath chloroplasts and (2) the cellular specialization of starch and sucrose biosynthesis in C4 leaves where these processes are spatially separated. These unique aspects of the C4 photosynthetic pathway are likely to result in a different distribution of control over regeneration of RuBP and the coordination of RuBP production and sugar phosphate utilization in starch and sucrose synthesis. Although the degree of sophistication of the current C4 models might be insufficient to accommodate some finely tuned control mechanisms, recent developments in modelling will be instrumental for identifying new targets for improving C4 photosynthesis (Bellasio and Ermakova, 2022; Wang et al., 2021; Yin and Struik, 2021).
Materials and methods
Generation of transgenic plants
The coding sequence of Brachypodium distachyon SBPase (Bradi2g55150, https://phytozome-next.jgi.doe.gov) was codon-optimized for the Golden Gate cloning system (Engler et al., 2014) and assembled with the bundle sheath cell-preferential Flaveria trinervia glycine decarboxylase P-protein (GLDP) promoter (Engelmann et al., 2008; Gupta et al., 2020) and the bacterial nopaline synthase (NOS) terminator. The resulting expression module was cloned into the second slot of a plant binary vector pAGM4723. The first slot was occupied by the hpt gene driven by the rice (Oryza sativa) Actin1 promoter. The construct was verified by sequencing and transformed into green foxtail millet (S. viridis) “MEO V34-1” using Agrobacterium tumefaciens strain AGL1 according to the protocol described in detail in Osborn et al. (2016). T0 plants resistant to hygromycin were transferred to soil and tested for SBPase abundance by immunoblotting and hpt copy number by digital PCR (iDNA genetics, Norwich, UK). WT plants were used as the control in all experiments.
Plant growth conditions
Seeds were surface-sterilized and germinated on rooting medium containing 2.15 g L−1 Murashige and Skoog salts, 10 mL L−1 100× Murashige and Skoog vitamins stock, 30 g L−1 sucrose, 7 g L−1 Phytoblend, 20 mg L−1 hygromycin (no hygromycin for WT plants), pH 5.7. Seedlings that developed secondary roots were transferred to 1-L pots with the commercial potting mix (Debco, Tyabb, Australia) layered on top with 2 cm of the seed raising mix (Debco) both containing 1g L−1 Osmocote (Scotts, Bella Vista, Australia). Plants were grown in controlled environment chambers with ambient CO2, 16-h photoperiod, 28°C day, 22°C night, and 60% humidity. Light at the intensity of 300 µmol m−2 s−1 was supplied by 1,000 W red sunrise 3,200 K lamps (Sunmaster Growlamps, Solon, OH, USA). Youngest fully expanded leaves of 3-week-old plants were used in all experiments. Photosynthetic and physiological parameters of leaves were measured with the MultispeQ “Photosynthesis RIDES” protocol at ambient conditions in the growth chamber (Kuhlgert et al., 2016), and the results were analyzed using the PhotosynQ platform (https://photosynq.com). Starch from leaves was isolated as described in Ermakova et al. (2021b) and assayed using the Total Starch assay kit (Megazyme, Bray, Ireland).
Immunoblotting
Leaf discs of the same area were collected and immediately frozen in liquid N2. Protein samples were isolated from leaf discs as described in Ermakova et al. (2019). Proteins were separated by sodium dodecyl sulphate–polyacrylamide gel electrophoresis, transferred to a nitrocellulose membrane and probed with antibodies against SBPase (AS152873, Agrisera, Vännäs, Sweden), RBCL (Martin-Avila et al., 2020), and PEPC (Ermakova et al., 2021a). Quantification of immunoblots was performed with the Image Lab software (Biorad, Hercules, CA, USA).
Bundle sheath isolation and RT–qPCR
Bundle sheath strands were isolated following the procedure of Ghannoum et al. (2005) as described in detail in Ermakova et al. (2021b). RNA was isolated from leaves and bundle sheath strands, ground in liquid N2, using the RNeasy Plant Mini Kit (Qiagen, Venlo, The Netherlands). DNA was removed from the samples using the Ambion TURBO DNA free kit (Thermo Fisher Scientific, Tewksbury, MA). cDNA was synthesized and analyzed by RT–qPCR as described in Ermakova et al. (2019) Relative fold change was calculated by the ΔΔCt method using the geometric mean of the Ct values for three reference genes described in Osborn et al. (2016). Primers to distinguish between S. viridis and B. distachyon SBPase transcripts were designed using Primer3 in Geneious R9.1.1 (https://www.geneious.com).
Gas exchange
Gas exchange analysis was performed using a LI-6800 (LI-COR Biosciences, Lincoln, NE, USA). First, leaves were equilibrated at 1,500 µmol m−2 s−1 (90% red/10% blue actinic light), 400 ppm CO2 in the reference side, leaf temperature 28°C, 60% humidity and flow rate of 500 µmol s−1, and then light or CO2 response curves of CO2 assimilation were recorded. For the light response curves, a stepwise increase of irradiance from 0 to 3,000 µmol m−2 s−1 was imposed at 2-min intervals. For the CO2 response curves, a stepwise increase of CO2 partial pressures from 0 to 1,600 ppm was imposed at 3-min intervals. To record CO2 response curves at different temperatures, plants were kept in growth cabinets set to 15°C or 35°C, and leaves were equilibrated at a corresponding leaf temperature for 20 min before the measurement.
Statistical analysis
The relationship between mean values of transgenic and WT plants was tested using two-tailed, heteroscedastic Student’s t test. Linear regressions were fitted in OriginPro 2018b.
Accession numbers
Sequence data from this article can be found in the GenBank/EMBL data libraries under accession numbers_LOC100828873 (Brachypodium distachion SBPase, BRADI_2g55150) and LOC117858624 (Setaria viridis SBPase, SEVIR_5G389900).
Supplemental data
The following materials are available in the online version of this article.
Supplemental Figure S1. Immunoblotting of protein extracts isolated from plants analyzed in Figure 5.
Supplemental Figure S2. Alignment of SBPase amino acid sequences from Brachypodium distachion (BdSBPase) and Setaria viridis (SvSBPase).
Acknowledgments
We thank Xueqin Wang for help with S. viridis transformation, Zac Taylor and Ayla Manwaring for immunoblotting, and Emily Watson for gas exchange measurements.
Funding
This work was supported by the Australian Research Council Centre of Excellence for Translational Photosynthesis (CE140100015).
S.v.C., C.R., R.F., and M.E. designed the research; M.E. and P.L. performed the research; M.E. and S.v.C. analyzed the data; S.v.C., M.E., C.R., and R.F. wrote the paper.
The author responsible for distribution of materials integral to the findings presented in this article in accordance with the policy described in the Instructions for Authors (https://dbpia.nl.go.kr/plphys/pages/general-instructions) is: Maria Ermakova ([email protected]).
References
Author notes
Conflict of interest statement. None declared.
