


Abstract
The roots of lycophytes branch through dichotomy or bifurcation, during which the root apex splits into two daughter roots. This is morphologically distinct from lateral root (LR) branching in the extant euphyllophytes, with LRs developing along the root axis at different distances from the apex. Although the process of root bifurcation is poorly understood, such knowledge can be important, because it may represent an evolutionarily ancient strategy that roots recruited to form new stem cells or meristems. In this study, we examined root bifurcation in the lycophyte Selaginella moellendorffii. We characterized an in vitro developmental time frame based on repetitive apex bifurcations, allowing us to sample different stages of dichotomous root branching and analyze the root meristem and root branching in S. moellendorffii at the microscopic and transcriptomic level. Our results showed that, in contrast to previous assumptions, initial cells (ICs) in the root meristem are mostly not tetrahedral but rather show an irregular shape. Tracking down the early stages of root branching argues for the occurrence of a symmetric division of the single IC, resulting in two apical stem cells that initiate root meristem bifurcation. Moreover, we generated a S. moellendorffii root branching transcriptome that resulted in the delineation of a subset of core meristem genes. The occurrence of multiple putative orthologs of meristem genes in this dataset suggests the presence of conserved pathways in the control of meristem and root stem cell establishment or maintenance.
Introduction
Roots provide multiple key functions for plants, and their capacity to branch is important to anchor in a substrate and to forage for water and nutrients (Raven and Edwards, 2001; Motte and Beeckman, 2019). Root development and root branching have been in particular studied in angiosperms, e.g. Arabidopsis (Arabidopsis thaliana). Here, roots branch via the formation of lateral roots (LRs), which develop in the differentiated part of the root from pluripotent pericycle cells. After a series of well-orchestrated divisions, a new root meristem is formed that grows out of the parent root. Noteworthy, gene expression or anatomical studies of LR formation in different species can be facilitated by employing LR inducible systems, allowing the synchronous induction of many LRs (Himanen et al., 2002; Himanen et al., 2004; Vanneste et al., 2005; De Smet et al., 2008; Jansen et al., 2013; Crombez et al., 2016; Herrbach et al., 2017).
In contrast to angiosperms, Selaginella species, members of the lycophyte lineage, do not possess pluripotent cells that give rise to LRs (Fang et al., 2019). Instead, roots dichotomously branch at the tip through bifurcation of the apical meristem (Imaichi and Kato, 1989; Lu and Jernstedt, 1996; Otreba and Gola, 2011; Gola, 2014; Fang et al., 2019; Motte and Beeckman, 2019). Lycophytes were the first plants that acquired roots (Hetherington and Dolan, 2018). Hence, studying their root system can contribute to the understanding of how root developmental mechanisms evolved. Lycophyte roots, however, originated independently from roots of the other land plant lineages (Hetherington and Dolan, 2019), but both molecular and anatomical data suggest a highly convergent evolution, and possibly even a common (partial) recruitment of a genetic program present in the rootless common ancestor of the different lineages (Huang and Schiefelbein, 2015; Motte and Beeckman, 2019). Based on fossil records, dichotomous root branching was found at the base of lycophyte evolution, putting it forward as an early innovation during the evolution of roots (Hao et al., 2010; Matsunaga and Tomescu, 2016; Hetherington and Dolan, 2017; Hetherington et al., 2020).
Unfortunately, despite intensive, but almost exclusively histological studies, the development and anatomy of the Selaginella root apical meristem and its bifurcation are still poorly understood. Multiple studies report the presence of one central tetrahedral initial cell (IC) or apical stem cell (Otreba and Gola, 2011 and refs therein) that, in analogy with the apical cell in the root meristem of certain ferns, was suggested to cut off daughter cells in four directions to provide cells for the root cap at the distal side, and cells for the growing root at the three proximal sides. In some ferns, it is clearly documented that the three proximal daughter cells each divide in an equal pattern, forming merophytes or clonally related groups of cells. Subsequent merophytes are superimposed to form different layers in the root (Hou and Hill, 2004). In contrast to ferns, such division pattern is less obvious in Selaginella roots. Furthermore, the branching process is problematic to study at the microscopic level. Live imaging is difficult because of the lack of biotechnological tools (Motte et al., 2020), and arbitrarily sampled roots rarely represent critical phases in which roots are undergoing bifurcation. Moreover, histological sectioning does not allow a high-throughput approach, and serial sectioning is required to obtain the relevant sections in which the IC is visible. As a consequence, the cell division events associated with root meristem bifurcation remain elusive, and different hypotheses still exist on how the doubling of the meristem might occur (Motte and Beeckman, 2019). One hypothesis suggests the disappearance of the IC as a result of segmentation followed by the recruitment of two new meristematic cells as two new ICs (Otreba and Gola, 2011). Barlow and Lück (2004), on the other hand, suggested that one of the daughter cells of the original IC becomes a new initial. Interestingly, in the Selaginella shoot meristem, a seemingly symmetric division of the apical cell is suggested to initiate dichotomy (Christopher and Andrew, 2009; Jones and Drinnan, 2009). Such a symmetric longitudinal division of the apical cell is also the cause of thallus bifurcation in certain algae (Oltmanns, 1889; von Goebel, 1928; van den Hoek et al., 1995; Gola, 2014).
Being the first lycophyte with a sequenced genome, Selaginella moellendorffii became an important model species for evolutionary research (Banks, 2009; Banks et al., 2011; Motte et al., 2020). Moreover, as root bifurcation seems to involve the initiation of a new root stem cell, dichotomous root branching could be used as a unique system to study root stem cell specification in an evolutionary context and to get insight into the complex process of dichotomy in general. Useful datasets and genetic tools start to become available, including several transcriptomic datasets from root samples (Ferrari et al., 2020; Motte et al., 2020; Fang et al., 2021). However, these studies are merely snapshots of the roots and do not allow to study temporal changes associated with the bifurcation process.
Selaginella moellendorffii root branching cannot be induced by hormone treatments and a root branching inducible system, similar as for angiosperms, does not seem to be feasible (Fang et al., 2019), complicating the capturing of early bifurcating root meristems. Here, as an alternative, we developed a dichotomous branching assay that enriches for samples with bifurcating roots. We applied this assay for histological sectioning and whole-mount confocal microscopy. Based on this, and complementary to the current literature, we advocate that two new root meristems originate from a division of the IC into two ICs. Furthermore, we exploited the assay to sample roots at regular intervals for RNA sequencing (RNA-seq) and revealed as such the S. moellendorffii root branching transcriptome. We show that transiently upregulated genes have a meristem signature, supporting the value of this dataset as a resource to identify candidate stem cell or meristem regulators in Selaginella. Moreover, a vast number of differentially expressed genes (DEGs) are homologous to Arabidopsis genes with a known role in stem cell or meristem functioning. This indicates, despite the structural difference in root meristems, a possible conservation in the pathways controlling meristem or stem cell functionality in Selaginella and Arabidopsis.
Results
Developmental time course of S. moellendorffii root bifurcation
The anatomical or transcriptomic study of root bifurcation in S. moellendorffii could take advantage of an inducible root branching system like the LR inducible system in Arabidopsis (Himanen et al., 2002), because the initiation of new meristems can be synchronized and thus followed over time. A prerequisite is, however, to obtain a zero point at which no branching is ongoing. We previously reported that auxin transport inhibitors and a synthetic cytokinin were not able to prevent root branching in S. moellendorffii without affecting growth (Fang et al., 2019), and as such do not allow to obtain uniform starting material. Moreover, we did not succeed to identify a treatment that could induce meristem bifurcation itself (Fang et al., 2019). As a consequence, a synchronized root branching system that enables the study of root branching initiation does not seem to be feasible.
Therefore, we wondered whether we could predict root branching based on the repetitive apex divisions taking place in in vitro-grown S. moellendorffii explants as an alternative approach. To characterize root branching, S. moellendorffii shoot explants were excised and transferred to fresh medium, which resulted in the spontaneous development of roots. First, rhizophores were initiated, from which the root grew out (Figure 1, A and B); subsequently, the roots repeatedly bifurcated dichotomously (Figure 1, C and D; Supplemental Movie S1). We followed the origin and bifurcation of in total 983 roots within three independent experiments, and observed all roots on a daily basis. Bifurcation events were macroscopically observed and recognized by the presence of two dome-shaped primordia at the root tip (Figure 1C). In practice, it was difficult to exactly trace back the time of appearance for all rhizophores, as young rhizophores were almost colorless and mostly covered by the leaves. Still, taking the time point of the shoot explant transfer as the reference, we observed that a majority of the roots underwent the first bifurcation between 10 and 15 d post transfer of the explants (Figure 1E). We continued to follow a subset of 361 root tips from two experimental repeats, and observed, taking the first bifurcation (Figure 1C) as a reference point, that the majority of roots bifurcated again between 6 and 9 d after the first bifurcation (Figure 1F). To study the timing of bifurcation in more detail at the histological level, we took the first bifurcation event as shown in Figure 1C as reference time point 0, and sampled at least ten root tips on a daily basis for microscopic analysis. All root tips were subjected to whole-mount confocal imaging to assess the appearance of new meristems, as shown in Figure 1G. As previously shown, the apices at time point 0 never contained two apical meristems (Fang et al., 2019). Similarly, meristem bifurcation was not detected on the first and second day after the first branching (Figure 1H). The first roots with two clear meristem regions were detected 3 d after the first branching. The number of roots with two meristem regions steadily increased over time and almost all root tips effectively bifurcated after 6 d (Figure 1H).
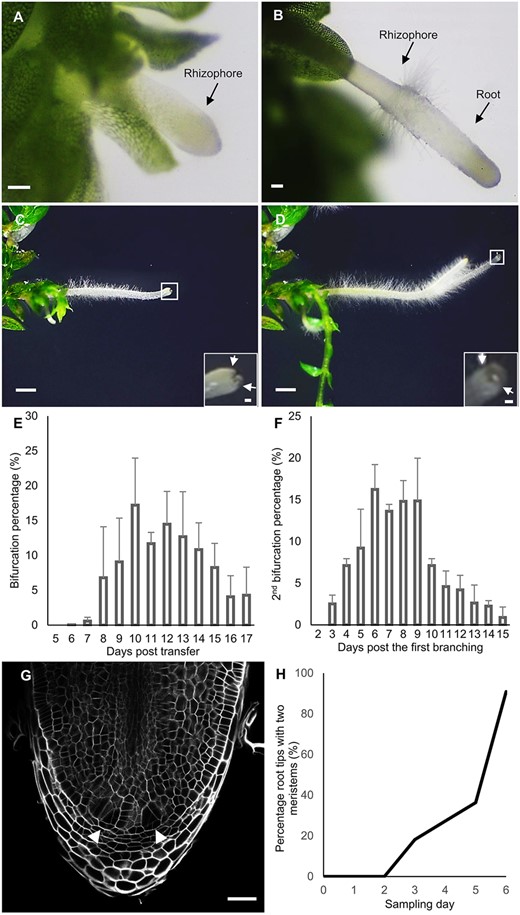
Dichotomous root branching in S. moellendorffii. A, A young hairless rhizophore. B, Root emergence from the rhizophore. The transition from the rhizophore to the root is marked by the appearance of a collar of root hairs. Scale bars: 0.1 mm. C and D, Formation of first- (C) and second-order (D) bifurcated roots. Scale bars: 1 mm The insets are magnifications of the squares (Scale bars: 0.1 mm). The arrows indicate newly formed root apices. E, Percentage of root tips that underwent the first bifurcation during 17 d after transfer on 1/2 MS. The bifurcation percentage was calculated as the number of first-order bifurcated roots divided by the total number of roots. Values are averages of three repeats ± SD. F, Percentage of root tips that underwent the second bifurcation during 15 d after the first bifurcation. The bifurcation percentage was calculated as the number of second-order bifurcated root apices divided by the total number of the apices from roots that underwent a first bifurcation. Values are averages of two repeats ± SD. G, Confocal image showing a bifurcated apical meristem: root tip with two new clearly recognizable young meristems (arrowheads). Scale bar: 50 μm. H, Percentage of bifurcated meristems in the root branching time course, i.e. days after the first branching. The percentage was calculated as the number of root apices showing clear apical meristem bifurcation (see Figure 1G) divided by the total number of sampled root tips. n (daily sample number) ≥ 10.
Thus, in a relatively limited time frame after the first bifurcation event, practically all root tips bifurcated again. Because the presence of two meristems was visible from Day 3 onwards, the onset of the bifurcation and related anatomical events could be anticipated to occur early during the time course. Furthermore, because of the steadily increasing percentage of bifurcated meristems, we could anticipate the enrichment of specific developmental stages during consecutive time points. Therefore, we employed this time course starting from newly branched roots to further characterize S. moellendorffii root branching, both from the histological and transcriptomic point of view.
Meristem bifurcation is the result of a division of the irregularly shaped IC
To characterize the early events in S. moellendorffii root branching, we sampled root tips on different days after the first bifurcation event (time point 0) and subjected them to histological sectioning. At time point 0, two root tips are present each with an IC (Figure 2, A and B). The putative ICs were recognized by their triangular shape, by their central position within the root tip and above the root cap, by their bigger size compared to neighboring cells and/or by the surrounding of apparent merophytic cell clusters (Figure 2B). The latter illustrates how daughter cells have been cut off from different faces of the IC, and subsequently divide (Figure 2B). Starting from 2 d after time point 0, we were able to recognize two similar-sized ICs next to or close to each other in different root tips (Figure 2, C–G). This challenges the current hypotheses on the initiation of dichotomous root branching in Selaginella, and might point to an IC division as a first stage during root bifurcation. In particular, Figure 2C shows a clear image of two separate basal derivatives from the presumptive ICs that both formed root cap cells. Figure 2D shows a similar image, but here, one of the two presumptive ICs had two nuclei and seemed to be finishing a subsequent cell division. Figure 2, E and F shows root apices with two presumptive ICs separated by only one cell, whereas Figure 2G shows a separation of the two ICs by more cells. Overall, this indicates that two new ICs originate after a symmetric division (a proliferative division giving rise to two daughter cells with the same cell fate) of the original IC, and continue to develop two new root primordia.

Histological sections from S. moellendorffii roots sampled during the root branching time course. A and B, A newly branched root tip containing two apical meristems sampled on Day 0; (B) is a magnification of the indicated area in (A). The inset in (B) shows a magnification of the IC and its neighboring region. The initial and the presumptive most recent daughter cells are indicated by dotted lines. The hollow arrows indicate the expected directions in which the IC cuts off daughter cells from the different faces. Scale bars: 50 µm, except for the inset: 10 µm. C–G, Early-stage bifurcating meristems with two presumptive ICs next or close to each other. The insets show a magnification of the indicated area, the arrows indicate the ICs. Scale bars: 50 μm, except for panel (C), (D) and the insets: 10 µm.
However, in many samples, we were not able to recognize such stages, and designation of the ICs was often not straightforward, possibly because ICs were regularly out of plane in the sections. Therefore, to confirm the observed and seemingly symmetric divisions of the IC, and to increase the workflow in order to analyze more samples at the same time, we decided to use the same approach while performing whole-mount confocal imaging. Supplemental Movie S2 shows a full stack of an unbranched root, and illustrates how this technique enables better designation of the IC by going through the sections. This stack was used to reconstruct the root (Figure 3A) and clearly presents the organization of the meristem. To have a better view on the structure of the IC, we first used whole stacks for 3D cell segmentation and isolated the IC. Earlier reports with two-dimensional histological sections hypothesized that the root IC is tetrahedral (Imaichi and Kato, 1989; Otreba and Gola, 2011). However, segmentation of the IC from several samples showed that its shape is not uniform and not tetrahedral (Figure 3B; Supplemental Movies S3–S7). Most side views, but not all, show triangular faces, while most distal faces are irregularly shaped, and are only triangular-like in a few cases. Hence, the IC in S. moellendorffii roots is in general not tetrahedral, and its irregular shape makes it difficult to be recognized, especially in sections that follows only one plane.
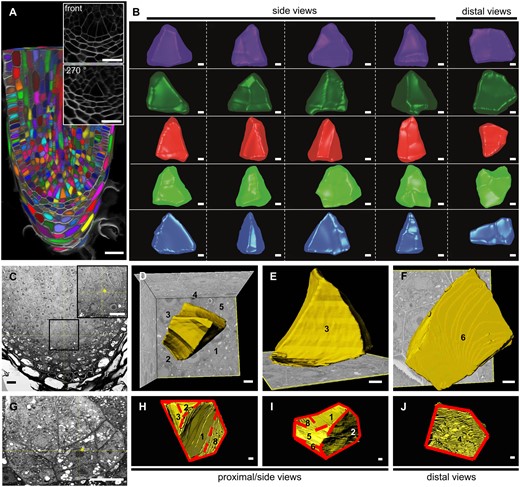
Three-dimensional imaging to segment ICs. A, Example of a S. moellendorffii root generated from a whole-mount confocal stack (Supplemental Movie S2). Individual cells are randomly colored. Insets show magnifications of the front view or the 270-degree-clockwise turned view. Scale bar: 20 µm. B, Different views of five ICs segmented from confocal stacks. The fifth, blue IC was segmented from the root in panel A. See Supplemental Movies S3–S7 for a full overview of the ICs. Scale bars: 2 µm. C and G, SBF-SEM longitudinal sections (xz-views) showing two ICs. The inset shows a magnification of the indicated area in (C). The asterisks indicate the ICs. Scale bars: 10 μm. D–F and H–J, Serial section reconstruction of the ICs. The numbers indicate the corresponding faces of the cells. See Supplemental Movies S8 and S9 for a full overview. The solid and dashed lines in (H–J) separate the different faces. Scale bars: 1 μm.
To confirm this irregular shape of the IC, we also subjected two root samples to serial block face scanning electron microscopy (SBF-SEM), allowing a much higher resolution of the cells and cell walls (Figure 3, C–J; Supplemental Figure S1; Supplemental Movies S8 and S9). Three-dimensional reconstruction based on the serial sections showed that one IC has five or six faces (Faces 4 and 5 might be considered as one, see Figure 3D; Supplemental Figure S1E), instead of four in a tetrahedron. Furthermore, it has a wedge-like shape with two opposite triangular faces (Faces 1 and 3) and a rectangular bottom (Face 6; Figure 3, D–F; Supplemental Figure S1, C–E, Supplemental Movie S8). The second IC had three major proximal faces (Faces 1–3), all with irregular triangular-like shapes, and a pentagonal distal face (Face 4; Figure 3, H–J; Supplemental Figure S1, H–J; Supplemental Movie S9). Hence, the ICs are irregular in shape, and not per se having a triangular face in all longitudinal planes. This is an important observation to take into consideration when looking for ICs in sections, and explains why it is often troublesome to make a correct designation. By using whole stacks, it is possible to reorient the stack in such a way that ICs are clearly recognizable (as illustrated by the 270 degree view in Figure 3A), as there almost always seems to be two faces with a triangular shape.
We next sampled root tips during the root branching time course in independent experiments covering different time points. The roots were subjected to whole-mount confocal imaging and stacks were made and reoriented to select planes with clear ICs (Figure 4). Again, in some roots, two ICs of apparent similar size were positioned next to each other (Figure 4, A–D; Supplemental Figure S2, A–C). This further supports the hypothesis for a symmetric division of the IC.
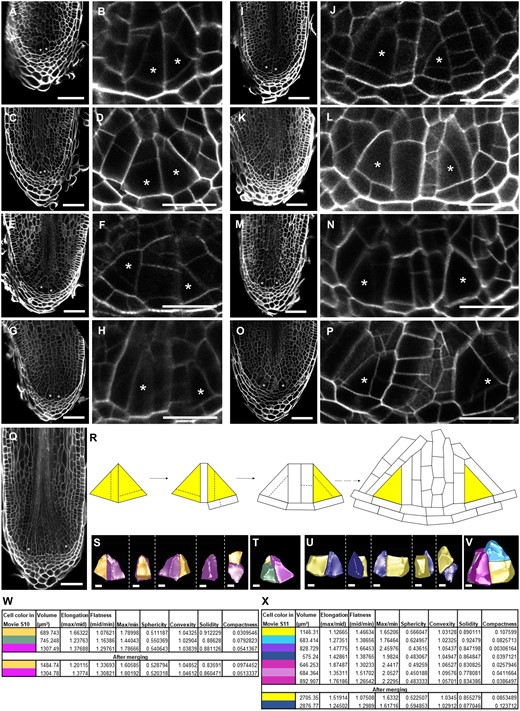
Early stages during S. moellendorffii root bifurcation. A–Q, Confocal images of different stages during branching sampled between 1 and 5 d in the root branching time course. B, D, F, H, J, L, N, and P, A magnification (scale bars: 20 µm) of the root in (A, C, E, G, I, K, M, and O; scale bars: 50 µm), respectively. Asterisks indicate the location of the presumptive ICs. A–D, Two ICs are next to each other. See Supplemental Figure S2, A–C for more examples. E–L, Two ICs are only separated by one or two layers of cells. See Supplemental Figure S2, D–F for more examples. M–Q, Further development of the two meristems, including enlargement of the root tip. The root in panel O is the same as in Figure 1G. R, Scheme showing the mechanism of root bifurcation as deduced from independent root samples during the early time points of root branching. Dashed lines indicate possible cell divisions. S–V, 3D-segmented ICs from panel A (S, T) or panel C (U, V). T and V include the presumptive daughter cells of the new ICs. Scale bars: 5 μm. See supplemental Movies S10 and S11 for a full overview. W–X, Cell shape analysis of ICs and IC daughter cells from roots in A or Supplemental Movie S10 and C or Supplemental Movie S11, respectively.
To assess the division spatially, we also performed 3D segmentation and shape analysis of the presumptive ICs in Figure 4. Similar as the ICs in nonbifurcating roots, the ICs were irregular in shape (Supplemental Figure S3). The neighboring ICs in Figure 4, A–D were different in size and shape (Figure 4, S, U, W, and X), indicating that this IC division was, at least spatially, not symmetric. We also observed that some neighboring cells have relatively thin cell walls in common with the presumptive IC, indicative for a recent cell division, and hence a rather fast succession of division events during bifurcation, again hindering the capturing of early stages. Such a thin cell wall can, for example, be seen in Figure 4, C–D, where a very faint horizontal line can be observed in the left IC. Three-dimensional segmentation showed that the ICs already underwent several divisions. Interestingly, merging the different daughter cells resulted in two groups of cells of similar size and shapes (Figure 4, T, V, W, and X; Supplemental Movies S10–S11). In Figure 4, A and B, the right IC probably underwent a recent cell division. Combination of the two daughter cells resulted in a cell size and shape that is similar to the left IC (Figure 4, T and W; Supplemental Movie S10). The ICs in Figure 4, C and D, likely underwent three to four cell divisions already, but are still positioned next to each other. Also in this case, merging the presumptive daughter cells to one cell resulted in two cells with similar size and shape (Figure 4, V and X; Supplemental Movie S11). Although this analysis was not able to prove a spatially symmetric cell division of the IC, it does support that, prior to bifurcation, two new ICs originate next to each other, possibly as a result of a spatially and functionally symmetric division of the original IC.
![Selaginella moellendorffii root branching transcriptome. A, Experimental set-up, showing sampled regions (dotted black lines: meristematic region; white: nonmeristematic [NM] region). Scale bars: 1 mm. B, Heatmap showing expression (log2 FC) of all root branching DEGs on the different days in the root branching course versus Day 0, or for the meristematic (M) versus NM region. Gray values indicate no significance (likelihood-ratio test with adjusted P-value [Benjamini and Hochberg false discovery rate corrected] ≥ 0.05). C, Overview of numbers of up- and downregulated DEGs at each time point during root branching. Note the decrease in number at the end of the time course, indicating a return to the initial state. D, Profiles of co-expression clusters based on WGCNA of the root branching DEGs. Clusters were grouped according to their shapes: dome and valley groups—the transiently up- and downregulated clusters, respectively; up and down groups—constitutively up- and downregulated clusters, respectively. Based on the peak position and shape, the dome group was further grouped into early peak, late peak, and broad peak subgroups. In each cluster, the magenta curve represents the average expression of all genes in the cluster, the green one represents the eigengene of the cluster.](https://oup.silverchair-cdn.com/oup/backfile/Content_public/Journal/plphys/190/4/10.1093_plphys_kiac402/1/m_kiac402f5.jpeg?Expires=1750284693&Signature=YbyhhBf7nTdnIHL6F6HgaQ8k5VEVkDqj0hZ-GwBAJnZW0e9W7UcjzePNdDhBjU8ctiCx7gOeY-jbWKIz6V1I9Ga9GYHI2xvQb8p-YTypteB09xZ9ePxLmhCNlVpOmsFBkGI5R~gvv7l327VCVwaOs-RUusCDxnNYGsx3OdqdtmkIhTKlBniY6TdFelZxHdk~nLCfr3RtO071TyuntHFIhlOBw2Oct8C2EX-BWFzWyCJYG0oBv1hHikEzOYiTEF6TXgFmxcVRpHbvXj3n2RDVktYiEMwHhq4CXDItqMUaYqhsXjvqpHzqeg3Z105DBOqrFFb5TnMLzp7S18Hamjkaag__&Key-Pair-Id=APKAIE5G5CRDK6RD3PGA)
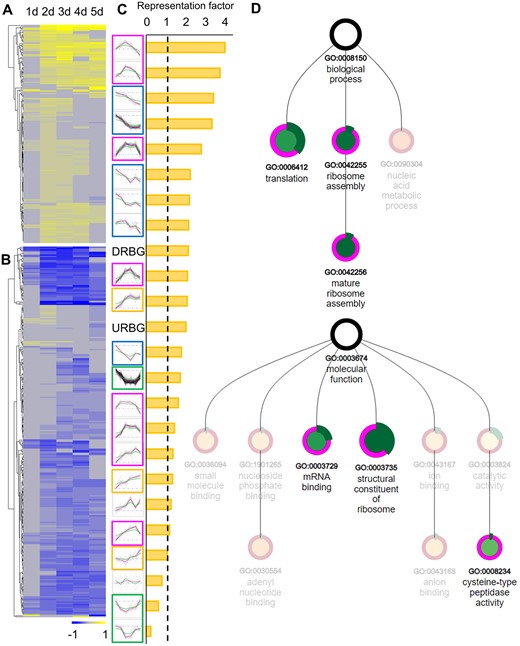
Selaginella moellendorffii root branching transcriptome. A, Experimental set-up, showing sampled regions (dotted black lines: meristematic region; white: nonmeristematic [NM] region). Scale bars: 1 mm. B, Heatmap showing expression (log2 FC) of all root branching DEGs on the different days in the root branching course versus Day 0, or for the meristematic (M) versus NM region. Gray values indicate no significance (likelihood-ratio test with adjusted P-value [Benjamini and Hochberg false discovery rate corrected] ≥ 0.05). C, Overview of numbers of up- and downregulated DEGs at each time point during root branching. Note the decrease in number at the end of the time course, indicating a return to the initial state. D, Profiles of co-expression clusters based on WGCNA of the root branching DEGs. Clusters were grouped according to their shapes: dome and valley groups—the transiently up- and downregulated clusters, respectively; up and down groups—constitutively up- and downregulated clusters, respectively. Based on the peak position and shape, the dome group was further grouped into early peak, late peak, and broad peak subgroups. In each cluster, the magenta curve represents the average expression of all genes in the cluster, the green one represents the eigengene of the cluster.
In the absence of genetically encoded markers, live imaging to confirm such divisions or to show that this results in the formation of two meristems is unfortunately not possible in S. moellendorffii. Still, in multiple samples at early time points, we could, based on the cellular pattern, clearly observe that each of the ICs produced their own distal daughter cells in the root cap (Figure 4, A and B; Supplemental Figure S2A), indicating that each of these two cells also underwent at least one additional formative division to cut off a root cap cell. Furthermore, we also observed multiple root tips in which the two ICs were very close to each other and separated by only one or two layers of short cells (Figure 4, E–L; Supplemental Figure S2, D–F). These layers seemed to originate from daughter cells of the new ICs. Based on these observations, it is of high likelihood that the two ICs originally neighbored each other, supporting the hypothesis that dichotomous root branching in S. moellendorffii is a result of a symmetric division of the original IC. In this scenario, the two new ICs cut off daughter cells in different directions, forming two new meristems (Figure 4, M–R). These two new meristems or root primordia are initially still embedded in the macroscopically unbranched root, which radially expands because of the doubled meristem (Figure 4, M–Q), but later on grows out to form two branches as described before (Otreba and Gola, 2011).
The S. moellendorffii root branching transcriptome
Transient gene expression profiles support a return to the initial meristem state
Based on the confocal imaging, almost 40% of the root tips formed two clearly distinguishable new meristems 5 d after the first branching (Figure 1H). Hence, we supposed that programs to initiate dichotomous branching mainly occur before this time point. To identify possible molecular mechanisms with a role in root branching initiation in S. moellendorffii, we took advantage of the characterized root branching assay for an RNA-seq experiment and sampled root tips on each day from 0 to 5 d after the first branching (time point 0). More specifically, 300-µm apical parts were sampled to enrich for the meristematic region, while nonmeristematic root regions were sampled separately (Figure 5A).
Considering a fold change (FC) of at least two and an adjusted P-value (BH FDR corrected) of maximum 0.05, 6,601 DEGs were retrieved between the meristematic and nonmeristematic part. 3,410 genes were more highly expressed in the apical parts and were therefore designated as “meristem-enriched genes.” Within the branching time course, however, only 15 genes were differentially expressed with a |FC| > 2 (adjusted P ≤ 0.05; LRT). None of these DEGs had a straightforward annotation (Supplemental Table S1). This low number is not unexpected: the individual samples were most likely only different in a small region where bifurcation was initiated. Differences in gene expression may even only occur in one cell, and hence become diluted within the sampled tips. Still, 1,553 genes were significantly (adjusted P ≤ 0.05; LRT) affected over the branching time course (Figure 5, B and C; Supplemental Table S1). In addition, many of these genes were differentially expressed at multiple time points (Figure 5B; Supplemental Table S1), corroborating their relevance. Interestingly, the number of DEGs at first steadily increased during the time course and peaked on 2 and 3 d after the first branching, and then decreased toward the end of the time course (Figure 5C). Hence, the final state showed less differential expression and was more similar to the original state.
To get a better insight into the expression profiles of the 1,553 DEGs affected over the branching time course, a cluster analysis via weighted gene co-expression network analysis (WGCNA) was performed (Langfelder and Horvath, 2008). The analysis revealed 22 main expression profiles (Figure 5D), which we further grouped according to their shapes. As such, the clusters could be classified into four major groups. We designated the transiently up- and downregulated gene clusters as “dome” (further grouped into early peak, late peak and broad peak subgroups) and “valley,” respectively, and the constitutively up- and downregulated clusters were named “up” and “down,” respectively. Only a few genes could not be classified into any of these groups (Figure 5D). Overall, the majority of the 1,553 genes clustered in the dome (490) or the valley (560) groups, which fits the decreased number of DEGs observed toward the end of the time course.
In summary, both the number of DEGs per time point and the clustering of the expression profiles support a transient expression pattern, which might be associated with developmental states at the ontogenetic level: a starting state with a single meristem rapidly initiating bifurcation or evolving into an early bifurcation state and then evolving again into two separated single meristems resembling the initial state. In this respect, a part of the observed differential expression probably reflects a change in the abundance of certain cells or tissues, and not per se differential expression within certain cells.
Root branching transcriptome to identify core meristem-enriched genes
The Selaginella root branches in association with the development of two root meristems. Therefore, especially at an early stage with two meristems, there should be relatively more meristem cells in the root tip, which should translate into a higher abundance of transcripts of meristem genes. As such, when the meristem bifurcates, transcripts of genes specifically expressed, or repressed, in the IC or in its neighborhood, would be relatively more, or less, abundantly present. Indeed, at an early stage, two young meristems are present within a nonexpanded root tip. When the two meristems and the root tip enlarge (Figure 4), this abundance would get diluted and evolve toward the end of the time course to a relative expression level as in a nonbifurcated meristem. Within the 1,553 DEGs affected over the branching time course, 452 of the 3,410 meristem-enriched genes were present (Supplemental Table S1), and hence, while this is still an overrepresentation (Figure 6, A–C; Supplemental Table S2), a big portion of the meristem-enriched genes were not differentially expressed during meristem bifurcation. We presume that the group of meristem-enriched genes as such might still encompass many genes that do not associate with the meristem itself, but with another part of the root tip.
Overview of root branching meristem-enriched genes. A and B, The heatmaps show the expression (log2 FC) of meristem-enriched genes upregulated (A) or downregulated (B) during root branching. C, Representation of the meristem-enriched genes in different expression clusters. The meristem-enriched genes were in particular overrepresented in transiently upregulated (dome) clusters in magenta frames and constitutively downregulated (down) clusters in blue frames. Orange and green frames indicate constitutively upregulated (up) and transiently downregulated (valley) clusters, respectively. DRBG, Downregulated root branching DEGs; URBG, Upregulated root branching DEGs. D, Enrichment analysis of the meristem-enriched genes that were upregulated during root branching. The graph shows enriched biological process and molecular function gene ontology (GO) terms. Node size is scaled by the P-value of the enriched GO term, and node color (from green to red) is determined by the enrichment fold of the term. Negative enrichment folds are faded. The outer green band is determined by the subset ratio. The graph was generated by PLAZA version 4.5 (https://bioinformatics.psb.ugent.be/plaza/versions/plaza_v4_5_dicots/).
We next compared the root meristem-enriched genes from our dataset with genes expressed in the shoot apical cell area or within the shoot meristem core (excluding the apical cell), as previously assessed in S. moellendorffii via laser capture microdissection by Frank et al. (2015). Interestingly, a high overlap could be observed in particular between the root meristem-enriched genes and the shoot apical cell genes (Table 2), indicative for common mechanisms between the Selaginella root and shoot meristem. The significance of the overlap became higher if only genes with the same directionality in their expression pattern were considered (Table 1), corroborating their similar regulation in the root and shoot meristem. Also the DEGs during the root branching time course showed a high overlap with the shoot meristem genes, which could be almost exclusively attributed to the genes that were upregulated during the time course (Table 1, Supplemental Table S1). Only withholding root meristem-enriched genes that were upregulated during root branching, slightly improved the significance (Table 1).
Overlap between DEGs from our root meristem and root branching time course and the shoot apical meristem apical cell and core (meristem without apical cell) datasets from Frank et al. (2015), as indicated by the P-value of the Fisher exact test
| Root meristem | Root meristem-up (meristem-enriched genes) | Root meristem-down | Root branching time course | Root branching time course-up | Root branching time course-down | Root meristem-enriched genes upregulated during root branching | |
|---|---|---|---|---|---|---|---|
| SAM_AC | 2.84E-52 | 2.31E-10 | 5.59E-37 | 1.08E-11 | 4.74E-24 | 0.785978169 | 1.56E-33 |
| SAM_AC_UP | 2.73E-31 | 2.09E-66 | 1 | 8.40E-38 | 2.55E-54 | 0.168042067 | 2.94E-61 |
| SAM_AC_DOWN | 9.04E-26 | 0.999999983 | 1.50E-64 | 0.972646833 | 0.853754181 | 0.950343777 | 0.899158476 |
| SAM_core | 1.66E-11 | 0.1941765 | 4.14E-13 | 3.72E-05 | 1.57E-07 | 0.397555177 | 0.036146755 |
| SAM_CORE_UP | 1.28E-05 | 7.32E-10 | 0.965385017 | 0.004971335 | 1.09E-05 | 0.939146006 | 0.001642662 |
| SAM_CORE_DOWN | 1.69E-07 | 0.999955348 | 3.18E-19 | 0.00156248 | 0.000857833 | 0.17612269 | 0.733421609 |
Bold values indicate P < 0.05.
Genes upregulated in both the root meristem and the branching time course could be expected to be associated with the root meristem function and might be of special interest. The set of upregulated root branching meristem-enriched genes (Figure 6A) includes 173 genes, which are especially present in the early responsive dome clusters (Supplemental Table S1). Likewise, root meristem-enriched genes are overrepresented in such early responsive dome clusters (Figure 6C). The early upregulation of these genes indicates that two young meristems are formed early, which then mature toward the end of the branching time course.
To get insights into the function of the meristem-enriched genes that were differentially regulated during the root branching, GO, InterPro, and MapMan term enrichment analyses were performed (Supplemental Tables S3 and S4). For the 173 genes that were upregulated during root branching, these analyses clearly showed an enrichment in terms related to cell growth, and more particularly, in ribosome- and translation-related terms (Figure 6D; Supplemental Table S3). Correspondingly, these 173 genes included a broad range of ribosomal proteins-encoding genes (Supplemental Table S1). Interestingly, such ribosomal-related genes or terms are typically enriched in young meristematic angiosperm root cells as well. For example, Arabidopsis single-cell transcriptomic studies have shown that ribosomal protein-encoding genes are enriched in meristematic clusters (Ryu et al., 2019; Shulse et al., 2019; Zhang et al., 2019). Hence, the 173 genes seemed to be associated with young meristematic cells, underlining and validating the value of the root branching dataset to select core-meristem genes.
Candidate regulators of dichotomous root branching
To identify possible regulators in the root branching process, we queried all 1,553 DEGs during the root branching time course for transcription factors and orthologs of genes with well-described roles in Arabidopsis root meristem maintenance or LR branching, including auxin and cytokinin signaling genes, and receptor kinases and cell cycle genes (Supplemental Table S5). Transcription factors were collected via PlantTFDB v5 (Tian et al., 2019). As we noticed that not all AUXIN RESPONSE FACTORS (ARFs) and B-type ARABIDOPSIS RESPONSE REGULATORS (ARRs) transcription factors were recognized in the PlantTFDB, we also looked for their orthologs and included them in the query (Supplemental Table S5).
Among these possible regulators, 40 were differentially expressed during the root branching time course (Figure 7A) and might be involved in the regulation of dichotomous root branching. These included multiple hormone-related genes, such as auxin-responsive ARF genes, cytokinin-regulating A-type ARR genes, a PIN-FORMED (PIN) auxin transporter, an ARABIDOPSIS HISTIDINE KINASE (AHK) cytokinin receptor, a gibberellic acid signaling DELLA gene, ethylene signaling ETHYLENE-INSENSITIVE3-LIKE (EIL) genes and a brassinosteroid signaling BRI1-EMS-SUPPRESSOR1 (BES1) gene.
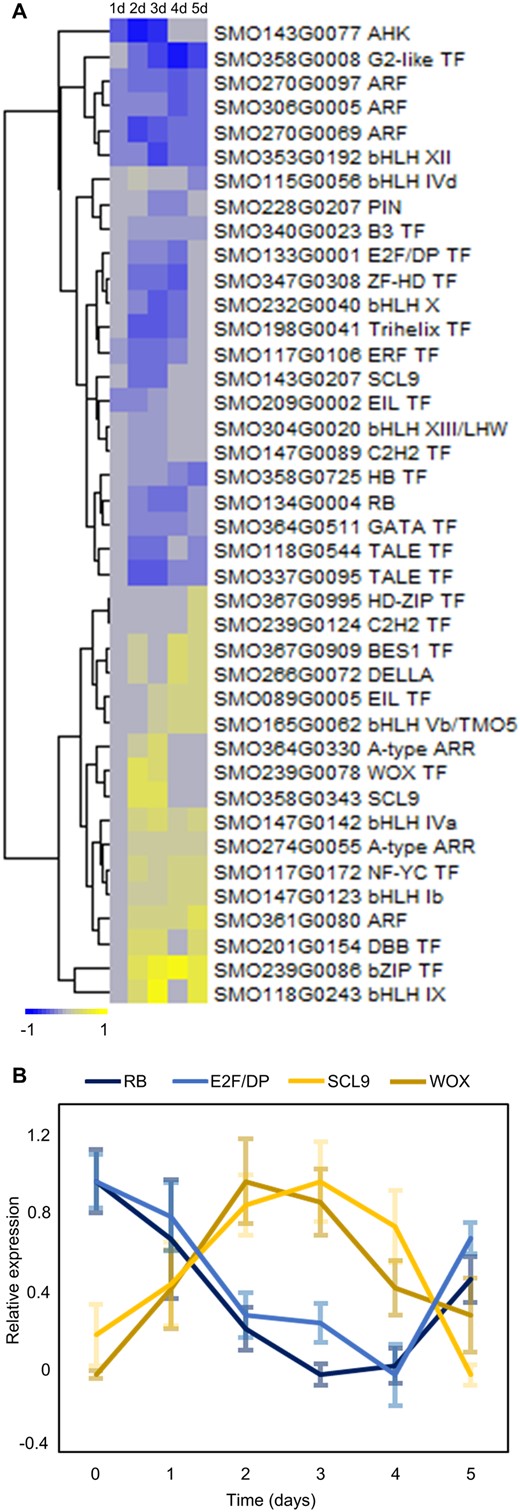
Expression profiles of the transcription factor-encoding DEGs and other genes with their Arabidopsis homologs known to be involved in root meristem control or LR formation. A, Heatmap showing the expression (log2 FC) profiles. The description shows the queried gene family (Supplemental Table S5) or the transcription factor type according to the Plant Transcription Factor Database (PlantTFDB) v5. For the GRAS (including DELLA and SCL) and bHLH transcription factors, subfamilies according to the analyses of Wang et al. (2016) or Pires and Dolan (2009), respectively, are shown. Members of the bHLH Vb/TMO5 and bHLH XIII/LHW subfamilies were verified in the analysis of Lu et al. (2020). B, Relative expression of the RB (SMO134G0004), E2F-DP (SMO133G0001), SCL9 (SMO358G0343), and WOX (SMO239G0078) gene. Error bars indicate SE (n = 4).
We also noticed the presence of putative orthologs of both TARGET OF MONOPTEROS5 (TMO5) and LONESOME HIGHWAY (LHW). In Arabidopsis, the two form a dimer and are together crucial for vasculature initiation (De Rybel et al., 2013, 2014).
Interestingly, only a few transcription factor-encoding DEGs showed an early upregulation. In particular, a WUSCHEL RELATED HOMEOBOX (WOX; SMO239G0078) and a SCARECROW-LIKE9 (SCL9; SMO358G0343) gene showed a strong early induction (Figure 7A) and were highly co-expressed (Figure 7B). In contrast, a RETINOBLASTOMA (RB) gene (SMO134G0004), in Arabidopsis a negative interactor of SCR (Cruz-Ramírez et al., 2012), and an E2F-DP gene (SMO133G0001), involved in the same pathway, showed a downregulated valley profile and were inversely associated to the WOX and SCL9 gene (Figure 7B).
High cell division activity in young vasculature
We were intrigued by the overrepresentation of meristem-enriched genes in the downregulated DEGs during the root branching time course (Figure 6C), which could point to a loss of meristem identity or meristem activity during the bifurcation process. In the GO, InterPro and MapMan term enrichment analyses of this group, we noticed multiple terms related to cell division, including “microtubule binding,” “cytokinesis,” and “cell cycle” (Supplemental Table S4). Indeed, a lot of cell cycle-related genes could be found in the meristem-enriched genes belonging to the valley or down clusters (Supplemental Table S1). Possibly, cell divisions in the original meristem and the IC stopped or at least decreased, while new meristems only took over toward the end of the time course. To verify this, we performed 5-ethynyl-2′-deoxyuridine (EdU) staining on S. moellendorffii root tips, marking all cells that divided during treatment with EdU. In contrast to our presumptions, we did not observe a decrease in cell division activity between different samples over the root branching time course (Figure 8). The distribution of cell divisions was similar in nonbifurcating roots (Figure 8, A–C), roots with two ICs neighboring each other (Figure 8, D–F) or separated by one or two (Figure 8, G–I) or more cells (Figure 8, J–L): in all samples, cell division activity was prominent in the region around the IC and in a large region of the vasculature. Also the IC itself, considering an EdU treatment of only 7 h, showed a relative high activity: of 168 analyzed ICs, 55 (33%) showed the EdU stain, and underwent at least the S-phase during this short treatment. This frequency was similar for the different stages, and could therefore not explain the differential expression in cell division-related gene expression. This may rather be explained by the high cell division activity in the young vasculature (Figure 8, Supplemental Movies S12–S13), because at 0 d of the branching time course, a relative higher amount of vasculature tissue, and hence dividing cells, is present within the sample compared to later samples. Indeed, in the 0-d samples, two vascular strands are present within one tip (e.g. Figure 2A). In later samples, despite a possible bifurcation initiation, there is still only one vascular strand present (e.g. Figure 4, A–P), while at the end of the time course, samples may have again a spliced vasculature (e.g. Figure 4Q). Hence, the valley and down clusters seem to partially contain genes expressed in the vasculature, and might be used to query vasculature-related genes. For example, the putative LHW ortholog, in Arabidopsis known to be expressed in the vasculature (De Rybel et al., 2013; De Rybel et al., 2014) showed downregulation during the branching time course (Figure 7A). This could also explain why downregulated genes during the branching time course did not show a significant overlap with genes differentially expressed in the shoot apical cell (Table 1).
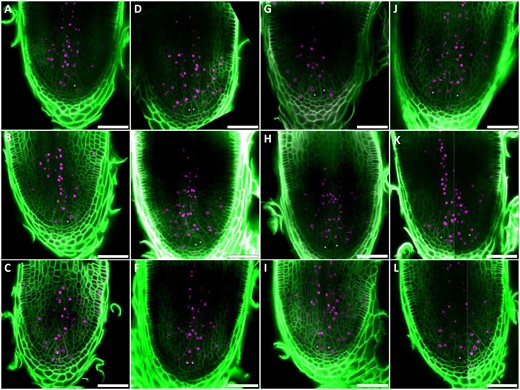
EdU labeling during S. moellendorffii root bifurcation. Confocal images of root meristems treated for 7 h with 7.5 µM EdU at different stages during branching are shown. Nuclei of cells that underwent S-phase during these 7 h, incorporated EdU (magenta). Cell walls were stained with Calcofluor-white (green). Scale bars: 50 µm. White asterisks indicate the location of the ICs. A–C, A single IC in each root tip. D–F, Two adjacent ICs formed by a symmetrical division. G–I, Two ICs are only separated by one or two layers of cells. J–L, Further development of the two meristems, including enlargement of the root tip. Panels K and L are composed of two different z-stack planes (see Supplemental Movies S12 and S13 for the full stacks), each containing an apical cell.
Discussion
Lycophyte roots branch dichotomously as a result of bifurcation of the apical meristem. Although activities of the IC have been assumed to play a key role in this process, especially in branching initiation, it remained unclear how its cellular activities are associated with root bifurcation in the lycophyte S. moellendorffii. Previous reports on Selaginella root bifurcation have suggested that the single root apical IC undergoes segmentation and becomes indistinguishable, which is followed by the initiation of two new ICs at the flanks and the formation of two new root meristems (Imaichi and Kato, 1989; Otreba and Gola, 2011). On the other hand, Barlow and Lück (2004) hypothesized that, after a set of rigid cell divisions, a derivative of the IC becomes a new IC to form the second root meristem. In contrast, our results point out that root bifurcation starts with a symmetric division of the original IC, which gives rise to two new ICs. Such a division to initiate dichotomous root branching in Selaginella has never been reported. Additionally, it has been stated that a longitudinal symmetric division of a tetrahedral cell is unlikely to occur, because the surface area of the inserted cell wall is relatively big, which would be inefficient (Cooke and Paolillo Jr, 1980; Gola, 2014). However, we showed that the IC is irregular, in general not tetrahedral and possibly changing in shape over time. This might occur by the spatial arrangement with neighboring cells or after cell divisions. The IC does indeed divide (Fujinami et al., 2017), as we confirmed in this study, and therefore the shape could change after each cell division. As such, ICs might acquire geometries that are better suited to undergo symmetric divisions.
Still, there could be other factors controlling the IC to undergo cell division to initiate dichotomous root branching. Because the stem cell is surrounded by multiple cells in the meristem, interactions with and feedback from the neighboring cells may also contribute to the first division initiating root branching in land plants. In Arabidopsis, the auxin flux from surrounding endodermal cells into the founder cells allows the latter to transition into LR initiation (Dubrovsky et al., 2008; Marhavý et al., 2013; Cavallari et al., 2021), also showing a critical role of auxin in the control of the first asymmetric division. However, we detected a differential downregulation of multiple auxin-responsive ARF genes in the branching time course, suggesting a reduction in the auxin response during the process. Supportive of this, we previously found that Selaginella root branching is not induced by auxins (Fang et al., 2019). On the other hand, this lower expression might also be caused by a different abundance of certain tissues or cells during the root branching time course. The abundance of vascular tissues, for example, is lower in the middle of the time course, which could explain the lower expression. Indeed, cell division-related genes showed a similar profile, while we observed that cell divisions were more frequent in young vascular tissue.
During Arabidopsis root growth, (lateral) root branching formation takes place periodically: protoxylem cells in the basal meristem undergo temporal oscillations in auxin concentrations and auxin-responsive gene expression levels, which allows these cells to transport these priming signals to the pericycle cells, which also get primed, forming competent sites to initiate LRs (De Smet et al., 2007; Moreno-Risueno et al., 2010; Van Norman et al., 2014; Xuan et al., 2016; Laskowski and ten Tusscher, 2017). In Selaginella, roots also branch repetitively but dichotomously (Fang et al., 2019). We found that this branching coincides with a transient gene expression profile, and recurrent branching events might therefore show a cyclic expression profile as well. Possibly, this involves priming signals, which may be included in our dataset. However, at least a part of the genes differentially expressed during the branching time course seem to be appear by consequence of the meristem duplication and therefore do not show up by the induction of expression in certain cells but rather by doubling the source cells in the meristem. This was illustrated by the high number of ribosomal protein-encoding genes that showed a higher transcript level during the time course, which, based on single-cell RNA-seq data, typically associates with meristem cells. As such, our root branching dataset can be a valuable resource for candidate genes expressed in the core meristem. Likewise, based on the profiles of genes with a role in cell division and the high abundance of cell divisions in the vasculature, candidate genes associated with the vasculature might be retrieved from the downregulated or valley genes, as more vasculature tissue is present at the start and the end of the branching time course. For example, we detected putative LHW and TMO5 orthologs, together crucial for vasculature initiation (De Rybel et al., 2013; De Rybel et al., 2014). The Selaginella genes phylogenetically cluster effectively with the LHW and TMO5 clades (Lu et al., 2020). Their control of vasculature initiation is shown to be highly conserved in all vascular plants, as shown via complementation experiments (Lu et al., 2020). In Arabidopsis, the two transcription factors have a different spatial expression pattern and overlap at the vascular domain (De Rybel et al., 2013), with TMO5 having a more prominent expression at the vasculature initials, while LHW is more equally distributed over the vasculature (Wendrich et al., 2020). This fits our presumption that valley or downregulated genes like LHW are expressed in the vasculature, while upregulated genes like TMO5 have higher expressions close to the IC.
It has been hypothesized that lycophyte roots have a shoot origin (Gensel et al., 2001). The high overlap in DEGs between the root meristem in our dataset and the shoot apical meristem apical cell of the dataset of Frank et al. (2015) supports this hypothesis. The common origin could moreover result in shared developmental mechanisms between the shoot and root meristem. This was for instance shown in the lycophyte Lycopodium, where bifurcation of both meristems starts with the emergence of mitotically active cells in a similar quiescent region (Fujinami et al., 2021). In contrast, Selaginella bifurcation of the shoot meristem seems to begin with a symmetric division of the IC (Christopher and Andrew, 2009; Jones and Drinnan, 2009), although it is not sure whether this division event effectively results in two meristems (Harrison and Langdale, 2010). Still, we also observed in the root putative symmetric divisions of the IC, further supporting the shoot origin of the root in lycophytes. It also underlines the possible differences in root anatomy and bifurcation mechanisms within the lycophyte clade, as not all lycophyte subclades have single ICs, and supports that roots originated multiple times during the evolution of lycophytes (Gensel et al., 2001; Fujinami et al., 2017; Fujinami et al., 2020).
Although roots originated multiple times during evolution, it is hypothesized, based on comparative transcriptomics studies, that a common rootless ancestor of vascular plants possessed an inheritable genetic tool kit that descendants recruited for similar root meristem-related biological processes, resulting in a highly conserved root developmental program within vascular plants (Huang and Schiefelbein, 2015; Ferrari et al., 2020). In support of this hypothesis, we did find in our dataset multiple homologs of genes with important roles in the Arabidopsis meristem. For example, we detected type-A ARRs and ARF genes. Type-A ARRs, negatively regulating cytokinin signaling, are important for stem cell specification in the Arabidopsis root meristem (Müller and Sheen, 2008), and several auxin-induced ARFs are important to control root stem cell specification (Ding and Friml, 2010) or LR initiation, leading to a new root meristem (Okushima et al., 2005; De Rybel et al., 2010).
We furthermore identified homologs of some known root stem cell controllers in Arabidopsis, including WOX, RB, and E2F-DP family members, as candidate regulators of dichotomous root branching in Selaginella. These gene families encompass important stem cell regulators. In Arabidopsis, WOX5 and RETINOBLASTOMA-RELATED1 (RBR1) are important for stem cell functioning or fate (Sarkar et al., 2007; Cruz-Ramírez et al., 2012). RBR1 furthermore interacts with E2F transcription factors (Wildwater et al., 2005). Noteworthy, RBR1 and E2FA show a high degree of co-expression (Magyar et al., 2012), which we also observed for their S. moellendorffii homologs during the root branching time course. This and the presence of multiple homologs of known stem cell regulators support as such the existence of a, possibly partial, conserved genetic program in root stem cell or meristem establishment or maintenance.
It is important to note, however, that the Selaginella WOX gene does phylogenetically not directly cluster with WOX5: SMO239G0078 was previously annotated as SmWOXII, and sisters the WOX9/11 intermediate-clade-WOX (IC-WOX; Nardmann et al., 2009; Nardmann and Werr, 2012). WOX5, in contrast, is part of the WUS subclade. As a matter of fact, WOX functioning in angiosperm stem cell control and its action via transcriptional repression is restricted to the WUS subclade (Dolzblasz et al., 2016; Zhou et al., 2018), which is not present in S. moellendorffii (Nardmann et al., 2009; Nardmann and Werr, 2012; Zhang et al., 2017; Wu et al., 2019). Thus, the presence of the Selaginella WOX as a branching DEG may imply a different mechanism, possibly as a transcriptional activator (Motte et al., 2020). An IC-WOX gene has also been found to be specifically expressed in the root founder cells in the fern Ceratopteris richardii (Nardmann and Werr, 2012), supporting a possible role of this clade in root stem cell establishment as well.
Overall, we generated a relevant dataset, in which multiple candidate regulators of root meristem bifurcation in S. moellendorffii could be identified that possibly show a conservation with similar pathways in seed plants. In contrast to existing S. moellendorffii datasets, which mainly focused on tissue-specific expression, we here characterized expression patterns during a developmental process in which new (root) stem cells are established. Although the molecular research using S. moellendorffii is still at its infancy, this dataset can be a useful resource to identify possible root meristem- and stem cell-related Selaginella or lycophyte genes. Because of the pioneering evolutionary position of this lineage during colonization of land by plants, this resource can be very useful to identify conserved and early (root) stem cell regulators, and to unravel the early pathways that were at the base of pluripotency.
Materials and methods
Plant materials
Selaginella moellendorffii plants were obtained from the lab of Jo Ann Banks, Purdue University. Plants were grown aseptically under a 16-h light/8-h dark photoperiod at 20.25–43.2 μmol/m2/s in a 24°C growth chamber and roots developed after the transfer of explants to fresh medium as previously reported (Fang et al., 2019).
Microscopy
To track root branching events, roots were observed daily starting from their appearance on rhizophores using a Leica S9I stereomicroscope.
For whole-mount confocal imaging, S. moellendorffii root tips were first fixed in 50% (v/v) methanol and 10% (v/v) acetic acid, and then subjected to modified pseudo-Schiff propidium iodide (mPS-PI) staining described by Truernit et al. (2008). Confocal imaging was performed using a Zeiss LSM 5 Exciter microscope (25× water immersion objective lens) with an argon ion laser at 488/505 nm as the excitation/emission wavelengths, or a Leica SP2 confocal microscope (63× water corrected objective [NA 1.2] lens and pinhole = 1 AU) with an argon ion laser at 514/600–650 nm. Alternatively, modified staining was performed with a small change in the composition of chloral hydrate solution (8 g chloral hydrate, 3 mL glycerol, and 1 mL water [8:3:1]). Z-stacks were taken for all samples to allow collective detection of the meristematic region present at different planes. A subset of samples, including the ones used for segmentation, were, after fixation, subjected to amylase treatment in order to digest starch granules. Root tips were washed 3 times with water and subsequently treated overnight with α-amylase at a concentration of 300 U/mL in a buffer containing 20 mM phosphate pH 7.0, 2 mM NaCl, 0.25 mM Ca2Cl. Samples were then washed with water and fixed again in 50% (v/v) methanol and 10% (v/v) acetic acid for 1 h. Samples were subsequently washed 2 times with 1X PBS, transferred to ClearSee solution (Kurihara et al., 2015) and gently stirred for 1 week. Finally, the samples were stained for 1 h in ClearSee solution containing 0.1% (w/v) Calcofluor White and were washed afterwards for 30 min in ClearSee solution before imaging. Confocal imaging of the Calcofluor White stained roots was conducted using 405 nm excitation and 425–475 nm wavelength detection using a Leica SP8X system. Confocal stacks generated for segmentation were imaged using a 63× water-corrected objective (NA of 1.2) and a pinhole of 0.6 AU. Stacks were further processed using MorphoGraphX (Barbier de Reuille et al., 2015) to identify ICs and to obtain clear sections showing the meristematic organization.
For histological sections, root tip samples were fixed in 1% (v/v) glutaraldehyde and 4% (w/v) paraformaldehyde, followed by dehydration and embedding in Technovit 7100 resin (Heraeus Kulzer) according to the manufacturer’s instruction. Transparent strips were used to orient tissues for proper orientation (Beeckman and Viane, 2000). Two-micrometer sample sections were cut using a Leica Reichert-Jung 2040 Autocut Microtome, dried on object glasses using a hot plate (20–40°C), stained for cell walls with 0.05% (w/v) toluidine blue or ruthenium red (Acros Organics) for 10 min and then rinsed with water to wash off excess dyes. The sections were then mounted in Depex medium (Sigma) and covered with cover slips for observation and photography using an Olympus BX53 microscope.
For serial block face scanning electron microscopy (SBF-SEM), samples were fixed using 2% (w/v) paraformaldehyde and 2.5% (v/v) glutaraldehyde in 0.1 M Sodium Cacodylate pH 7.4. Next, samples were processed en-bloc using a ROTOTO staining as described previously (Fendrych et al., 2014). Finally, resin-embedded root tips were mounted on aluminum specimen pins (Melotte) using conductive epoxy (Circuit Works), and coated with 5 nm of Pt in a Quorum sputter coater. Next, samples were placed in the Gatan 3View 2XP in a Zeiss Merlin SEM for imaging at 1.6 kV using the Gatan Digiscan II BSED detector. The system was set up to automatically take 1,000 images at a pixel-size of 15 nm, cutting 100-nm sections of the block-face between each image, resulting in a volume of 150 µm × 150 µm × 100 µm.
For registration of the 3D image stack, IMOD (http://bio3d.colorado.edu/imod/) was used. Orthogonal views were obtained in Fiji (http://fiji.sc/Fiji). Segmentation was done using Microscopy Image browser (http://mib.helsinki.fi/) and rendering was done using Imaris (Bitplane).
Extraction of IC geometry
Extraction of IC geometry was performed using MorphoGraphX (Barbier de Reuille et al., 2015). Confocal images were prepared for segmentation using a Gaussian blur of 0.5 in the X, Y, and Z directions. Segmentation was performed using the ITK watershed auto seeded algorithm with a threshold of 800 and segmentation errors were manually corrected. Three-dimensional cell meshes were constructed for the region of the root containing the IC, using the process marching cubes 3D with a cube size of 0.5, and 50 smooth passes at the time of mesh generation to minimize alterations to the mesh structure (Bassel, 2015). All other cells in the mesh were then deleted to isolate the IC, which was subjected to a further five smooth passes using the smooth mesh tool to facilitate qualitative visualization. Shape analysis measures were computed in MorphoGraphX using the tools “Display Shape Axis 3D” (Elongation, Flatness, Eccentricity) or “Lobeyness Measures 3D” (Compactness, Convexity, Sphericity, and Solidity).
EdU staining
To visualize cell division, explants with roots were transferred to medium containing 7 µM EdU. After 7 h, roots were collected and fixed immediately in 4% (w/v) paraformaldehyde for 2 h under vacuum. Subsequently, roots were transferred to a 0.3% (v/v) Triton X-100 in 4% (w/v) paraformaldehyde solution for another 1.5 h under vacuum conditions. The roots were treated overnight with α-amylase at a concentration of 300 U/mL in a buffer containing 20 mM phosphate pH 7.0, 2mM NaCl, 0.25 mM Ca2Cl, subsequently fixated once more in 4% (w/v) paraformaldehyde for 1 h under vacuum conditions and transferred to ClearSee. In between each treatment, root tips were washed in 1X PBS. After a week of clearing in ClearSee, cell walls were stained using a 0.1% (w/v) Calcofluor white ClearSee solution for 1 h. Following three 5-min washes in 1X PBS, the Click-iT EdU staining kit (C10337, Invitrogen, Carlsbad, CA, USA) was used to fluorescently label the incorporated EdU according to the manufacturer’s protocol. Finally, the stained root tips were washed 3 times in 1X PBS and transferred into ClearSee solution for further clearing and preservation prior to confocal analysis.
Confocal imaging of EdU-stained roots was performed using a Zeiss LSM710 confocal microscope (40× water immersion objective lens, pinhole = 1AU) with an argon ion laser at 488/493–628 nm as the excitation/emission wavelengths to visualize the Alexa Fluor 488-labeled EdU and a diode laser at 405/410–483 nm to visualize the Calcofluor white-stained cell walls.
RNA-seq
Sampled roots in the time course (300 root tips per sample, four biological repeats per time point) were cut off using a pair of stainless microscissors and then stored in RNAlater® RNA Stabilization Solution (Thermo Fisher Scientific) according to the manufacturer’s instruction. Subsequently, microdissection was performed to collect root apices of 0.3 mm long, as well as nonmeristematic regions between the apices and branching point for the 5-d post first branching samples. The samples were then collected in 2-mL RNase-free Eppendorf tubes with an RNase-free metal ball (diameter: 5 mm, sprayed by RNaseZap™ RNase Decontamination Solution [Invitrogen™, Thermo Fisher Scientific]) and frozen in liquid nitrogen. After collection, samples were stored at −70°C.
For RNA extraction, samples were ground 3 times using a QIAGEN Retsch TissueLyser (30 Hz, 30 s). RNA extraction was done via TRIzol™ reagent (Thermo Fisher Scientific) and the RNeasy Plant Mini Kit (Qiagen) according to the provided protocols.
RNA concentration and purity were determined spectrophotometrically using a Nanodrop ND-1000 (Nanodrop Technologies), and RNA integrity was assessed using a Bioanalyzer 2100 (Agilent). Per sample, an amount of 250 ng of total RNA was used as input. Using the Illumina TruSeq Stranded mRNA Sample Prep Kit (protocol version: Part # 15031047 Rev. E - October 2013), poly-A containing mRNA molecules were purified from the total RNA input using poly-T oligo-attached magnetic beads. In a reverse transcription reaction using random primers, RNA was converted into first strand cDNA and subsequently converted into double-stranded cDNA in a second strand cDNA synthesis reaction using DNA Polymerase I and RNase H. The cDNA fragments were extended with a single “A” base to the 3′ ends of the blunt-ended cDNA fragments, after which multiple indexing adapters were ligated, introducing different barcodes for each sample. Finally, enrichment PCR was carried out to enrich those DNA fragments that have adapter molecules on both ends and to amplify the amount of DNA in the library. Sequence-libraries of each sample were equimolarly pooled and sequenced on Illumina HiSeq 4000 (SBS 300 cycles, Paired End Reads:151-8-8-151) at the VIB Nucleomics Core (www.nucleomics.be).
Expression analysis
We used two versions of S. moellendorffii annotated genomes: the NCBI version (Annotation Release 100, released in 2018, containing 33,283 genes) and the JGI version (v1.0, released in 2007, containing 22,285 genes). While the former is the most recent and based on transcriptome data more correctly mapped, the JGI version is more widely used in bioinformatic tools. Therefore, we performed the mapping/alignment based (1) on NCBI if there was a 1:1 BLAST hit between NCBI and JGI annotations (and including the corresponding JGI identifiers), and (2) on JGI for genes that were uniquely present in the JGI annotation. Counts were quantified using Salmon (Patro et al., 2017) and normalization was done using the DESeq2 R package (Love et al., 2014). To correct for the batch effect, Limma (Ritchie et al., 2015) was applied.
Differential analyses of the count data were performed using DESeq2 (Love et al., 2014), only considering normalized read counts ≥ 10. PCA was used to identify and omit outliers within the biological repeats, and differential gene expression was analyzed using a multiple factor analysis. The expression during branching was assessed by a likelihood-ratio test (LRT; Supplemental Table S1). DEGs were selected based on an adjusted P-value (Benjamini and Hochberg [BH; Benjamini and Hochberg, 1995] false discovery rate [FDR] corrected) ≤ 0.05. In addition, meristem DEGs were only retained in case of a |FC| ≥ 2. Heatmaps showing expression profiles were generated using the R package “pheatmap.” A WGCNA was performed according to Langfelder and Horvath (2008) in the pipeline of DESeq2.
Statistical significance of the overlap between two groups of genes was calculated via the Fisher exact test. Representation factors were calculated by dividing the number of overlapping genes by the number of expected genes in the overlap.
Data for GO, InterPro, and MapMan term enrichment were computed using the “Workbench” function of the Dicots PLAZA tool version 4.5: https://bioinformatics.psb.ugent.be/plaza/versions/plaza_v4_5_dicots/ (Vandepoele et al., 2013; Van Bel et al., 2018), with default settings.
Homology or orthology between Arabidopsis and S. moellendorffii genes was inferred based on the gene families in the Dicots PLAZA version 4.5.
Accession numbers
RNA-seq data are available in the ArrayExpress database (https://www.ebi.ac.uk/arrayexpress) under the accession number E-MTAB-11402.
Supplemental data
The following materials are available in the online version of this article.
Supplemental Figure S1. Additional SBF-SEM images and proximal views of the reconstructed root ICs in S. moellendorffii.
Supplemental Figure S2. Additional confocal images taken during the root branching assay in S. moellendorffii.
Supplemental Figure S3. 3D-segmented ICs from confocal stacks in Figure 4, A–Q.
Supplemental Table S1. Processed RNA-seq gene expression values.
Supplemental Table S2. Overlap of genes between different subsets or clusters and the meristem-enriched genes.
Supplemental Table S3. GO, MapMan, and InterPro terms associated with the meristem-enriched genes that were downregulated in the root branching course.
Supplemental Table S4. GO, MapMan, and InterPro terms associated with the meristem-enriched genes that were upregulated in the root branching course.
Supplemental Table S5. Selaginella orthologs or homologs from LR- or root stem cell-related gene families as retrieved from PLAZA version 4.5 (https://bioinformatics.psb.ugent.be/plaza/versions/plaza_v4_5_dicots/).
Supplemental Movie S1. S. moellendorffii shoot explant with root formation and repetitive bifurcation of the roots.
Supplemental Movie S2. Confocal stack of an unbranched S. moellendorffii root.
Supplemental Movie S3. First IC in Figure 3B.
Supplemental Movie S4. Second IC in Figure 3B.
Supplemental Movie S5. Third IC in Figure 3B.
Supplemental Movie S6. Fourth IC in Figure 3B.
Supplemental Movie S7. Fifth IC in Figure 3B.
Supplemental Movie S8. IC in Figure 3, D–F.
Supplemental Movie S9. IC in Figure 3, H–J.
Supplemental Movie S10. ICs and IC daughter cells in Figure 4A.
Supplemental Movie S11. ICs and IC daughter cells in Figure 4C.
Supplemental Movie S12. Confocal stack of the root in Figure 8K.
Supplemental Movie S13. Confocal stack of the root in Figure 8L.
Acknowledgments
We thank Lieven Sterck and Ignacio Eguinoa for support in bioinformatic analyses, Anna Kremer, Benjamin Pavie, Peter Borghgraef, and Saskia Lippens for assistance and guidance with the SBF-SEM, Davy Opdenacker for technical support and Annick Bleys for help in preparing the manuscript. We also would like to thank Moritz Nowack, Edyta Gola, and Koen Geuten for the helpful discussions and comments on the manuscript.
Funding
This study was financially supported by the Fonds voor Wetenschappelijk Onderzoek – Vlaanderen (FWO)-project G027313N and G028421N. T.F. was financially supported by China Scholarship Council and the Erasmus Mundus programme of the European Union (Lotus Unlimited Project). W.P. was financially supported by an FWO fellowship (11I3721N). L.W. and G.W.B. were supported by BBSRC grant BB/S002804/1.
Conflict of interest statement. None declared.
These authors contributed equally (H.M. and T.F.)
H.M., T.F., B.P., and T.B. designed the experiments. T.F., X.Y., W.S., W.P., and M.N. collected microscopic data. H.M., T.F, W.S., W.P., L.W., G.W.B., and T.B. processed and analyzed microscopic data. T.F., H.M., and B.P. performed the RNA-seq experiment. B.P. processed the transcriptomic dataset. H.M. and B.P. analyzed the transcriptomic dataset. T.B. supervised the project. H.M., T.F., and T.B. wrote the manuscript. All the authors read and approved the final manuscript.
The author responsible for distribution of materials integral to the findings presented in this article in accordance with the policy described in the Instructions for Authors (https://dbpia.nl.go.kr/plphys/pages/general-instructions) is: Tom Beeckman ([email protected]).
References
Author notes
Senior author
