


Abstract
Grain size is one of the crucial factors determining grain yield. However, the genetic and molecular mechanisms of florigen repression complexes (FRCs) underlying grain size in rice (Oryza sativa L.) have not been reported. Here, we report that the rice CENTRORADIALIS (CEN) family member OsCEN2 (also known as Rice TFL1/CEN homolog, RCN1), a phosphatidylethanolamine-binding protein (PEBP) family protein, negatively controls grain size in rice. Overexpression of OsCEN2 led to small grains, and knockout of OsCEN2 resulted in large, heavy grains. OsCEN2 influenced grain size by restricting cell expansion in the spikelet hull and seed filling. In in vivo and in vitro experiments, OsCEN2 physically interacted with a G-box factor 14-3-3 homolog, GF14f, which negatively regulates grain size. Bimolecular fluorescence complementation and yeast two-hybrid assays revealed that GF14f directly interacts with the basic leucine zipper (bZIP) transcription factor, OsFD2. Plants overexpressing OsFD2 produced smaller and lighter grains than wild-type plants. We found that OsFD2 also influences grain size by controlling cell expansion and division in the spikelet hull. Our results reveal the molecular mechanisms of the OsCEN2–GF14f–OsFD2 regulatory module in controlling grain size. Additionally, our study provides insight into the functions of the FRC in rice and suggests a strategy for improving seed size and weight.
Introduction
Rice (Oryza sativa L.) is one of the most important cereal crops in the world, providing calories for more than half of the global population. Rice grain yield is determined by three main traits: the number of effective panicles per plant, the number of grains per panicle, and the grain weight (Xing and Zhang, 2010; Li et al., 2018). Among these, grain weight is largely determined by grain size, which is specified by its three dimensions (length, width, and thickness) and by the degree of filling (Xing and Zhang, 2010). Grain size is an important and complicated agronomic trait that is controlled by multiple genes (Li et al., 2018).
Many genes related to grain size have been identified, providing an opportunity for the selection and breeding of super-high-yielding rice varieties (Zuo and Li, 2014; Li et al., 2018). These genes are involved in multiple signaling pathways, including G protein signaling, the ubiquitin-proteasome pathway, phytohormones, the mitogen-activated protein kinase (MAPK) signaling pathway, and transcriptional regulatory factor pathways (Li et al., 2018). G protein signaling is involved in growth and development processes in plants. GS3 is a negative regulator of grain size, and was the earliest quantitative trait locus (QTL) for grain size characterized using map-based cloning (Fan et al., 2006). Recent studies suggested that a mutant gs3 allele leads to larger, heavier grains (Mao et al., 2010). In contrast, GS5 functions as a positive regulator of grain width and encodes a putative serine carboxypeptidase. Overexpression of GS5 is associated with larger grain size (Li et al., 2011). GRAIN WEIGHT 2 (GW2), an E3 ubiquitin ligase, forms a regulatory module with WIDE GRAIN 1 (WG1) and OsbZIP47 that controls grain width and weight in rice (Song et al., 2007; Hao et al., 2021).
Phytohormones are essential for the regulation of grain size. For example, THOUSAND-GRAIN WEIGHT 6 (TGW6) encodes a protein with indole-3-acetic acid (IAA)-glucose hydrolase activity. The tgw6 allele influences the timing of the transition from the syncytial to the cellular phase by controlling IAA contents, and thus negatively controls grain weight and grain filling (Ishimaru et al., 2013). GW8, also known as SQUAMOSA PROMOTER BINDING PROTEIN-LIKE 16 (OsSPL16), positively regulates grain width. Elevated expression of GW8 appears to be associated with a wider and heavier grain by promoting cell division and grain filling (Wang et al., 2012).
Grain size is also determined by the size of the spikelet hull, which indirectly affects endosperm development and thus grain size. Several genes regulate grain size by increasing cell expansion and cell proliferation in spikelet hulls. For example, the xiao mutants display reduced organ sizes due to decreased cell numbers in spikelet hulls (Jiang et al., 2012). FUWA encodes an NHL domain-containing protein and restricts excessive cell division in rice. Knockdown of the FUWA transcript level results in increased grain size by promoting cell division (Chen et al., 2015). GW5 encodes a protein that is localized in the nucleus and physically interacts with polyubiquitin. Furthermore, GW5 negatively controls grain size by regulating cell proliferation in spikelet hulls during seed development (Shomura et al., 2008; Weng et al., 2008). Apart from cell number, cell size is another factor affecting hull size that is independent from cell division. For example, Slender grain on chromosome 7 (SLG7) results in slender grains by longitudinally increasing cell length and decreasing cell width in spikelet hulls (Zhou et al., 2015). BIG GRAIN 1 (BG1) affects cell number and size simultaneously by functioning as a positive regulator of grain size (Liu et al., 2015).
TERMINAL FLOWER1 (TFL1) belongs to the family of phosphatidylethanolamine-binding proteins (PEBPs) and mediates the transition from the vegetative stage to the reproductive stage of plants (Coelho et al., 2014). Rice CENTRORADIALIS 1 (OsCEN2, also known as Rice TFL1/CEN homolog, RCN1), a rice TFL1 homolog (Zhang et al., 2005), functions in flowering time regulation (Huang et al., 2012). OsCEN2 is synthesized in leaves and transported to the shoot apical meristem, where it competes with the FLOWERING LOCUS T ortholog Heading date 3a (Hd3a) to form florigen repression complexes (FRCs) with 14-3-3 and OsFD1 proteins during the floral transition (Taoka et al., 2011; Kaneko-Suzuki et al., 2018). In addition, the FRCs suppress rice floral transition through downregulating the floral development genes OsMADS14 and OsMADS15 (Taoka et al., 2011; Cai et al., 2021).
In Arabidopsis (Arabidopsis thaliana), TFL1 physically interacts with a group of small GTP-binding Ras-related nuclear proteins, which mediate the transport of TFL1 from the chalazal endosperm to the syncytial peripheral endosperm, where TFL1 stabilizes ABSCISIC ACID INSENSITIVE 5 (ABI5), a crucial transcription factor in ABA signaling pathway. Therefore, TFL1 regulates seed size by mediating timely cellularization of the endosperm, which indicates that TFL1 is important in controlling grain size (Zhang et al., 2020). Nevertheless, the role of OsCEN2 in the regulation of grain size remains poorly understood.
In this study, we present evidence that OsCEN2 is a negative regulator of grain size in rice. OsCEN2 physically interacted with GF14f, a 14-3-3 protein that was previously shown to negatively regulate seed development (Zhang et al., 2019). Moreover, GF14f interacted with OsFD2 in the nucleus. We further showed that OsFD2 is an important gene in the regulation of grain size in rice, as its overexpression resulted in smaller grains, and its knockout induced larger grains. Our findings thus reveal a molecular framework for the control of grain size and weight by the OsCEN2-GF14f-OsFD2 regulatory module.
Results
OsCEN2 negatively influences grain size in rice
To study the role of OsCEN2 in regulating rice grain size, we constructed an overexpression vector driven by the Ubiquitin (Ubi) promoter and introduced it into calli of Zhonghua 11 (ZH11) rice by Agrobacterium tumefaciens-mediated transformation. Reverse transcription-quantitative PCR (RT-qPCR) analysis showed that the expression of OsCEN2 in the overexpression lines OsCEN2-OE1 and OsCEN2-OE2 was significantly higher compared with the ZH11 wild type (WT) (Supplemental Figure S1). We also generated different knockout mutant lines (oscen2-2 and oscen2-7) by editing the first exon region of OsCEN2 using the clustered regularly interspaced short palindromic repeat (CRISPR)-associated protein-9 (CRISPR-Cas9) technology (Figure 1A). The oscen2-2 and oscen2-7 lines contained a 1-bp insertion and an 11-bp deletion in OsCEN2, respectively, which led to frame-shift mutations that caused premature termination of translation and absence of OsCEN2 expression (Supplemental Figures S1 and S2).
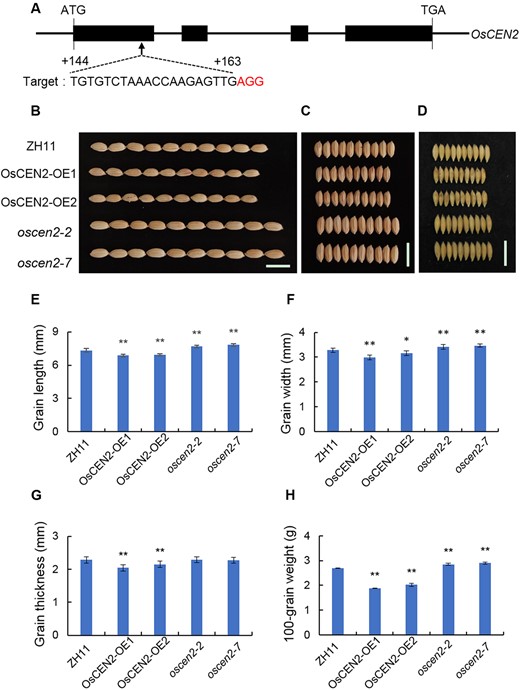
OsCEN2 negatively affects grain size and weight. A, Generation and identification of OsCEN2-Cas generated by CRISPR/Cas9 genome-editing approach. The gRNA-targeting site was indicated by arrow. The start codon (ATG) and stop codon (TGA) are indicated. Boxes indicate the coding sequences and lines between boxes indicate introns. The protospacer adjacent motifs (PAMs) were highlighted in red. B–D, Grain phenotype of ZH11, overexpression, and knockout lines. E–H, Grain length, width, thickness, and 100-grain weight of ZH11, overexpression and knockout plants were shown, respectively. Values are presented as means ± SD (n = 30 in E–G, n = 5 in H; *P < 0.05, **P < 0.01; Student’s t test). ZH11: wild-type Zhonghua 11; OsCEN2-OE1, OsCEN2-OE2: overexpression lines; oscen2-2, oscen2-7: knockout lines. Scale bars: 1 cm.
We found that the grains of the overexpression lines were significantly smaller than those of the WT, and those of the knockout lines were substantially larger than those of the WT (Figure 1, B–D). We then shelled mature grain hulls to observe the endosperm phenotype, and found that the OsCEN2-overexpression lines showed a significant reduction in grain size, including grain length, width, and thickness, whereas the knockout lines showed significant increases in grain length and width, although not grain thickness, compared to the WT (Figure 1, E–G; Supplemental Figure S3). The 100-seed weight of the OsCEN2-OE1 and OsCEN2-OE2 overexpression lines was 1.88 g and 2.02 g, respectively, which were significantly lower than the 2.69 g of the WT, while the 100-seed weight of the oscen2-2 and oscen2-7 knockout lines was 2.84 g and 2.90 g, respectively, significantly higher than the WT (Figure 1H). There was no significant difference in grain weight per plant between OsCEN2 knockout lines to WT. However, the grain weight of OsCEN2 overexpression lines, which was tested in the 2020 early season, obviously decreased (Supplemental Figure S4). There was no obvious difference of brown rice percentage among the OsCEN2-overexpression, knockout, and WT seeds. Amylose content and alkali elimination value decreased in OsCEN2 transgenic seeds compared to WT, while rice transparency, chalkiness rate increased in both overexpression and knockout lines (Supplemental Figure S5). These results indicate that OsCEN2 plays an important role in affecting rice grain size.
Expression pattern and localization of OsCEN2 in rice
To characterize the expression pattern of OsCEN2, we measured its transcript levels in developing seeds on various days after pollination (DAP) by RT-qPCR. OsCEN2 transcript was detectable at all examined periods of seed development, and was low at 6, 8, and 10 DAP, but then gradually increased, peaking at 18 DAP (Figure 2A).
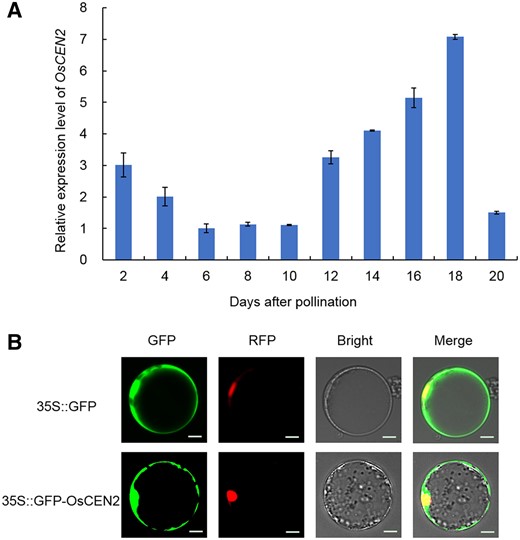
Expression pattern analysis of OsCEN2. A, Transcript expression levels of OsCEN2 in rice seeds on different days after pollination. Mean ± SD; n = 3 biological replicates. B, Subcellular localization of the GFP-OsCEN2 fusion protein in rice protoplasts. D53-mCherry was used as the nuclear marker. The free GFP was used as a control. Scale bars: 20 µm.
To test the subcellular localization of OsCEN2, we constructed a GFP-OsCEN2 (green fluorescent protein) fusion protein under the control of the constitutive cauliflower mosaic virus (CaMV)-35S promoter and transiently expressed it in rice protoplasts. Green fluorescence was visible throughout the cytoplasm when GFP alone was driven by the 35S promoter in protoplasts. However, the green fluorescence of the GFP-OsCEN2 fusion protein partly co-localized with the red fluorescence of the nuclear marker protein, suggesting that OsCEN2 localizes in the nucleus and cytoplasm (Figure 2B).
OsCEN2 regulates grain size by controlling cell expansion and seed filling
To further study the effect of OsCEN2 on seed development, we observed the seed morphology and measured the fresh weight of seeds after pollination. Compared with the WT, the seed size of the OsCEN2-overexpression lines was smaller at 3 DAP, while the seed size of the OsCEN2-knockout lines was larger (Supplemental Figure S6A). In addition, the fresh weight of grains from the overexpression lines was lower than that of the WT, and the fresh weight of grains from the knockout lines was higher than that of the WT. At 6 DAP, the fresh weight of WT grains was 0.017 ± 0.001 g, but it was significantly lower in both overexpression lines, at 0.014 ± 0.001 g (Supplemental Figure S6B). The fresh weight of grains in the knockout lines was still greater than that in the WT, and these differences were maintained in the developing seeds, along with the final seed size at maturity (Supplemental Figure S6). These results indicated that OsCEN2 affects the seed filling process from the early stage of seed development to maturity.
The spikelet hull restricts overall grain size. We found that the spikelet was larger in the knockout lines than in the WT, while the overexpression lines produced visibly smaller grains than the WT (Figure 3A). We analyzed histological cross-sections of the spikelet hulls, and measured the area of the cross-sections before flowering. The cross-section area of spikelet hulls was smaller in the overexpression lines than in the WT, while the knockout lines showed the opposite phenotype (Figure 3, B and E). Further examination revealed a significant difference in the length of parenchyma cells, which were smaller in spikelets of the overexpression lines than in those of the WT. The knockout lines showed the largest cell length among the different genotypes (Figure 3, C and F). However, there was no significant difference in the number of parenchyma cells between any of the transgenic lines and the WT (Supplemental Figure S7A). These findings suggest that the change in seed width and thickness is due to the expansion of cells of spikelet hulls rather than to a change in the number of cells.
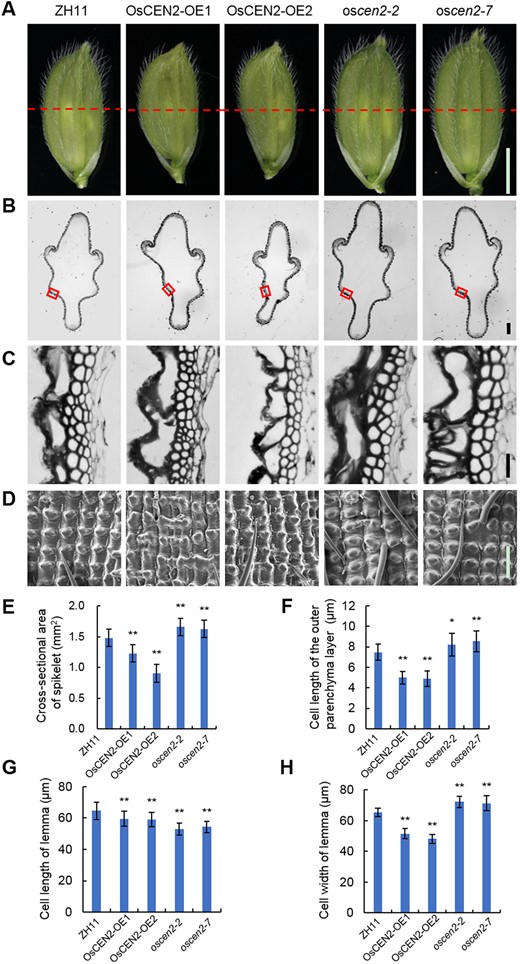
Histological analysis of spikelet hulls of the overexpression and knockout lines of OsCEN2. A, Stereoscopic microscopes photographs of young spikelet hulls of ZH11, overexpression, and knockout lines. The red dashed line indicates the cross-section position. Scale bar: 2 mm. B, Cross-sections of spikelet hulls of ZH11, overexpression, and knockout lines in (A) dashed line position. Scale bar: 200 μm. C, Magnified view of the cross-section area boxed in (B). Scale bar: 20 μm. D, Scanning electron photographs of the lemma of young spikelet hulls before flowering of ZH11, overexpression, and knockout lines. This image was enlarged and taken from the indicated part in (A). Scale bar: 100 μm. E and F, Cross-sectional areas of spikelet hulls and cell length of the outer parenchyma layer of the spikelet hulls of ZH11, overexpression, and knockout lines. Means ± SD; n = 3 in E and n = 30 biological replicates in (F). *P < 0.05, **P < 0.01; Student’s t test. G and H, Cell lengths and cell width of lemma of the spikelet hulls of ZH11, overexpression, and knockout lines along the longitudinal axis and horizontal axis, respectively. Means ± SD; n = 20 biological replicates. **P < 0.01; Student’s t test. ZH11: wild-type Zhonghua11; OsCEN2-OE1, OsCEN2-OE2: overexpression lines; oscen2-2, oscen2-7: knockout lines.
To further study the underlying reason for these changes in seed length along the longitudinal axis, we investigated the lemma of the WT and the transgenic lines using scanning electron microscopy (SEM). The cell length in the lemma of the overexpression and knockout lines was significantly smaller than that of the WT. However, compared to the WT plants, the cell width of the lemma was significantly larger in the knockout plants, while smaller in the overexpression plants (Figure 3, D, G and H). Taken together, these findings suggest that OsCEN2 participates in regulating seed size by controlling lemma cell expansion.
OsCEN2 interacts with GF14f to regulate seed size
To screen the OsCEN2 interacting proteins that impact seed size, we obtained overexpression plants with OsCEN2-FLAG fusion gene driven by the Ubi promoter and examined them using co-immunoprecipitation (Co-IP) assays with anti-FLAG antibody to detect OsCEN2-FLAG in the immunoprecipitated protein (Figure 4A). We then used liquid chromatography-tandem mass spectrometry (LC-MS/MS) to characterize proteins that interacted with OsCEN2. These candidate proteins included a 14-3-3 protein, GF14f, that was previously reported to negatively regulate seed size; the grain length and grain weight were significantly increased in GF14f-RNAi plants (Zhang et al., 2019). Therefore, we suspected that OsCEN2 might interact with GF14f to regulate seed size.
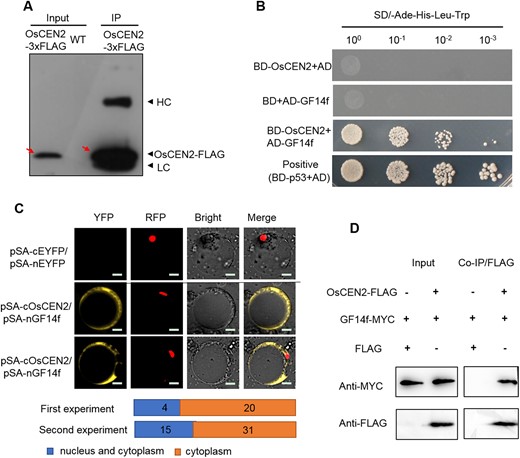
OsCEN2 interacts with GF14f. A, Co-IP assay of the OsCEN2-3×FLAG. Anti-FLAG antibody was used to detect the input and output protein. HC, heavy chain of antibody; LC, light chain of antibody. OsCEN2-3×FLAG protein was pointed out with a red arrow. B, Yeast two-hybrid analysis of OsCEN2 and GF14f. pGBKT7-p53 was used as the positive control. Yeasts of different dilutions were cultured on the selected plate. AD: pGADT7; BD: pGBKT7; SD: Synthetic Dropout Medium. C, BiFC analysis of the OsCEN2 and GF14f interaction. The YFP fluorescence signals from protoplast were colored as yellow. 35S::D53-mCherry was used as the nuclear marker. Quantification of subcellular localization of the BiFC signal arose from interactions of OsCEN2–GF14f. Scale bars, 20 μm. D, Co-IP assay of the OsCEN2 and GF14f interaction. Anti-MYC and Anti-FLAG antibody were used to detect the output protein.
To determine whether OsCEN2 directly interacts with GF14f, we performed a yeast two-hybrid (Y2H) assay. The yeast containing the BD-OsCEN2 and AD-GF14f plasmids grew well in the selection medium (Figure 4B), while those containing BD-OsCEN2 and AD plasmids or BD and AD-GF14f plasmids did not grow (Figure 4B; Supplemental Figure S8A). This indicated that OsCEN2 and GF14f interact with each other in yeast. In BiFC assay, there was no signal when pSA-nEYFP and pSA-cEYFP were co-transformed into protoplasts (Figure 4C). When pSA-cOsCEN2 was co-expressed with pSA-nGF14f in rice protoplasts, yellow fluorescent protein (YFP) fluorescence signal was detected mainly in the cytoplasm and for some protoplasts in nucleus and cytoplasm. The statistical data indicated that most subcellular localization of interactions of GF14f–OsCEN2 localized in the cytoplasm, where some localized in the nucleus and cytoplasm (Figure 4C). We also transiently expressed the GF14f-MYC fusion protein and the OsCEN2-FLAG fusion protein in Nicotiana benthamiana leaves. GF14f-MYC was pulled down in Co-IP experiments by the beads containing OsCEN2-FLAG, but not by the beads with FLAG protein alone. Co-IP assays in N. benthamiana leaves biochemically validated the interactions (Figure 4D). These results indicated that OsCEN2 can directly interact with GF14f in the cytoplasm and nucleus.
GF14f interacts with OsFD2 to affect grain size
Previous studies have reported that 14-3-3 proteins, also named GF14, interact with OsFD1 and affect flowering time in rice (Taoka et al., 2011). To verify whether GF14f interacts with OsFD2, we conducted a Y2H assay. The yeast containing BD-GF14f and AD-OsFD2 plasmids grew well in the selection medium, while the yeast containing BD-GF14f and AD plasmids or BD and AD-OsFD2 plasmids did not grow (Figure 5A;Supplemental Figure S8B). This indicated that OsFD2 and GF14f interact in yeast. However, there was no direct interaction between OsFD2 and OsCEN2 (Supplemental Figure S9). In BiFC experiments, YFP signals were visible when OsFD2-nEYFP and GF14f-cEYFP were co-transformed in rice protoplasts, and the YFP signal overlapped with the DAPI signal, indicating that the YFP signal is localized in the nucleus. However, there was no YFP signal in protoplasts containing the pSA-nEYFP and pSA-cEYFP plasmids (Figure 5B). These results indicated that GF14f interacts with OsFD2 in the nucleus.
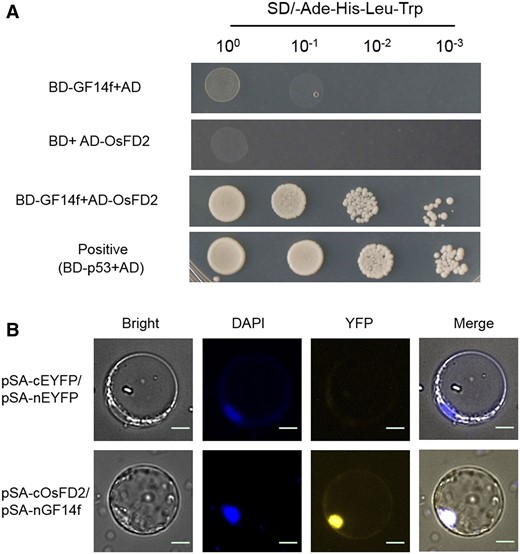
OsFD2 interacts with GF14f. A, Yeast two-hybrid analysis of OsFD2 and GF14f. pGBKT7-p53 was used as the positive control. Yeasts of different dilutions were grown on SD medium lacking Trp, Leu, His, and Ade. AD: pGADT7; BD: pGBKT7; SD: Synthetic Dropout Medium. B, BiFC analysis of the OsFD2 and GF14f interaction. The YFP fluorescence signals and DAPI signals from protoplast were colored as yellow and blue, respectively. Scale bars: 20 μm.
Furthermore, when we transiently expressed the 35S::GFP-OsFD2 and 35S::GFP-GF14f plasmids in rice protoplasts, respectively, the GFP signal of GFP-OsFD2 co-localized with the nucleus-localized RFP signal, yet, the GFP signal of GFP-GF14f only partially co-localized with the RFP. This indicated that OsFD2 localizes in the nucleus and GF14f localizes in the nucleus and cytoplasm (Supplemental Figure S10). Taken together, these findings suggest that GF14f interacts with OsFD2 in the nucleus.
OsFD2 negatively influences grain size
In order to understand the function of OsFD2 in grain development, we constructed an OsFD2 overexpression vector and obtained transgenic plants (OsFD2-OE3 and OsFD2-OE11) (Supplemental Figures S11 and S12A). Phenotypic observation revealed that effective tiller number of overexpression lines was similar to WT (Supplemental Figure S12B), the seed-setting percentage, and plant height were decreased compared to WT (Supplemental Figure S12, C and D). The grains of the OsFD2-overexpression lines were substantially smaller than those of the WT (Figure 6, A–C; Supplemental Figure S13A). RT-qPCR analysis indicated that the expression of OsFD2 in the OsFD2-OE3 and OsFD2-OE11 lines was significantly higher than in the WT (Supplemental Figure S13B). Further statistical analysis showed that the grain length, width, and thickness of OsFD2-OE3 and OsFD2-OE11 lines were significantly lower than that in the WT (Figure 6, D–F). The 100-grain weight of the OsFD2-overexpression lines was significantly lower than that in the WT (Figure 6G). When we compared the grain weight per plant of OsFD2 overexpression lines, it was reduced compared to WT (Supplemental Figure S12E).
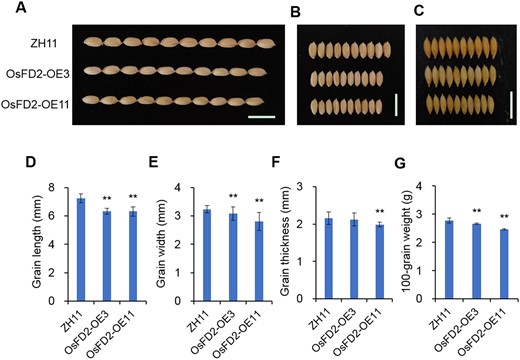
Effects of OsFD2 on grain size and weight. A–C, Comparisons of grain size between ZH11 and overexpression lines in length (A), width (B), and thickness (C). Scale bars: 1 cm. D–G, Grain length, width, thickness, and 100-grain weight of ZH11 and overexpression lines. All data represent means ± SD (n = 30 in E–G, n = 5 biological replicates in H). (**P < 0.01; Student’s t test). ZH11: wild-type Zhonghua11; OsFD2-OE3, OsFD2-OE11: overexpression lines.
To further study OsFD2 function in controlling grain size, we generated different knockout mutant lines (osfd2-1 and osfd2-2) by editing 5′ untranslated region and first exon of OsFD2 using CRISPR-Cas9 technology (Supplemental Figure S14A). The osfd2-1 and osfd2-2 lines contained a 248-bp deletion and 1-bp insertion in OsFD2, respectively, which led to frame-shift mutations that caused premature termination of translation and erroneous translation of C-terminal OsFD2, respectively (Supplemental Figure S14, B and C). No morphological difference was observed between WT and knockout mutant plants (Supplemental Figure S15A). Particularly, the main panicles of WT and knockout lines appeared to be similar (Supplemental Figure S12A). Above all, the grain size of knockout lines is larger than WT (Supplemental Figure S15B). There was no obvious difference of brown rice percentage and amylose content among the OsFD2-overexpression, knockout and WT seeds. Alkali elimination value and head milled rice percentage decreased in OsFD2 transgenic seeds compared to WT, while rice transparency and chalkiness rate increased in both overexpression and knockout lines (Supplemental Figure S5). These results indicated that OsFD2 negatively regulate grain size in rice.
OsFD2 controls grain size through cell expansion and cell division
To further understand the effect of OsFD2 on seed development, we observed the morphology and measured the grain fresh weight in the OsFD2-overexpression lines at several stages after pollination. The grains in the OsFD2-OE3 and OsFD2-OE11 lines were smaller and lighter than those in the WT at all grain stages observed (Supplemental Figure S16).
To determine whether the effect of OsFD2 on seed size is related to the spikelet hull, we examined the spikelet hulls of the OsFD2-overexpression lines and found they were smaller than those of the WT (Figure 7A). The cross-section area of spikelet hulls was also smaller in the overexpression lines (Figure 7, B and E). Further examination revealed a significant decrease in the length of parenchyma cells of OsFD2-OE3 and OsFD2-OE11 compared to the WT (Figure 7, C and F). Moreover, the number of parenchyma cells of OsFD2-OE3 and OsFD2-OE11 grains was also less than that in the WT (Supplemental Figure S7B). These findings suggest that OsFD2 affects the size and number of parenchyma cells in the spikelet hull, which in turn affects the cross-sectional area, leading to smaller grain size.
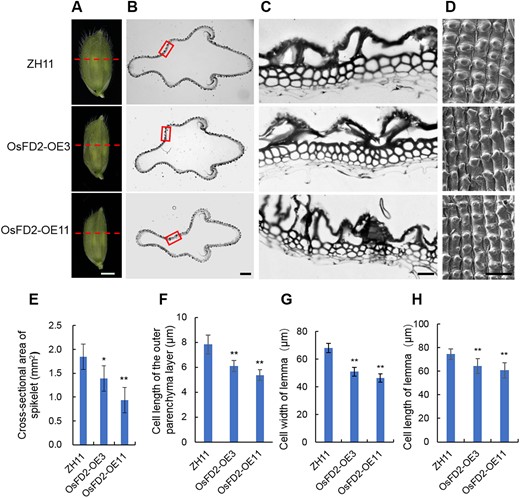
Histological analysis of spikelet hulls of OsFD2-overexpresion lines. A, Stereoscopic microscopes photographs of young spikelet hulls of ZH11 and overexpression lines. The dashed line indicates the cross-section position. Scale bar: 1 mm. B, Cross-sections of spikelet hulls of ZH11 and overexpression lines in (A) red dashed line position. Scale bar: 200 μm. C, Magnified view of the cross-section area boxed in (B). Scale bar: 20 μm. D, Scanning electron photographs of the lemma of young spikelet hulls of ZH11 and overexpression lines. This image was enlarged taken from the indicated part in (A). Scale bar: 100 μm. E and F, Cross-sectional areas of spikelet hulls, cell length of the outer parenchyma layer of the spikelet hulls of ZH11 and overexpression lines. means ± SD; n = 3 in (E) and n = 30 biological replicates in (F). G and H, Cell width and length of lemma of the spikelet hulls of ZH11 and overexpression lines along the horizontal axis and longitudinal axis, respectively. Means ± SD; n = 20 biological replicates. ZH11: wild type Zhonghua11; OsFD2-OE3, OsFD2-OE11: overexpression lines. *P < 0.05, **P < 0.01; Student’s t test.
To further study the difference between spikelet hulls, we used SEM to analyze the lemma cells in the WT and the OsFD2-overexpression lines. The cell length and cell width of the OsFD2-OE3 and OsFD2-OE11 grains were significantly smaller than those in the WT (Figure 7, D, G, and H). These findings suggest that OsFD2 controls grain size through cell expansion and cell division.
Discussion
The TFL1/CEN family plays an important role in plant development. In rice, OsCEN2 overexpression affects plant height, spikelet structure, and flowering time (Zhang et al., 2005). In this study, we discovered that OsCEN2 is an important gene that influences grain size. Compared with the WT, the grains of OsCEN2-overexpression lines were significantly smaller and those of OsCEN2-knockout lines were larger (Figure 1). Furthermore, we identified GF14f, which negatively regulates grain size in rice, as an interactor of OsCEN2 from the Co-IP results. We performed several experiments to demonstrate that GF14f interacts with OsCEN2 (Figure 4). In addition, Y2H and BiFC assays demonstrated that GF14f directly interacts with OsFD2 (Figure 5). We further showed via genetic transformation that the grains of OsFD2-overexpression plants were significantly smaller than those of the WT, and the OsFD2-knockout grains were larger than those of WT (Figure 6; Supplemental Figure S15B). The grain weight per plant of OsCEN2-overexpression and OsFD2-overexpression significantly decreased. Besides the reduced grain size, the lower seed-setting rate influenced grain weight too.
According to our results, the grain quality characters had similar trends in overexpression and knockout lines of both OsCEN2 and OsFD2. For example, rice transparency and chalkiness rate obviously increased in all transgenic plants. As we all know, the formation of grain quality is a complex and orderly dynamic process. It’s a complex quantitative trait controlled by multiple genes. Changes in the expression levels of one related gene, whether increased or decreased, can easily break this balance, eventually causing consistent effects on grain quality. In addition, many grain quality-related indicators are highly associated, such as head milled rice percentage, rice transparency, chalkiness rate, and alkali elimination value. The higher the rice transparency the higher the chalkiness rate. The smaller the alkali elimination value, the lower the head milled rice percentage (Wang et al., 2005). This was consistent with the results in our study (Supplemental Figure S5). Therefore, our results suggested that the OsCEN2–GF14f–OsFD2 module regulates grain size in rice (Figure 8), which is consistent with data indicating that Hd3a–GF14b–OsFD1 regulates rice flowering and Hd3a–GF14b–OsFD2 regulates leaf development. A large proportion of grain size-related genes changed their relative expression level in OsFD2-overexpression lines in our detection (Supplemental Figure S17). This result suggested that OsFD2 maybe affect the expression of grain size-related genes through binding sites in their promoters (Figure 8).
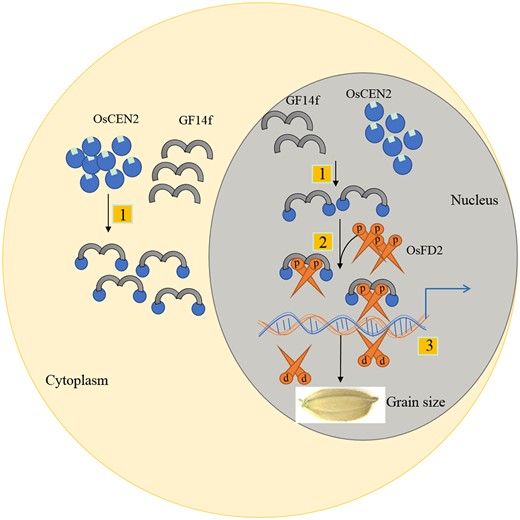
A proposed working model for OsCEN2-GF14f-OsFD2 module in regulating rice grain size. First, OsCEN2 physically interacts with GF14f in cytoplasm and nucleus. Second, OsFD2 interacts with OsCEN2-GF14f to form the FRCs in nucleus. Third, The FRC and OsFD2 bind to the promoters of the downstream target genes related to grain size, regulating the expression of target genes and affecting grain size.
A rice seed is mainly composed of a protective spikelet hull, the embryo, and the endosperm for nutrient storage (Sabelli and Larkins, 2009; Wu et al., 2016). The size and shape of grains are determined by cell proliferation and cell expansion, while the size of the spikelet hull strongly influences grain size (Orozco-Arroyo et al., 2015; Li et al., 2019). Various factors controlling grain size and weight affect the size of the spikelet hull, thereby indirectly regulating endosperm development. For example, OsSPL13 positively regulates cell size in the spikelet hull, resulting in enhanced grain length and yield (Si et al., 2016). GS2 encodes a plant-specific transcription factor, GROWTH-REGULATING FACTOR 4 (OsGRF4), that positively regulates seed size by promoting cell expansion and slightly promoting cell proliferation in the spikelet hull, leading to an increase in grain weight (Che et al., 2015; Duan et al., 2015; Hu et al., 2015). In this study, we found that the cell size of the spikelet hull of OsCEN2-overexpression plants was significantly smaller than that in the WT, while that of OsCEN2-knockout plants was larger (Figure 3), which is consistent with previous reports. We also observed the spikelet hull of OsFD2-overexpression plants and found that the cell size of the lemma was also significantly smaller than in the WT. These results further confirmed that OsCEN2 and OsFD2 regulate grain size by influencing the cell size of the spikelet hull.
In this study, BiFC experiments indicated that the interaction of OsCEN2 and GF14f occurs in the nucleus and cytoplasm (Figure 4C). This is consistent with subcellular localization of GFP-OsCEN2 (Figure 2B) and GFP-GF14f (Supplemental Figure S10B). Interestingly, the interaction of GF14f and OsFD2 only occurred in the nucleus (Figure 5B). The subcellular localization indicated GFP-OsFD2 fusion protein was observed in nucleus (Supplemental Figure S10A). Therefore, OsCEN2–GF14f and OsFD2 may interact in the nucleus and then form a functional complex. In OsFD2-overexpression plants, the grain size is smaller than WT, while knockout lines showed larger grain than WT. Besides the larger grains, the mutant plants are not associated with other phenotypic difference compared with that of WT. This is different from what Tsuji et al. have reported, where OsFD2-overexpression plants generated smaller leaves with short plastochrons. In their article, the subcellular localization of OsFD2 is located in the cytoplasm and nuclei (Tsuji et al., 2013). This is different from previous work that OsFD1, a member of the FD gene family, predominantly accumulated in the nuclei of rice cells (Taoka et al., 2011). The interaction of OsFD2 and GF14b signal was detected mainly in the cytoplasm and weakly in nuclei (Tsuji et al., 2013). However, the dense panicle phenotype is similar between Tsuji’s and our results.
FD is a basic leucine zipper (bZIP)-containing transcription factor, and loss of FD function in Arabidopsis causes late flowering (Abe et al., 2005; Wigge et al., 2005). The C-terminus of FD contains a short motif targeted by calcium-dependent protein kinases, which is required for its interaction with 14-3-3 proteins in rice (Abe et al., 2005). 14-3-3 proteins function as major regulators of primary metabolism, cellular signal transduction, defense response, and abiotic stress response in plants (Chen et al., 2006; Denison et al., 2011). In rice, the 14-3-3 protein family comprises eight members, GF14a-GF14h, of which four (GF14b, GF14c, GF14e, and GF14f) interact with Hd3a and OsFD1 (Taoka et al., 2011). The rice FT homolog Hd3a interacts with 14-3-3 proteins in the apical cells of shoots, yielding a complex that binds to OsFD1. This florigen activation complex induces the transcription of OsMADS15, which promotes rice flowering (Kaneko-Suzuki et al., 2018). In addition, the FD transcription factor in the florigen activation or repression complexes can be replaced with a homologous protein to regulate a different process in growth and development in rice (Tsuji et al., 2013). For example, Hd3a–GF14b–OsFD1 regulates rice flowering (Taoka et al., 2011), while Hd3a–GF14b–OsFD2 regulates leaf development (Tsuji et al., 2013), which implies that the function of the florigen activation complex depends on the FD transcription factor incorporated into it. In this study, we found that the OsCEN2–GF14f–OsFD2 module regulates seed size, implying that the replacement of complex component affects the growth and development of other rice organs. The OsCEN2-GF14f-OsFD2 protein complex plays a role in limiting grain size. However, we need further research to clarify the threshold for regulating or controlling the process. Some studies suggest that the FRC model provides a breakthrough in understanding of the functional conservation of floral transition, because the proteins that make up the FRCs are conserved in plants (Ferl et al., 2002; Karlgren et al., 2011; Taoka et al., 2011). Our research provides more evidence for the multifunctionality of the florigen repression and activation complexes. It also provides a strategy for simultaneous manipulating seed size and flowering time in rice breeding of new varieties.
Materials and methods
Plant materials and plasmid construction
All rice plants (O. sativa ssp. japonica cv. Zhonghua 11, ZH11) used in this study were grown in the paddy field at South China Agricultural University in Guangzhou. Rice cultivation was managed according to local common practices.
To generate the CRISPR/Cas9 vector, the OsCEN2-Cas were constructed using pYLgRNA-OsU3, as described previously (Ma et al., 2015). The sequence of the target site was 5′-TGTGTCTAAACCAAGAGTTG-3′, which contained a protospacer adjacent motif (PAM) AGG at the 3′ end.
To construct the OsCEN2 and OsFD2 overexpression vector, the 522/504 bp fragment of the OsCEN2/OsFD2 cDNA sequence driven by the Ubiquitin (Ubi) promoter was inserted into the pYLox vector (Yu et al., 2010).
For the Ubi::OsCEN2-FLAG construct, full-length OsCEN2 cDNA was amplified and fused with the N terminus of FLAG in the pYLox vector driven by the Ubi promoter.
All constructs were confirmed by sequencing, introduced into Agrobacterium tumefaciens EHA105 cells, and transformed into ZH11 by Agrobacterium-mediated transformation according to our previously reported method (Jiang et al., 2018). All primers used for vector construction are listed in Supplemental Table S1.
Subcellular localization analysis
To generate the 35S::GFP-OsCEN2, 35S::GFP-GF14f and 35S::GFP-OsFD2 vectors, full-length OsCEN2, GF14f, and OsFD2 cDNAs were amplified and fused with the C terminus of GFP in the pUC18 vector under the control of the Cauliflower mosaic virus (CaMV) 35S promoter (Yang et al., 2014). For transient expression, protoplasts were isolated from the leaf sheaths of 15 d rice plants as described previously (Yang et al., 2014). GFP fluorescence was visualized with a fluorescence microscope (ECHO, USA) after infiltration for 12 to 24 h. GFP fluorescence microscope parameters: light source: high energy LED; intensity: 80%; excitation light wavelength (EX): 470/40 nm; emission light filter (EM): 525/50 nm; dichroic wavelength (DM): 495 nm; exposure time ˂ 600 ms. mCherry fluorescence microscope parameters: light source: high energy LED; intensity: 80%; excitation light wavelength (EX): 560/40 nm; emission light filter (EM): 635/60 nm; dichroic wavelength (DM): 600 nm; exposure time ˂ 600 ms.
The fluorescence microscope physically uses the black box to block the stray light in the environment to reduce the background fluorescence signal. During the shooting process, the contrast between fluorescence and background was adjusted to the best by automatically optimizing the shooting software. Therefore, the background of the fluorescence signal was weak.
Bimolecular fluorescence complementation (BiFC) analysis
In order to construct BiFC vectors, ORFs of OsCEN2, GF14f, and OsFD2 were cloned into pSAT6-nEYFP-C1 and pSAT6-cEYFP-C1 vectors, respectively. Rice protoplasts were isolated as described previously (Yang et al., 2014). The pSAT6-cEYFP-OsCEN2, pSAT6-nEYFP-GF14f, and pSAT6-cEYFP-OsFD2 plasmids were co-transformed into rice protoplasts for BiFC assays (Chen et al., 2011). The fluorescence signals were visualized with a fluorescence microscope after infiltration for 20 to 30 h. YFP fluorescence microscope parameters: light source: high energy LED; intensity: 80%; excitation light wavelength (EX): 470/40 nm; emission light filter (EM): 525/50nm; dichroic wavelength (DM): 495 nm; exposure time ˂ 600 ms. mCherry fluorescence microscope parameters: light source: high energy LED; intensity: 80%; excitation light wavelength (EX): 560/40 nm; emission light filter (EM): 635/60 nm; dichroic wavelength (DM): 600 nm; exposure time ˂ 600 ms. DAPI fluorescence microscope parameters: light source: high energy LED; intensity: 80%; excitation light wavelength (EX): 385/30 nm; emission light filter (EM): 450/50 nm; dichroic wavelength (DM): 425 nm; exposure time ˂ 600 ms.
Co-IP assay
For Co-IP assay for screening the interacting proteins, 14 DAP seeds of overexpression plants with CEN2-FLAG fusion proteins were collected to extract the total proteins. Total proteins were extracted by extraction buffer (50 mM of Tris-HCl (pH 7.5), 150 mM of NaCl, 1 mM of EDTA, 5% glycerol (v/v), 0.5% Triton X-100 (v/v), 1 mM of PMSF, proteinase inhibitor cocktail). Co-IP experiments were performed as described previously (Lin et al., 2019). The immunoprecipitated protein was characterized by liquid chromatography-mass spectrometry/mass spectrometry (LC-MS/MS) at FitGene Biotechnology Co. Ltd. China.
For Co-IP assay for protein-protein interaction, the 522/783 bp fragment of the OsCEN2/GF14f cDNA sequence was cloned into pC1300-P35S-CEN2-FLAG and pC1300-P35s-GF14f-MYC vectors using C112-ClonExpress-II One Step Cloning Kit (Vazyme, Nanjing, China), respectively. The recombinant plasmids pC1300-P35S-CEN2-FLAG and pC1300-P35S-GF14f-MYC were co-transformed into N. benthamiana leaves as described previously (Lin et al., 2019). Co-IP experiments were performed according to the methods described previously (Lin et al., 2019).
RNA isolation and RT-qPCR
Total RNA was isolated from leaves or the developing seeds of 2–20 DAP using Trizol reagent (Takara) and quantified with a DU730 spectrophotometer (Beckman Coulter, Germany). cDNA was synthesized with a 5 × iScript RT Supermix kit (TaKaRa, Dalian, China) using about 2 μg of total RNA. RT-qPCR was performed with SYBR premix Ex Taq II in a total volume of 20 μL on the Bio-Rad CFX 96 following the manufacturer’s protocol. RT-qPCR analyses were conducted in three biological replicates Data were normalized to the internal rice UBIQUITIN (UBI) gene, and relative quantification was used for data analysis. All primers for RT-qPCR are shown in Supplemental Table S1.
Analysis of rice grain phenotypes
Harvested grains were air-dried and stored at room temperature. Thirty fully filled grains from transgenic and WT plants were chosen randomly. The length, width, and thickness were measured using a caliper. The 100-seed weight was measured for five biological repeats. The fresh weight of developing seeds was calculated from the weight of seeds on different days after pollination for 10 times.
Grain quality measuring
To measure the brown rice rate, 30 g full seeds were prepared and the roller adjusted the spacing value among 0.5–1.0 mm according to the grain thickness. Then, we turned the rice husker on for 1 min to pour the sample evenly into the hulling machine. The weight of brown rice was weighed by balance. Brown rice rate = weight of brown rice (g)/total sample weight (30 g) × 100%
To test amylose measurement, the milled rice was ground into rice flour by hammer cyclone and sieved by 200 mesh sieve. Then, 100 mg pure amylose, pure amylopectin, and the tested sample were accurately weighed on the electronic balance. Pouring the rice flour into the bottom of the test tube, 1 mL of 95% ethanol (v/v) was added to the tube and gently shaken to disperse. After dissolution, 9 mL of 4% NaOH solution (w/v) was added and put into boiling water for 10 min. The test tube was cooled to normal temperature, and then ddH2O was added to 100 mL. Several beakers with 50 mL distilled water were prepared. 5 mL of 0%, 10%, 20%, 30%, 40% pure amylose (w/v) solution and tested samples were inhaled into each beaker, respectively. Acetic acid was added to adjust pH to 4.5–4.7. Two milliliters of iodine solution (0.2 g iodine tablets were added to 100 mL 2% KI solution and fully dissolved) was added into starch solution and stood for 20 min. The absorbance was measured at 620 nm. The amylose content was calculated by absorbance as in previous publication (Qiu et al., 2018).
Rice transparency and chalkiness rate were measured according to the protocol of Wanshen SC-E rice phenotypes quality detector (Wanshen Co., Hangzhou). Alkali elimination value was tested with Qiu et al. (2018) methods.
Yeast-two-hybrid assay
The coding sequence (CDS) of OsCEN2/OsFD2 was amplified and inserted into pGBK-T7 vector (Clontech, Mountain View, CA, USA). The CDS of GF14f/OsFD2 were amplified and cloned into pGAD-T7 vector. All primers used for vector construction are listed in Supplemental Table S1. To confirm the interaction between two proteins, two vectors were co-transformed into yeast and screened on selective medium.
Scanning electron microscopy
For histological analysis, young spikelet hulls were freshly picked and fixed in formalin-acetic acid-alcohol (FAA) solution (50% alcohol: formalin (37%–40% formaldehyde): glacial acetic acid; 18:1:1) for at least 24 h. Scanning electron microscopy (SEM) was performed as described previously (Li et al., 2010).
Histological analysis
Young spikelet hulls were fixed with a mixture of 4% paraformaldehyde (w/v) and 1.5% glutaraldehyde in PBS solution at 4 °C for at least 24 h. Then they were dehydrated in an ethanol series (from 50 to 100%), cleared with acetone. The samples were infiltrated with resin/acetone series and embedded in resin, and then placed in an oven at 60 °C for 48 h. Semi-thin sections (1 μm thick) were cut and stained with 0.02% (w/v) toluidine blue for 2 min at room temperature. Photographs were taken on a light microscope. The specific steps are the same as described previously (Zhou et al., 2014; Yi et al., 2016).
Accession numbers
Sequence data are available through RAP-DB under the following accession numbers: OsFD2 (Os06g0720900), OsCEN2 (Os11g0152500), GF14f (Os03g0710800).
Supplemental data
The following materials are available in the online version of this article.
Supplemental Figure S1. Transcript expression level analysis of OsCEN2 in flag leaves with RT-qPCR.
Supplemental Figure S2. Sequence alignment between ZH11 and knockout mutants of T2 generation plants.
Supplemental Figure S3. Grain morphology of WT and transgenic lines.
Supplemental Figure S4. Grain weight per plant of ZH11, OsCEN2-overexpression, and knockout plants.
Supplemental Figure S5. Rice quality and nutritional properties of seeds in different lines.
Supplemental Figure S6. OsCEN2 influences grain filling rate and grain weight.
Supplemental Figure S7. Cell number of the outer parenchyma layer of the spikelet hulls.
Supplemental Figure S8. Yeast two-hybrid analysis.
Supplemental Figure S9. Yeast two-hybrid analysis of OsCEN2 and OsFD2.
Supplemental Figure S10. Subcellular localization of the GFP-OsFD2 and GFP-GF14f fusion protein in rice protoplasts.
Supplemental Figure S11. Gross plant morphology of ZH11 and overexpression lines at reproductive stage.
Supplemental Figure S12. Phenotypes of main panicles and agronomic characters of transgenic plants of OsFD2.
Supplemental Figure S13. Grain morphology of overexpression lines and transcript expression level.
Supplemental Figure S14. Mutation of OsFD2 knockout plants compared with ZH11.
Supplemental Figure S15. Gross morphologies of plant and grain of ZH11 and OsFD2 knockout lines.
Supplemental Figure S16. The OsFD2-overexpression lines show decreased grain filling rate and grain weight.
Supplemental Figure S17. Relative expression levels of grain size-related genes with RT-qPCR analysis.
Supplemental Table S1. List of primers used in the study.
C.Z. and D.J. designed the research, revised the paper, and agree to serve as the author responsible for contact and ensure communication. Y.H. performed most experiments and prepared article draft. L.L. and W.S. performed rice transformation. J.T. and X.L. performed detection of the transgenic plants. S.Z., W.C., and J.L. managed the field materials and performed statistical analysis.
The author responsible for distribution of materials integral to the findings presented in this article in accordance with the policy described in the Instructions for Authors (https://dbpia.nl.go.kr/plphys/pages/general-instructions) is: Dagang Jiang ([email protected]).
Acknowledgments
We thank Prof. Letian Chen and Zhenlan Liu for providing valuable comments to improve the paper.
Funding
This work was supported by the Major Program of Guangdong Basic and Applied Research (grant no. 2019B030302006) and the National Natural Science Foundation of China (grant no. 31100872).
Conflict of interest statement. The authors declare no conflicts of interest.
References
Author notes
Senior author
