


Abstract
The majority of transcriptome sequencing (RNA-seq) expression studies in plants remain underutilized and inaccessible due to the use of disparate transcriptome references and the lack of skills and resources to analyze and visualize these data. We have developed expVIP, an expression visualization and integration platform, which allows easy analysis of RNA-seq data combined with an intuitive and interactive interface. Users can analyze public and user-specified data sets with minimal bioinformatics knowledge using the expVIP virtual machine. This generates a custom Web browser to visualize, sort, and filter the RNA-seq data and provides outputs for differential gene expression analysis. We demonstrate expVIP’s suitability for polyploid crops and evaluate its performance across a range of biologically relevant scenarios. To exemplify its use in crop research, we developed a flexible wheat (Triticum aestivum) expression browser (www.wheat-expression.com) that can be expanded with user-generated data in a local virtual machine environment. The open-access expVIP platform will facilitate the analysis of gene expression data from a wide variety of species by enabling the easy integration, visualization, and comparison of RNA-seq data across experiments.
The global demand for staple crops is predicted to double by 2050 (FAO, 2009; Tilman et al., 2011), which will require an annual increase in yield of approximately 2.4% (Ray et al., 2013). However, currently, yields of the major crops maize (Zea mays), rice (Oryza sativa), wheat (Triticum aestivum), and soybean (Glycine max) are increasing only at 1.6%, 1%, 0.9%, and 1.3% per year, respectively (Ray et al., 2013). The advent of the genomics era represents a great opportunity to accelerate the pace of yield increase in staple crops, for example, by facilitating novel breeding strategies (Heffner et al., 2009) and providing unprecedented numbers of genetic markers (Bevan and Uauy, 2013). In particular, transcriptome sequencing (RNA-seq) is a widely adopted genomics approach in crops due to its relatively low cost (Wang et al., 2009), its suitability for nonmodel organisms (Ekblom and Galindo, 2011), and the multiple downstream applications of the data generated. These features have driven the generation of a wealth of expression data with over 9,000 RNA-seq samples currently available at public repositories, such as the National Center for Biotechnology Information (NCBI)/ENA for the major agricultural crops (Table I).
Publicly available RNA sequencing samples in the NCBI short read archive (SRA) for the top 10 crops based on production (FAO, 2015) and additional agricultural species (as of August 5, 2015)
| Species (Common Name) | Samples in the SRA Database | Ploidy (Recent WGD) |
|---|---|---|
| Saccharum officinarum (sugarcane) | 46 | 8×/10× |
| Zea mays (maize) | 3,514 | 2× (WGD) |
| Oryza sativa (rice) | 1,264 | 2× |
| Triticum aestivum (wheat) | 799 | 6× |
| Solanum tuberosum (potato) | 337 | 4× |
| Manihot esculenta (cassava) | 61 | 2× |
| Glycine max (soybean) | 972 | 2× (WGD) |
| Beta vulgaris (sugar beet) | 32 | 2× |
| Solanum lycopersicum (tomato) | 830 | 2× |
| Hordeum vulgare (barley) | 269 | 2× |
| Musa acuminata (banana) | 73 | 2×/3× (WGD) |
| Sorghum bicolor (sorghum) | 128 | 2× |
| Brassica spp. (field mustard and oilseed rape) | 835 | 2×/4× |
| Phaseolus vulgaris (common bean) | 106 | 2× |
| Gossypium hirsutum (cotton) | 468 | 4× |
| Vitis vinifera (grape) | 448 | 2× |
Although several public databases containing gene expression data for plant species exist (Lawrence et al., 2007; Ouyang et al., 2007; Dash et al., 2012), these resources do not make full use of the expression data available in SRAs, frequently relying on a subset of experiments or microarray data. Similarly, pipelines have been proposed to allow the reanalysis of expression data that provide useful functionality but limit the number of samples that can be analyzed (D’Antonio et al., 2015), have limited visualization outputs (Fonseca et al., 2014), or require the user to process their own data before uploading to a visualization tool (Nussbaumer et al., 2014). In most cases, visualization tools are static and do not allow meaningful comparison of data. In addition, many studies used disparate transcriptome assemblies or annotations that hinder the possibility to compare results across different biological samples (Gillies et al., 2012; Pfeifer et al., 2014). Thus, despite the significant investment in RNA-seq studies across the major agricultural crops, these data remain largely underutilized and inaccessible to the majority of breeders and biologists due to the lack of common platforms and resources to analyze the data.
We have developed expVIP (expression Visualization and Integration Platform), an adaptable platform to create a gene expression interface for any species with a transcriptome assembly available. We provide a user-friendly virtual machine implementation allowing breeders and biologists to access this resource on a desktop personal computer. expVIP takes an input of RNA-seq reads (from single or multiple studies), quantifies expression per gene using the fast pseudoaligner kallisto (Bray et al., 2015), and creates a database containing expression and sample information. This platform allows comparisons across studies, and the output is viewable as a Web browser interface with intuitive and interactive filtering, sorting, and export options.
We have implemented expVIP on wheat to demonstrate its potential to be applied to crop species. In particular, our analysis of wheat data demonstrates the pipeline’s ability to handle data from polyploid species, a key aspect for agricultural research, since many of the world’s major crops are polyploid or have undergone recent whole-genome duplication events (Bevan and Uauy, 2013; Table I). In the case of wheat, we reanalyzed 418 RNA-seq samples from 16 studies including diverse developmental time courses, tissues, pathogen infections, and abiotic stresses. We conducted a series of analyses to demonstrate its utility for candidate gene characterization and its potential to compare across independent studies and generate novel hypotheses. Using expVIP, we developed a wheat expression browser (www.wheat-expression.com) as a community resource to access publicly available wheat RNA-seq data.
RESULTS
Pipeline for Expression Analysis and Browser Interface
We developed expVIP (Fig. 1), which pseudoaligns and quantifies short reads from RNA-seq experiments to detect and visualize gene expression data through a user-friendly interface. expVIP requires three input files: the RNA-seq reads, a reference transcriptome, and the metadata from the RNA-seq studies. Since the reference transcriptome is user specified, expVIP can facilitate the analysis of RNA-seq data from any species and can use custom reference sequences. expVIP is available in two formats from Github: (1) the source code and (2) a virtual machine implementation that allows easy use of the pipeline and data display from a desktop machine without requiring bioinformatics expertise (see “Materials and Methods”).
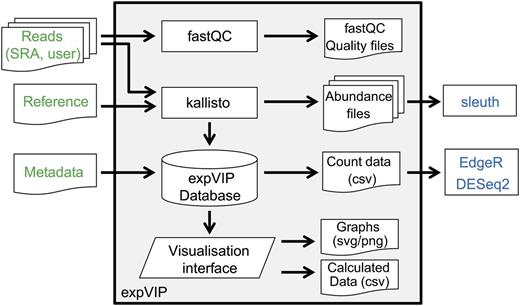
Implementation of expVIP. User inputs are highlighted in green. Downstream differential gene expression analysis (blue) can be performed on expVIP outputs, which are preformatted for this use. External programs are in rectangles, document symbols represent inputs and outputs, the trapezoid represents the visualization interface, and the cylinder represents the expVIP relational database.
To illustrate the uses and flexibility of expVIP, we have implemented it to create a wheat gene expression browser (www.wheat-expression.com; Supplemental Text S1), which until now has been lacking in this important crop species. This browser can be used directly with the available wheat expression data, or users can add their own wheat RNA-seq reads to place their data within a wider context of previously published studies. Similar gene expression browsers can be easily developed for any species using the virtual machine or source code.
Global Analysis in Wheat: Validation of Methods
We used expVIP to analyze 16 wheat gene expression studies from the SRA across a range of tissues, developmental stages, and stress conditions (Table II). In total, these included 418 individual samples containing over 11 billion reads, of which 7.4 billion mapped to the reference International Wheat Genome Sequencing Consortium (IWGSC) gene models from EnsemblPlants containing 103,274 genes (Supplemental Table S1). The median number of reads per study was 213 million, with 137 million reads mapped per study.
SRA studies analyzed with expVIP
| Study Identifier | Summary | Total Reads | Mapped Reads and Percentage | Reference |
|---|---|---|---|---|
| DRP000768 | Phosphate starvation in roots and shoots | 118,053,746 | 84,529,715 (72%) | Oono et al. (2013) |
| ERP003465 | Fusarium head blight-infected spikelets | 1,827,362,091 | 1,357,197,955 (74%) | Kugler et al. (2013) |
| ERP004505 | Grain tissue-specific developmental time course | 873,709,556 | 475,184,621 (54%) | Pfeifer et al. (2014) |
| SRP004884 | Flag leaf down-regulation of GPC | 209,427,573 | 121,855,143 (58%) | Cantu et al. (2011) |
| SRP013449 | Grain tissue-specific developmental time course | 132,702,451 | 82,417,257 (62%) | Gillies et al. (2012) |
| SRP017303 | Stripe rust-infected seedlings | 33,361,836 | 13,732,210 (41%) | Cantu et al. (2013) |
| SRP022869 | Septoria tritici-infected seedlings | 100,582,632 | 63,155,877 (63%) | Yang et al. (2013) |
| SRP028357 | Shoots and leaves of nullitetra group 1 and group 5 | 3,304,500,117 | 2,258,692,000 (68%) | Leach et al. (2014) |
| SRP029372 | Grain tissue-specific developmental time course | 101,477,759 | 17,525,439 (17%) | Li et al. (2013) |
| SRP038912 | Comparison of stamen, pistil, and pistilloidy expression | 217,315,378 | 153,009,134 (70%) | Yang et al. (2015) |
| SRP041017 | Stripe rust and powdery mildew infection time course | 395,463,786 | 272,228,560 (69%) | Zhang et al. (2014) |
| SRP041022 | Developmental time course of synthetic hexaploid | 134,641,113 | 84,583,556 (63%) | Li et al. (2014) |
| ERP008767 | Grain tissue-specific expression at 12 DPA | 45,213,827 | 26,420,708 (58%) | Pearce et al. (2015) |
| SRP045409 | Drought and heat stress time course in seedlings | 921,578,806 | 533,928,182 (58%) | Liu et al. (2015) |
| ERP004714 | Developmental time course of cv Chinese Spring | 1,536,051,415 | 1,066,712,760 (69%) | Choulet et al. (2014) |
| SRP056412 | Grain developmental time course with the 4A dormancy quantitative trait locus | 1,875,916,011 | 808,809,053 (43%) | Barrero et al. (2015) |
We found that 99% of genes (102,259) had at least one read mapping to them, and 85% of genes (88,528) were expressed in at least one sample at over 2 transcripts per million (tpm), which has been advocated as the cutoff for real expression over noise (Wagner et al., 2013). Using this cutoff, on average, 34% of genes (35,549) were expressed per sample, with a minimum expression of 11% of genes (10,899) at 20 DPA in the starchy endosperm and a maximum of 48% of genes (50,224) expressed in the spike at anthesis.
We found that, across all samples, there was a weak (adjusted r 2 = 0.07), albeit significant (P = 1.48 × 10⁻⁸), relationship between the number of mapped reads and the number of genes expressed. This indicates that, although our samples varied widely in their number of mapped reads (1.1–63.6 million), this did not limit comparisons between studies (Supplemental Fig. S1).
We investigated whether, despite coming from diverse studies, tissue-specific expression patterns could be detected. We found that, in general, expression profiles were similar between samples from the same tissue (Fig. 2). For example, grain samples (Fig. 2, red) originating from seven independent studies were found in one main group and leaf and stem samples (Fig. 2, green) from nine studies largely belonged to two groups. However, in some cases, samples from different tissues clustered together, including root samples, which grouped with leaf/stem and spike samples. To further examine the expression patterns of genes in different tissues, we identified the 10 most highly expressed genes in grain and leaves (Supplemental Table S2). We found that, in the grain, six out of the 10 most highly expressed genes encode components of gluten, which is the principal storage protein in wheat grain (Shewry, 2009). In the leaves, several of the most highly expressed genes are related to photosynthesis (Andersson and Backlund, 2008). These results indicate that our data analysis reflects the expected gene expression profiles and supports combining of data from diverse studies.
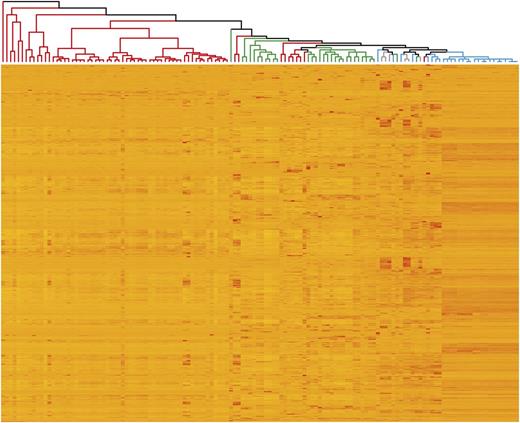
Similarity of expression profiles between samples (columns), with replicate samples averaged and excluding samples from nullitetrasomic lines. One thousand randomly selected genes are represented, one gene per row. Only genes expressed in at least one sample over 2 tpm were used. Colors on the dendrogram indicate the tissues from which samples originate: grain (red), spike excluding grain (blue), leaves/stem (green), and roots (gray).
Accurate Read Mapping Enables Homeologue Specificity
Many crop species are polyploids that contain closely related homeologous genomes, which share highly similar nucleotide sequences within coding regions. This poses a challenge for assigning short reads to the correct gene copy (homeologue). To assess whether kallisto could correctly assign reads to the relevant homeologue, we used a unique genetic resource available in wheat: nullitetrasomic lines (Sears, 1954). Normal bread wheat contains three copies of most genes, one on each of the A, B, and D homeologous chromosomes, and these genes share over 95% identity in coding sequences (Krasileva et al., 2013). In nullitetrasomic lines, one chromosome is specifically deleted (nulli) and compensated by an additional copy of a homeologous chromosome (tetra). Nullitetrasomic lines for chromosome 1 had been sequenced previously (SRP028357), and we used the data in our analysis.
For this analysis, we selected only genes present as three homeologous copies on group 1 chromosomes, with at least one homeologue expressed at over 2 tpm in the wild type (2,645 genes in shoots and 3,445 genes in roots). We compared the expression of genes located on chromosomes 1A, 1B, and 1D between wild-type and nullitetrasomic lines (Fig. 3). In wild-type plants, average gene expression was quite even between the three homeologous genomes (36.6%, 30.9%, and 32.5% for A, B, and D in shoots and 33.4%, 32.3%, and 34.4% for A, B, and D in roots). Similarly, in nullitetrasomic lines for the homeologue, which was present with two copies (as in the wild type), expression was 34% of total in shoots and 33.8% in roots. In contrast, expression of the homeologue that was deleted in the nullitetrasomic lines was strongly decreased to 5.9% and 5.3% of total in shoots and roots, respectively. Expression of the homeologue that was present with four copies (2× the wild type) rose to 60.1% and 60.9% of total for shoots and roots, respectively. These results demonstrate that, even in the extreme case where expression from one homeologue has been abolished completely by chromosomal deletion, our pipeline can accurately distinguish from which homeologue gene expression originated. Analysis of a manually curated set of 52 tetraploid wheat homeologues showed that they share 97.3% ± 1.2% DNA sequence identity and that the distance between adjacent variants decreases exponentially, with an average separation of approximately 38 bp. This determines that 8% of single-nucleotide polymorphisms (SNPs) between A and B genome homeologous are over 100 bp apart (Krasileva et al., 2013). This would prevent reads containing these widely spaced SNPs from being unambiguously mapped to one homeologue, explaining why we observe a residual level of expression from the deleted chromosome in the nullitetrasomic lines.
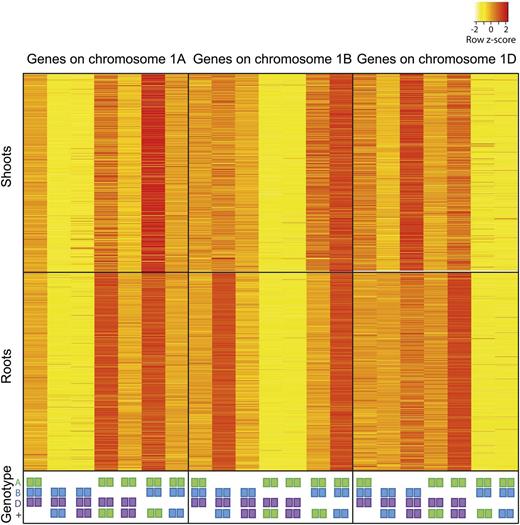
Expression of genes with three homeologous copies on chromosome 1 in nullitetrasomic wheat lines in shoots and roots. Genotypes for chromosome 1 are indicated by colored squares: A genome in green, B genome in blue, and D genome in purple. Squares listed at bottom (+) indicate extra copies (tetra); the absence of squares indicates deletion (nulli) of the entire chromosome.
Comparison of kallisto with bowtie2 Combined with eXpress
Since kallisto is a newly released pseudoalignment tool for the quantification of RNA-seq data, we compared its performance with a more conventional RNA-seq quantification pipeline using bowtie2 and eXpress. We found that kallisto and bowtie2 had very similar overall alignment rates (62.7% and 63.4%, respectively; Supplemental Table S1). kallisto identified slightly more genes as expressed in at least one sample at over 2 tpm: 88,528 compared with the 87,842 genes identified by bowtie2 + eXpress. As an assessment of accuracy, we compared their performance using the nullitetrasomic wheat lines described previously. We found that kallisto was slightly more accurate than bowtie2 + eXpress: on average, kallisto assigned 5.6% of total gene expression to have originated from the deleted chromosome, whereas bowtie2 + eXpress assigned 7% of total gene expression (Supplemental Table S3). These results support the use of kallisto, given its fast running times and high accuracy (Bray et al., 2015).
Powerful Visualization and Data Integration Platform
expVIP is highly flexible, as it allows the user to supply metadata to classify samples according to different categories (based on their biological question), which are then uploaded into the database. The visualization interface allows users to group, filter, sort, and download their data according to the categories specified in the metadata. This design provides control over precise categories to be used in the database, and the visualization interface will adjust accordingly. For example, we classified the expression data at www.wheat-expression.com by broad and specific categories for age, tissue, disease/abiotic stress, and variety (Supplemental Tables S1 and S4). This hierarchical structure allows users to group data for an initial high-level assessment and then open up data into specific samples, analogous to main effects and simple effects in statistical analyses (Supplemental Table S4). This structure can be modified as required by users by simply modifying the metadata input file or by providing a different nomenclature for classification, such as Plant Ontology temporal and anatomy accession identifiers (Avraham et al., 2008). We describe below how this visualization interface can be used to facilitate research.
Candidate Gene Function Prediction
Fine-mapping frequently results in a candidate gene list within a defined genetic interval. Understanding gene expression patterns can help narrow down this list but typically requires the development of homeologue-specific quantitative PCR (qPCR) primers, which is challenging and time consuming in polyploids. Using the wheat expression browser, we are now able to rapidly investigate in silico candidate gene expression patterns.
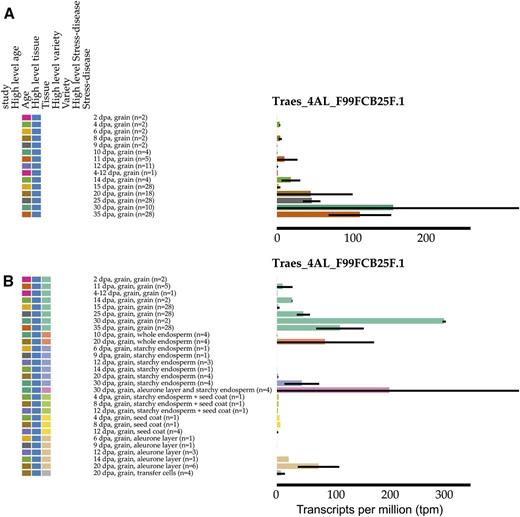
For example, a physical contig containing seven candidate genes for grain preharvest sprouting resistance was published recently (Barrero et al., 2015). Therefore, we organized and sorted the data based on the tissue origin of the RNA-seq sample. We displayed the expression data for the six candidate genes in this region with genome annotation either as a heat map (Fig. 4A) or individual bar graphs (Fig. 4B). We find that one gene is expressed at very low levels below 2 tpm in all tissues (Traes_4AL_DD1B27086.2) and that three genes are most highly expressed in roots (Traes_4AL_9A01E952D.1, Traes_4AL_1C557F688.1, and Traes_4AL_65DF744B71.3), with very little expression in the grain, where genes involved in precocious germination would be expected. Two closely related genes show expression solely in the grain: Traes_4AL_BFAB568BF.1 and Traes_4AL_F99FCB25F.1, with the latter having much higher expression.
![A simple search on www.wheat-expression.com reveals gene expression patterns of six candidate genes within a quantitative trait locus region for preharvest sprouting. The data may be displayed as a heat map for all six genes simultaneously (A), with the intensity of the blue color indicating the expression level [log2(tpm)]. Alternatively, each gene may be displayed individually as a bar graph (B) in tpm. The display was configured to average data according to the high-level tissue; hence, all samples coming from spike (red), grain (blue), leaves/shoots (green), and roots (purple) are averaged according to their respective categories. Genes are ordered from lowest expressed (left [A] and top [B]) to highest expressed (right [A] and bottom [B]). Note that axes in B are not equal because expVIP recalculates the axis for each gene individually.](https://oup.silverchair-cdn.com/oup/backfile/Content_public/Journal/plphys/170/4/10.1104_pp.15.01667/3/m_plphys_v170_4_2172_f4.jpeg?Expires=1747862271&Signature=DkS~N5Adz2xyiwvENDLVU-946CwQzvWmm7T~nvoFENTf2K8krFlnfdMV2CCHgmy0-xhoF9ygDXdwLHogzz7w2dEb1LSdG4cH-VzKtANVdL8kInvGS3eVVx-kWyuVE6lpC3vI5ylT0BsJ6AW3jr0jO8fEQ-j4H4o6UB3y~yaw3zPhh8afwB1L1tPUkpx89n69wL7XGNv48UtpTrSIXVzNMeuHYtPZyMbru-HJOPDprUvf6TcCe1vr6~Vqp7VzMu2Ch9WPp9Sck62xIM1pmw2mp-Y4ZtaiNpKs6fPpg~QQBMWroPs7vQmAYZitouZDYyStKYNng5WOALNxvf~X0L2EMQ__&Key-Pair-Id=APKAIE5G5CRDK6RD3PGA)
A simple search on www.wheat-expression.com reveals gene expression patterns of six candidate genes within a quantitative trait locus region for preharvest sprouting. The data may be displayed as a heat map for all six genes simultaneously (A), with the intensity of the blue color indicating the expression level [log2(tpm)]. Alternatively, each gene may be displayed individually as a bar graph (B) in tpm. The display was configured to average data according to the high-level tissue; hence, all samples coming from spike (red), grain (blue), leaves/shoots (green), and roots (purple) are averaged according to their respective categories. Genes are ordered from lowest expressed (left [A] and top [B]) to highest expressed (right [A] and bottom [B]). Note that axes in B are not equal because expVIP recalculates the axis for each gene individually.
To further define the expression patterns, we displayed the age and specific tissue of the samples. This filtering and dynamic sorting is available in both heat map and bar graph modes. Focusing on Traes_4AL_F99FCB25F.1 displayed as a bar graph (Fig. 5A), we see that this gene is most highly expressed during the latter stages of grain development, consistent with a role in grain dormancy imposition, and that expression is strongest in whole grain and mostly absent in seed coat and endosperm tissues (Fig. 5B), suggesting that expression might originate from the embryo. The color code of the graph dynamically alters to reflect the most recent category selected by the user. The two candidate genes highlighted by this analysis (Traes_4AL_BFAB568BF.1 and Traes_4AL_F99FCB25F.1) were recently shown to act as positive regulators of dormancy (Barrero et al., 2015).
Expression of Traes_4AL_F99FCB25F.1 in grains categorized by age (A) and age and tissue (B). The colors represent age (A) or tissue (B): the color coding of the graph is determined by the most recent category clicked by the user.
Identification of Stable Reference Genes
To compare gene expression levels, a widely used method is qPCR, which requires stably expressed reference genes across all samples being compared. The integrated data available from expVIP allow quick analysis to identify potential novel reference genes. To identify reference genes suitable for wheat across diverse tissues, developmental stages, and stress and disease conditions, we included 321 out of the total 418 wheat samples included at www.wheat-expression.com (we excluded 97 samples that were from nullitetrasomic samples to avoid bias against the missing chromosomes in those samples). We found that 3,170 genes were expressed at over 2 tpm in all 321 samples. We calculated the coefficient of variation as a measure of the stability of expression across all samples. These varied from 32.7% for the most stable gene to 318% for the least stable gene, with the median coefficient of variation being 61.6% (Fig. 6A; Supplemental Table S5). We investigated whether genes commonly used as reference genes in qPCR were stably expressed in our samples. We found that 1,736 genes were more stably expressed than 13 commonly used reference genes (Yan et al., 2003; Tenea et al., 2011; Qi et al., 2012; Fig. 6A; Supplemental Table S6), seven of which were not expressed in all samples at over 2 tpm (Fig. 6A). We selected the 20 most stable genes (Fig. 6B) and found a much narrower range of variation in expression levels compared with the commonly used reference genes (Fig. 6C). These stably expressed genes had a range of different functions, including ubiquitin-mediated protein degradation, DNA binding, and signal transduction (Table III).
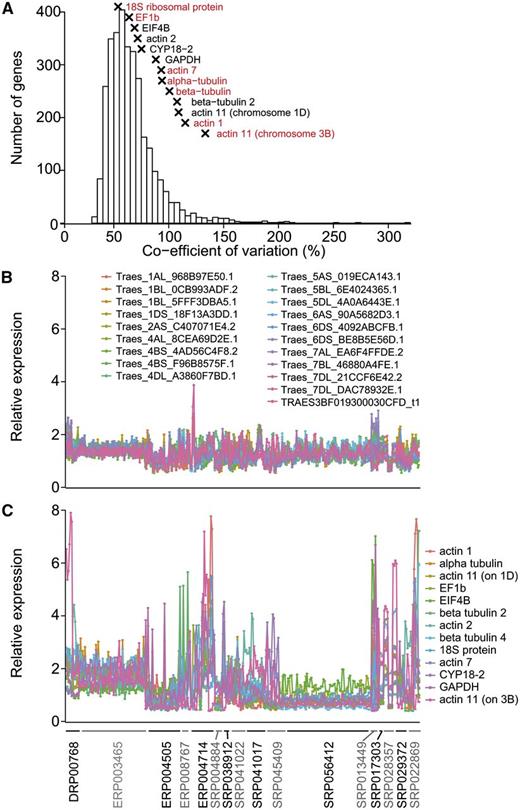
Stability of gene expression between samples. A, Coefficient of variation for genes that are expressed at over 2 tpm in all samples. Commonly used reference genes are indicated by crosses (x), and reference genes in red are not expressed at over 2 tpm in all samples. B and C, Expression of the 20 most stably expressed genes (B) and 13 commonly used reference genes (C) across 321 wheat samples belonging to 16 studies indicated on the x axis. The expression level of each gene in a sample is relative to the average expression level of this gene across all samples. Abbreviations are as follows: elongation factor 1-β (EF1b), eukaryotic translation initiation factor 4B (EIF4B), cylophilin A (CYP18-2), and glyceraldehyde 3-phosphate dehydrogenase (GAPDH).
Twenty most stably expressed genes across all 321 wheat samples
| Ensembl Transcript Identifier | Mean Expression Level (tpm) | Coefficient of Variation (%) | Putative Functiona |
|---|---|---|---|
| Traes_1DS_18F13A3DD.1 | 13 | 33 | RING zinc finger domain superfamily protein |
| Traes_5AS_019ECA143.1b | 13 | 33 | Ion channel |
| Traes_7BL_46880A4FE.1 | 8 | 33 | Ser/Thr protein kinase |
| Traes_6DS_4092ABCFB.1 | 7 | 34 | Uncharacterized protein |
| Traes_6DS_BE8B5E56D.1b | 24 | 34 | Ser/Thr protein kinase |
| Traes_6AS_90A5682D3.1 | 21 | 34 | Ser/Thr protein kinase |
| Traes_1AL_968B97E50.1b | 15 | 34 | ATP-dependent zinc metalloprotease FTSH8 |
| Traes_2AS_C407071E4.2 | 9 | 34 | WRKY family transcription factor family protein |
| Traes_4BS_F96B8575F.1 | 6 | 34 | Uncharacterized protein |
| Traes_4DL_A3860F7BD.1 | 9 | 35 | DEAD box ATP-dependent RNA helicase38 |
| Traes_1BL_0CB993ADF.2 | 10 | 35 | VHS and GAT domain-containing protein |
| Traes_7DL_DAC78932E.1 | 9 | 35 | DGCR14-related |
| Traes_7DL_21CCF6E42.2 | 9 | 35 | GCIP-interacting family protein |
| TRAES3BF019300030CFD_t1 | 14 | 35 | Uncharacterized protein |
| Traes_1BL_5FFF3DBA5.1 | 15 | 35 | Ubiquitin family protein |
| Traes_5DL_4A0A6443E.1 | 12 | 35 | Uncharacterized protein |
| Traes_4AL_8CEA69D2E.1b | 31 | 35 | Ubiquitin-conjugating enzyme |
| Traes_7AL_EA6F4FFDE.2 | 13 | 35 | Zinc finger protein |
| Traes_4BS_4AD56C4F8.2b | 13 | 36 | Uncharacterized protein |
| Traes_5BL_6E4024365.1 | 9 | 36 | Gal oxidase/Kelch repeat superfamily protein |
For genes that were not annotated in wheat, putative functions were assigned by orthology to rice, maize, and Arabidopsis genes according to EnsemblPlants.
Gene stability tested by qPCR.
| Ensembl Transcript Identifier | Mean Expression Level (tpm) | Coefficient of Variation (%) | Putative Functiona |
|---|---|---|---|
| Traes_1DS_18F13A3DD.1 | 13 | 33 | RING zinc finger domain superfamily protein |
| Traes_5AS_019ECA143.1b | 13 | 33 | Ion channel |
| Traes_7BL_46880A4FE.1 | 8 | 33 | Ser/Thr protein kinase |
| Traes_6DS_4092ABCFB.1 | 7 | 34 | Uncharacterized protein |
| Traes_6DS_BE8B5E56D.1b | 24 | 34 | Ser/Thr protein kinase |
| Traes_6AS_90A5682D3.1 | 21 | 34 | Ser/Thr protein kinase |
| Traes_1AL_968B97E50.1b | 15 | 34 | ATP-dependent zinc metalloprotease FTSH8 |
| Traes_2AS_C407071E4.2 | 9 | 34 | WRKY family transcription factor family protein |
| Traes_4BS_F96B8575F.1 | 6 | 34 | Uncharacterized protein |
| Traes_4DL_A3860F7BD.1 | 9 | 35 | DEAD box ATP-dependent RNA helicase38 |
| Traes_1BL_0CB993ADF.2 | 10 | 35 | VHS and GAT domain-containing protein |
| Traes_7DL_DAC78932E.1 | 9 | 35 | DGCR14-related |
| Traes_7DL_21CCF6E42.2 | 9 | 35 | GCIP-interacting family protein |
| TRAES3BF019300030CFD_t1 | 14 | 35 | Uncharacterized protein |
| Traes_1BL_5FFF3DBA5.1 | 15 | 35 | Ubiquitin family protein |
| Traes_5DL_4A0A6443E.1 | 12 | 35 | Uncharacterized protein |
| Traes_4AL_8CEA69D2E.1b | 31 | 35 | Ubiquitin-conjugating enzyme |
| Traes_7AL_EA6F4FFDE.2 | 13 | 35 | Zinc finger protein |
| Traes_4BS_4AD56C4F8.2b | 13 | 36 | Uncharacterized protein |
| Traes_5BL_6E4024365.1 | 9 | 36 | Gal oxidase/Kelch repeat superfamily protein |
For genes that were not annotated in wheat, putative functions were assigned by orthology to rice, maize, and Arabidopsis genes according to EnsemblPlants.
Gene stability tested by qPCR.
To test whether these newly identified stable genes could be used in qPCR as reference genes, we designed homeologue-specific primers for five genes. The efficiencies ranged from 93.3% to 97.1% (Table IV). To test the stability of these primers, we extracted RNA and synthesized complementary DNA (cDNA) from a diverse range of 30 conditions (Supplemental Table S7), including various tissues, developmental stages, varieties, and disease/stress conditions. We found that all five genes had low coefficients of variation using qPCR (4.4%–8.4%), suggesting that they are suitable for use as reference genes (Table IV). We found that the coefficients of variation measured by qPCR were lower than those found by RNA-seq analysis. This may be due to the qPCR using a smaller panel of samples (30 conditions) compared with the 321 samples included in the RNA-seq analysis. Furthermore, the qPCR analysis used more homogeneous sample extraction methods than the RNA-seq samples, which were from a diverse range of studies carried out in different laboratories, which might have introduced extra variability.
Homeologue-specific primers designed for five of the most stably expressed genes identified from 321 wheat samples
The stability of the expression of these five genes was tested across 30 independent conditions, including different tissues, developmental stages, varieties, and disease infection (for details, see Supplemental Table S7).
| Ensembl Transcript Identifier | Primer Sequences (5′–3′) | Primer Efficiency (%) | Coefficient of Variation (%) |
|---|---|---|---|
| Traes_4AL_8CEA69D2E.1 | CGGGCCCGAAGAGAGTCT | 97.1 | 7.1 |
| ATTAACGAAACCAATCGACGGA | |||
| Traes_4BS_4AD56C4F8.2 | TCGTTGCTTGAGGAAAATG | 93.7 | 8.2 |
| CATGACCGTCTTATTTATGGCA | |||
| Traes_1AL_968B97E50.1 | TTTGCACAGTATGTACCAAATGAG | 95.0 | 5.8 |
| TCTTCCAATCAAAACCTCCTCT | |||
| Traes_5AS_019ECA143.1 | TCTAAATGTCCAGGAAGCTGTTA | 96.0 | 4.4 |
| CCTGTGGTGCCCAACTATT | |||
| Traes_6DS_BE8B5E56D.1 | CATGCTCTGGGATTTATCCAT | 93.3 | 8.4 |
| CTGGATCATTTCCGGTGC |
The five novel genes tested had equivalent stability to five of the most stable commonly used reference genes across the 30 conditions tested (6.8% ± 1.7% and 6.4% ± 1.4%, respectively; Supplemental Table S8). The commonly used reference genes were originally identified in flag leaves (Tenea et al., 2011) and had lower coefficients of variation (3% ± 1%) than the novel genes (5.5% ± 2.3%) in this tissue. However, in the grain, the novel reference genes had much lower coefficients of variation (2.7% ± 0.5%) than the commonly used reference genes (6.6% ± 2.5%), indicating that, under specific sets of conditions, these novel reference genes outperform current reference genes. The strong stability in grain samples may reflect the origin of samples used to identify the novel reference genes: 147 out of the 321 samples used originated from grains. These results indicate that the expVIP platform can help to identify stably expressed genes for use in qPCR, which can be tailored to individual needs either across different tissues or focusing on a particular tissue of interest.
Comparative Analyses to Generate Novel Biological Insights
expVIP allows easy integration of data for differential gene expression analysis. Using the output from kallisto, we used its companion tool sleuth (Pimentel et al., 2015) to identify genes that were differentially expressed in disease and stress conditions compared with control conditions. For this analysis, we included all samples from seedling stage wheat leaves that had replicates. These included two different SRA studies, which comprised samples from 12 different conditions (Table V; for details, see Supplemental Table S1).
Samples used to compare gene expression responses to abiotic and biotic stresses
| Study | Age | Conditions | Replicates |
|---|---|---|---|
| SRP041017 | 7 d | Stripe rust, 24 h | 3 |
| Stripe rust, 48 h | 3 | ||
| Stripe rust, 72 h | 3 | ||
| Powdery mildew, 24 h | 3 | ||
| Powdery mildew, 48 h | 3 | ||
| Powdery mildew, 72 h | 3 | ||
| SRP045409 | 7 d | Drought stress, 1 h | 2 |
| Drought stress, 6 h | 2 | ||
| Heat stress, 1 h | 2 | ||
| Heat stress, 6 h | 2 | ||
| Drought and heat stress, 1 h | 2 | ||
| Drought and heat stress, 6 h | 2 |
In order to find genes that are differentially expressed in multiple conditions, we used a relaxed threshold to identify differentially expressed genes (q < 0.05). In total, 53% of genes (54,207 genes) were differentially expressed in at least one stress condition compared with the control. The number of differentially expressed genes varied from 2,018 genes after 48 h of stripe rust infection to 34,221 genes after 6 h of combined drought and heat stress (Fig. 7A). In general, the abiotic stresses caused more genes to be differentially expressed than under disease conditions (on average, 27,212 compared with 6,429 genes), and in abiotic stress, more genes were up-regulated than down-regulated, whereas the reverse pattern was observed in disease conditions.
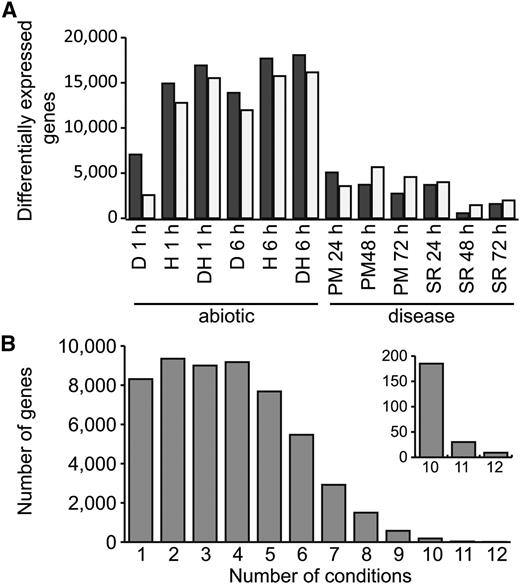
Differentially expressed genes (q < 0.05) in abiotic stress and disease conditions. A, Numbers of up-regulated genes (black bars) and down-regulated genes (gray bars) in individual stress conditions. D, Drought; H, heat; DH, drought and heat combined; PM, powdery mildew; SR, stripe rust. B, Number of genes that are differentially expressed in multiple abiotic stress and disease conditions.
We found that the majority of genes were differentially expressed in multiple conditions (Fig. 7B), indicating that transcriptional responses to different stresses are shared. Comparing between abiotic and disease stress, we found that 38% (20,553 genes) of differentially expressed genes were found in both cases. We detected enrichment for 32 Gene Ontology (GO) terms among the genes differentially expressed in 10 or more abiotic and disease conditions (false discovery rate [FDR] < 0.05; Supplemental Tables S9 and S10). Nineteen of these related to biological processes rather than molecular function or cellular compartment (Table VI). The two most strongly enriched GO terms (GO:0018298 and GO:0009765) were related to chlorophyll a/b-binding proteins, whereas the third most strongly enriched GO term (GO:0006457; protein folding) included three HSP90 family heat shock proteins, three calreticulin/calnexin proteins, and three cyclophilin-type peptidyl-prolyl cis-trans-isomerase domain-containing proteins. Evidence was also found for the regulation of gene expression, and 14 transcription factors were differentially expressed across 10 or more conditions, including members of the NAC, MYB, basic-Leu zipper, zinc finger, and AP2/ERF families. Many of these large gene families have been shown in plants to be involved in abiotic and biotic stress responses (Singh et al., 2002; Feller et al., 2011; Nakashima et al., 2012), but this joint analysis identified precise candidates in wheat based on available experimental data that can be further characterized.
Enriched biological processes in genes differentially expressed in 10 or more abiotic and disease conditions
| GO Accession No. | Term | Percentage of Differentially Expressed Genes | Percentage of Transcriptome | FDR |
|---|---|---|---|---|
| GO:0018298 | Protein-chromophore linkage | 4.0 | 0.1 | 3.00E-09 |
| GO:0009765 | Photosynthesis, light harvesting | 4.0 | 0.2 | 5.20E-05 |
| GO:0006457 | Protein folding | 5.2 | 0.7 | 0.0011 |
| GO:0009651 | Response to salt stress | 2.9 | 0.2 | 0.0041 |
| GO:0006970 | Response to osmotic stress | 2.9 | 0.2 | 0.0066 |
| GO:0065007 | Biological regulation | 17.8 | 8.2 | 0.014 |
| GO:0065008 | Regulation of biological quality | 5.7 | 1.5 | 0.034 |
| GO:0045449 | Regulation of transcription | 10.3 | 4.1 | 0.041 |
| GO:0009889 | Regulation of biosynthetic process | 10.3 | 4.3 | 0.044 |
| GO:0010556 | Regulation of macromolecule biosynthetic process | 10.3 | 4.3 | 0.044 |
| GO:0031326 | Regulation of cellular biosynthetic process | 10.3 | 4.3 | 0.044 |
| GO:0019219 | Regulation of nucleobase, nucleoside, nucleotide, and nucleic acid metabolic process | 10.3 | 4.3 | 0.044 |
| GO:0051171 | Regulation of nitrogen compound metabolic process | 10.3 | 4.3 | 0.044 |
| GO:0080090 | Regulation of primary metabolic process | 10.3 | 4.5 | 0.048 |
| GO:0006355 | Regulation of transcription, DNA dependent | 9.8 | 4.1 | 0.048 |
| GO:0030001 | Metal ion transport | 4.0 | 0.9 | 0.048 |
| GO:0051252 | Regulation of RNA metabolic process | 9.8 | 4.1 | 0.048 |
| GO:0009628 | Response to abiotic stimulus | 4.6 | 1.2 | 0.048 |
| GO:0010468 | Regulation of gene expression | 10.3 | 4.5 | 0.048 |
We identified nine genes that were differentially expressed in all 12 conditions. Examining the expression of these genes in the wheat expression browser gives further insight into their expression patterns across all 16 studies. For example, the ortholog of the endosomal targeting BRO1 gene Traes_2AL_2DFED03C9.2 is strongly up-regulated in abiotic stress conditions (Fig. 8A, purple bar), and opening up the data to look into individual stresses, we find that it is not up-regulated in phosphorous starvation (Fig. 8B, purple bars labeled P-10d). Traes_2AL_2DFED03C9.2 is down-regulated in the majority of disease conditions (Fig. 8B, yellow bars), except in the spike infected with Fusarium graminearum (Fig. 8B, yellow bars labeled fu30h–fu50h) and after 6 d of stripe rust infection (Fig. 8B, yellow bars labeled sr6+d). This visualization also shows that Traes_2AL_2DFED03C9.2 is expressed in all tissues (roots, leaves/stems, spikes, and grains) and is not restricted to seedling leaves, the tissue from which it was identified by our analysis. Selecting the homeologue option allows the expression of homeologous genes to be examined side by side (Fig. 8C). In this case, all three homeologues show a similar pattern of expression in the various samples, and all three homeologues are differentially expressed in 11 or 12 abiotic stress and disease conditions. The expVIP visual interface also allows individual studies to be selected; in this case, the two original studies also can be displayed on their own to visualize the differences identified by sleuth (Supplemental Fig. S2).
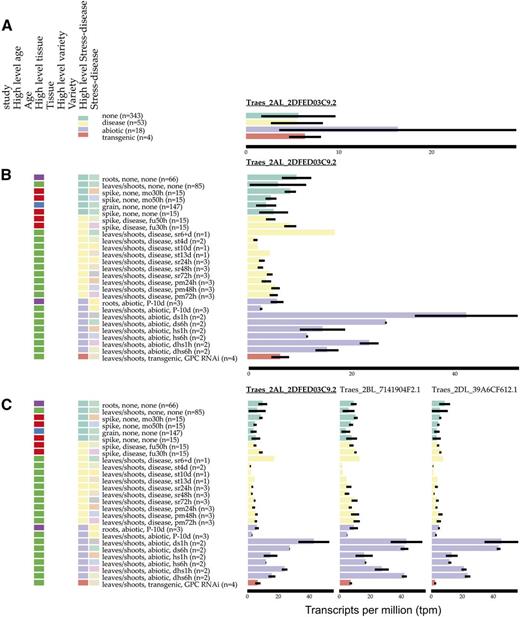
Example of gene expression visualization using expVIP for the gene Traes_2AL_2DFED03C9.2, with samples grouped according to their High level stress-disease (A), Traes_2AL_2DFED03C9.2, with additional categorization of samples including lower level Stress-disease and High level tissue (B), and Traes_2AL_2DFED03C9.2 and its B and D homeologues, which are differentially expressed in 11 and 12 abiotic and disease conditions, respectively (C). The data shown here include expression data from all studies, not just the studies examined for differential expression. Samples are ordered by their High level stress-disease status: none (green), disease (yellow), abiotic (purple), and transgenic (orange).
DISCUSSION
Highly Accurate Pipeline
A major challenge in the analysis of RNA-seq data, particularly in polyploid crop species, is the assignment of short reads to the correct copy of a gene. Using nullitetrasomic wheat lines, we have shown that kallisto as implemented through expVIP accurately assigns reads to the correct homeologue. The visualization interface makes expression data across a wide range of conditions easily available, enabling researchers and breeders to rapidly check the expression patterns of individual homeologues. This will allow a more precise understanding of gene regulation beyond the broad general trends usually reported in wheat with non-homeologue-specific qPCR primers. The ability to query homeologue-specific expression data will also complement growing knowledge about sequence diversity between homeologues. A recent genome-wide analysis between landraces and elite varieties suggested that, during domestication, positive selection was usually restricted to an advantageous mutation within a single homeologue (Jordan et al., 2015). This highlights that understanding of homeologue-specific variation in both sequence and expression will be fundamental for future advances in wheat improvement.
Utility for Functional Genomic Research in Wheat
Until recently, marker availability had been a major constraint in wheat research; however, developments in SNP- and sequence-based genotyping have removed these limitations (Borrill et al., 2015). The focus has now shifted toward the understanding of gene function, which is being accelerated by the availability of a draft reference genome (International Wheat Genome Sequencing Consortium, 2014) and next-generation sequencing-enabled mapping approaches (Ramirez-Gonzalez et al., 2015). The availability of a comprehensive gene expression visualization platform in wheat will facilitate the functional characterization of genes by providing researchers with information regarding where they might be acting. We have demonstrated that the expression browser rapidly delivers information about tissue-specific expression patterns and can help narrow down candidate genes within mapping intervals through both heat-map and single-gene analyses. Furthermore, we have used these data to propose genes with high stability across a wide range of conditions that might represent better reference genes for qPCR than those traditionally used, particularly in grains.
Opportunities for Meta-Analysis
Using the data generated by expVIP for wheat, we compared between samples from a diverse range of abiotic stress and disease conditions, leveraging the unified analysis platform. We found that slightly more genes were up-regulated than down-regulated in abiotic stresses, whereas in disease conditions, the opposite pattern was observed: this contrasts with a previous meta-analysis of rice abiotic and biotic stress microarray experiments, where 60% of differentially express genes were down-regulated under abiotic stress and 60% of differentially expressed genes were up-regulated under biotic stress (Shaik and Ramakrishna, 2014). These results may be different because the rice analysis included additional stress conditions that might have influenced overall trends, microarrays having an incomplete gene complement, or biological differences between species. expVIP will facilitate the meta-analysis of RNA-seq experiments, which has been difficult so far due to nonunified methods of analysis, in contrast to microarray experiments, which have been better catalogued and compared (Zimmermann et al., 2004; Parkinson et al., 2007; Wagner et al., 2013). Although differences were seen between abiotic and disease transcriptional responses, 38% of differentially expressed genes were identified in both abiotic and disease conditions, which is similar to the proportion identified in a comparison of gene expression in rice of drought and bacterial responses (39% shared genes; Shaik and Ramakrishna, 2013).
The majority of genes differentially expressed in 10 or more stress conditions did not show the same direction of expression change in all stresses. For example, three homeologues of an endosome-targeting BRO1 gene (Traes_2AL_2DFED03C9.2, Traes_2BL_7141904F2.1, and Traes_2DL_39A6CF612.1) were up-regulated in abiotic stresses and down-regulated in disease conditions. Manipulating endosomal trafficking by overexpressing a RAB5 GTPase in Arabidopsis (Arabidopsis thaliana) enhanced salt-stress tolerance (Ebine et al., 2012), and endocytic trafficking is also known to be important for disease resistance (Teh and Hofius, 2014), indicating that BRO1 represents a candidate gene to manipulate abiotic stress and disease responses. Several transcription factors from diverse families are also up- and down-regulated in stress conditions; for example, the NAC transcription factor Traes_5BL_4497A137C.1 is up-regulated in response to abiotic stress and during early stripe rust infection but down-regulated later during stripe rust and powdery mildew infection. Analogously, the basic helix-loop-helix (bHLH) transcription factor Traes_5DL_2A286B481.1 is up-regulated during the first 1 h of drought, heat, and drought combined with heat stress, but after 6 h in all three conditions it is down-regulated, suggesting a specific temporal role. In Arabidopsis, bHLH92, the ortholog of Traes_5DL_2A286B481.1, is also induced by abiotic stresses, but its up-regulation is maintained at both 6 and 24 h (Jiang et al., 2009). The ability to combine studies from multiple environmental conditions will allow novel hypothesis generation to deepen our understanding of conserved and divergent responses to abiotic and biotic stresses.
Application to a Range of Species
We demonstrate that expVIP can be used to reanalyze studies using a common reference, allowing accurate and easy comparison between data from different sources. We applied our pipeline to polyploid wheat and generated an open-access expression browser (www.wheat-expression.com). However, the expVIP pipeline and browser interface can be implemented readily into other species to facilitate functional gene characterization. This is especially relevant given the speed with which genomics is progressing: the best reference genomes and transcriptomes change constantly, making it difficult to compare between RNA-seq studies that have used different references. This problem is also exemplified in more mature systems such as rice, where two different genome annotations are widely used: Rice Annotation Project gene models and Michigan State University gene models (Ohyanagi et al., 2006; Ouyang et al., 2007). Although these annotations share many similar genes, they cannot be compared directly. expVIP facilitates the rapid reanalysis of data sets that were originally evaluated with different reference sequences to enable such comparisons on a common set of gene models (Supplemental Text S2).
The flexible expVIP metadata structure can accommodate formal ontologies such as Plant Ontology accession identifiers, which can be linked through established parent-child relationships. This is immediately possible for the temporal and anatomical components of ontologies that are well described and documented (Avraham et al., 2008). However, although ontologies for stress treatments (abiotic and biotic) have been proposed (Walls et al., 2012), they are not commonly implemented. Looking forward, the use of a common platform such as expVIP to analyze RNA-seq data from multiple species will facilitate cross-species comparisons of gene expression between orthologs. Orthologous relationships between genes for multiple plant species are well established (Rouard et al., 2011; Goodstein et al., 2012; Bolser et al., 2015), and they will become increasingly precise as additional genomes are sequenced. This would allow the inclusion of an additional species category within the visualization interface to compare the expression of orthologs across multiple species. However, this will require the research community to improve and engage more actively with the use of ontologies to describe the origin of diverse RNA-seq samples.
The availability of expVIP as a virtual machine will facilitate its application to any species with a transcriptome reference. expVIP is based on the lightweight pseudoaligner kallisto (which we have shown to perform as well if not more accurately that bowtie2 + eXpress), which will allow rapid analysis on a desktop machine without the need for bioinformatics infrastructure. This opens up intuitive and interactive data visualization of gene expression data to researchers using both unpublished and publicly available data.
CONCLUSION
The pipeline and visualization interface we have developed will open up the analysis of gene expression data from a wide variety of species to researchers and breeders. Our application to wheat gene expression data provides a community resource that will aid the functional analysis of wheat genes for their use in research and breeding programs. Moving into the future, the volume of RNA-seq expression data will only increase, and the value from reanalysis and integration of data cannot be underestimated. This is especially relevant given the frequent release of improved reference genomes, which, while welcomed, poses a challenge when comparing RNA-seq data that have been aligned to previous releases. This open-access platform makes a first step toward enabling the easy integration, visualization, and comparison of RNA-seq data across experiments.
MATERIALS AND METHODS
Data Preparation
Reads
We downloaded the wheat (Triticum aestivum) gene expression data from the SRA database at NCBI available on August 12, 2015. Study ERP004714 was incomplete and missing the required metadata in the SRA, so the data were downloaded directly from https://urgi.versailles.inra.fr/files/RNASeqWheat/. For consistency of analysis, we only included data sets generated using RNA-seq on the Illumina platform, both paired and single-end reads. We excluded small RNA studies and studies with fewer than 50 million total reads. The SRA studies included in this analysis are listed in Table II with a short description (full details are given in Supplemental Table S1).
Reference
The wheat transcriptome reference was downloaded from EnsemblPlants release 26 (Choulet et al., 2014; International Wheat Genome Sequencing Consortium, 2014).
Metadata
Experiment metadata were downloaded from the SRA and supplemented by manual curation from the associated publications. This manual curation was used to define the factors that were used for the classification of studies in the visualization interface. For the wheat expression browser, we defined factors as study, age, tissue, variety, and stress-disease treatment. These factors were grouped at a high level and also at the individual level to allow more meaningful comparisons (Supplemental Table S4). The homeologues of each gene were extracted from EnsemblCompara release 26 (Vilella et al., 2009) and added as metadata to the genes. Detailed documentation on how to load metadata into expVIP is available online (https://github.com/homonecloco/expvip-web/wiki).
Expression Analysis
We implemented an initial sample quality control using fastQC (version 0.10.1; Andrews, 2010), which reports the fastQC quality files for the user to assess. Wheat gene expression quantification was carried out using kallisto version 0.42.3 (Bray et al., 2015) and the wheat transcriptome described previously. For paired-end reads, kallisto was run using default parameters with 100 bootstraps (-b 100). For single-end reads, kallisto was run using 100 bootstraps (-b 100) in the single-end read mode (–single), and the average fragment length used was 150 bp (-l 150) with an sd of 50 (-s 50); these values were taken as an average of reported fragment lengths for the studies included. For comparison, a more traditional analysis (not included in expVIP) was carried out where reads were aligned to the IWGSC transcriptome version 2.26 using bowtie2 (version 2.2.4) using the parameters recommended by eXpress (Roberts and Pachter, 2013): output in sam format (-S), maximum insert size of 800 bp (-X 800), and unlimited multimappings (-a). Counts per gene and tpm were calculated using eXpress version 1.5.1 using the default parameters except that sequence-specific biases were ignored (-no-bias-correct) due to some samples having too few fragments to accurately learn bias parameters, so the bias correction was turned off for all samples to maintain a uniform treatment across samples.
Differential gene expression analysis was carried out on the kallisto output abundance files using sleuth (Pimentel et al., 2015). Default settings were used, except that the maximum bootstraps considered was 30 (max_bootstrap = 30). For the integrated disease and stress analysis, each sample was compared with the control sample from the study from which it originated. Genes with an FDR-adjusted P (q) < 0.05 were considered differentially expressed.
Visualization Interface
The outputs from kallisto were merged into two separate files: the raw estimated counts and tpm for all samples. Those files were loaded into an MySQL 5.5 relational database along with a Web server using the framework Ruby on Rails 4.2. expVIP is released as a Biogem (Bonnal et al., 2012). The visualization of the expression is implemented as a BioJS (Corpas et al., 2014) component, using the Web development frameworks D3v3, jQuery 2.1, and jQuery-UI 1.11.
Availability of expVIP
The source code to prepare and set up the expVIP database and graphical interface are available in Github: https://github.com/homonecloco/expvip-web. The BioJS component to visualize the expression data are available at the BioJS registry: http://biojs.io/d/bio-vis-expression-bar. The expVIP virtual machine, the data displayed in the Web interface, and the detailed documentation are available on the wiki page https://github.com/homonecloco/expvip-web/wiki.
qPCR Analysis of Reference Gene Stability
Tissue samples were collected in liquid nitrogen for a range of tissues, developmental stages, varieties, and disease conditions (Supplemental Table S7). All plants were grown in greenhouses in soil under 16-h-light/8-h-dark, 20°C day/12°C night conditions, except cv Maris Huntsman seedlings, which were grown on moist filter paper in petri dishes in the dark at 20°C. Frozen samples were ground to a fine powder, and RNA was extracted using TRI Reagent (Sigma) according to the manufacturer’s instructions, except for grain samples, which were extracted according to a phenol-based method (Box et al., 2011) with the addition of 20% (v/v) Plant RNA Isolation Aid (Ambion) to the RNA extraction buffer. RNA samples were diluted to 250 ng µL−1, treated with RQ1 DNase (Promega), and reverse transcribed using Moloney murine leukemia virus (Invitrogen) according to the manufacturer’s instructions. qPCR was carried out using LightCycler 480 SYBR Green I Master Mix (Roche) with each primer at a final concentration of 0.25 µm and 0.05 µL of cDNA in a 10-µL reaction using 384-well plates. The qPCR program run on the LightCycler 480 (Roche) was as follows: preincubation at 95°C for 5 min; 45 amplification cycles of 95°C for 10 s, 58°C for 10 s, and 72°C for 20 s with the final melt-curve step cooling to 60°C and then heating to 97°C with five reads per 1°C as the temperature increased. For all sample/primer combinations, melt curves were inspected to have only a single product. Crossing thresholds were calculated using the second derivative method provided in the LightCycler 480 SW 1.5 software (Roche). Primer efficiencies were calculated using a serial dilution of cDNA.
Analysis of GO Term Enrichment
GO term enrichment was calculated using Singular Enrichment Analysis provided by agriGO (Du et al., 2010) using default settings. The genes differentially expressed in 10, 11, and 12 abiotic and disease conditions were supplied as the query list, along with GO terms downloaded from EnsemblPlants biomart (release 26). The entire IWGSC version 2.26 transcriptome was used as the reference using GO terms downloaded from EnsemblPlants biomart.
Supplemental Data
The following supplemental materials are available.
Supplemental Figure S1. Comparison of the number of genes expressed per sample and the number of mapped reads.
Supplemental Figure S2. Demonstration of filtering within the expVIP interface.
Supplemental Table S1. Detailed wheat metadata per sample.
Supplemental Table S2. Ten most highly expressed genes in wheat grain and leaf tissues.
Supplemental Table S3. Comparison of the accuracy of kallisto and bowtie2 using nullitetrasomic wheat lines.
Supplemental Table S4. Structure of wheat RNA-seq metadata for www.wheat-expression.com.
Supplemental Table S5. Means, sd, and covariance of transcript expression across 321 wheat samples.
Supplemental Table S6. Stability of reference gene expression across 321 wheat samples.
Supplemental Table S7. Samples used to test the stability of expression of qPCR primers.
Supplemental Table S8. Comparison of coefficients of variation between five novel reference genes and five commonly used reference genes across 30 conditions.
Supplemental Table S9. GO term enrichment among genes expressed under stress and disease conditions.
Supplemental Table S10. Genes differentially expressed in 10 stress conditions, fold change, and function.
Supplemental Text S1. Tutorial for expVIP graphic interface (Wheat Expression Browser example).
Supplemental Text S2. Application of expVIP to rice allows the integration of previous studies.
ACKNOWLEDGMENTS
We thank Nikolai Adamski and Oluwaseyi Shorinola (John Innes Centre [JIC]) for discussions; Martha Clarke, Clare Lewis, Paul Nicholson, and Marianna Pasquariello (JIC) for RNA samples; members of the JIC Crop Genetics Department for beta testing of www.wheat-expression.com; Robert Davey (TGAC) for downloading RNA-seq data from NCBI; and Michael Burrell (NCBI Computing Infrastructure for Science group) for assistance in installing kallisto.
Glossary
- RNA-seq
transcriptome sequencing
- SRA
short read archive
- IWGSC
International Wheat Genome Sequencing Consortium
- tpm
transcripts per million
- SNP
single-nucleotide polymorphism
- qPCR
quantitative PCR
- cDNA
complementary DNA
- GO
Gene Ontology
- FDR
false discovery rate
- NCBI
National Center for Biotechnology Information
LITERATURE CITED
Author notes
This work was supported by the Biotechnology and Biological Sciences Research Council (grant nos. BB/J004588/1 and BB/J003557/1 to C.U. and Anniversary Future Leader fellowship no. BB/M014045/1 to P.B.) and by a Norwich Research Park Ph.D. studentship and a Genome Analysis Centre funding and maintenance grant to R.R.-G.
These authors contributed equally to the article.
Address correspondence to [email protected].
The author responsible for distribution of materials integral to the findings presented in this article in accordance with the policy described in the Instructions for Authors (www.plantphysiol.org) is: Cristobal Uauy ([email protected]).
P.B. catalogued data for inclusion, performed wet-lab experiments, and carried out the RNA-seq alignments and differential expression analysis; R.R.-G. developed the expVIP source code, the virtual machine, and the wheat expression browser Web site; all authors contributed to the conception of the project and writing the article.
Articles can be viewed without a subscription.
