


Abstract
MYB transcription factors play important roles during abiotic stress responses in plants. However, little is known about the accurate systematic analysis of MYB genes in the four cotton species, Gossypium hirsutum, G. barbadense, G. arboreum and G. raimondii. Herein, we performed phylogenetic analysis and showed that cotton MYBs and Arabidopsis MYBs were clustered in the same subfamilies for each species. The identified cotton MYBs were distributed unevenly on chromosomes in various densities for each species, wherein genome-wide tandem and segment duplications were the main driving force of MYB family expansion. Synteny analysis suggested that the abundant collinearity pairs of MYBs were identified between G. hirsutum and the other three species, and that they might have undergone strong purification selection. Characteristics of conserved motifs, along with their consensus sequence, promoter cis elements and gene structure, revealed that MYB proteins might be highly conserved in the same subgroups for each species. Subsequent analysis of differentially expressed genes and expression patterns indicated that most GhMYBs might be involved in response to drought (especially) and salt stress, which was supported by the expression levels of nine GhMYBs using real-time quantitative PCR. Finally, we performed a workflow that combined virus-induced gene silencing and the heterologous transformation of Arabidopsis, which confirmed the positive roles of GhMYBs under drought conditions, as validated by determining the drought-tolerant phenotypes, damage index and/or water loss rate. Collectively, our findings not only expand our understanding of the relationships between evolution and function of MYB genes, but they also provide candidate genes for cotton breeding.
Introduction
Cotton has a very high economic value; not only does it acts as the raw material for numerous fabrics, but its seeds can also be used to extract oil (Yang et al. 2023). Furthermore, cotton fibers are trichomes that develop from the seeds of cotton plants (Lu et al. 2022). Among the cultivated varieties, the production of Gossypium hirsutum (upland cotton, a representative species) accounts for more than 95% in the world due to its high yield and excellent fiber quality (Zafar et al. 2022a, Yang et al. 2023). Nevertheless, cotton production still faces many problems, such as drought and salt stress (Abdelraheem et al. 2019, Meshram et al. 2022). Therefore, the research on the tolerance and breeding is a hot topic in the field of cotton cultivation.
Higher plants have evolved a series of complex signal networks that respond to the inhospitable environment. Transcription factors (TFs) are indispensable regulators that regulategene expression and play essential roles in plant development and response to abiotic stimuli (Meshi and Iwabuchi 1995, Martin and Paz-Ares 1997, Gong et al. 2020). Collectively, they represent the research hotspot in genetic engineering to improve plant tolerance to different environmental stimuli. At present, multiple TFs, including WRKY, MYB, NAC, DREB and AP2/ERF, have been found in plants (Olsen et al. 2005, Agarwal et al. 2006, Li et al. 2015, Jiang et al. 2017, Feng et al. 2020), and new TFs are continuing to be discovered (Strader et al. 2022). MYB is one of the largest TF families in plants, and all its members have a highly conserved MYB domain (Dubos et al. 2010). In 1987, the first identified MYB was ZmMYBC1 gene in maize (Paz-Ares et al. 1987). Over the past decade, the abundant MYB genes have been identified in many plants via genomics, transcriptomics and proteomics (Sabir et al. 2022, Wang et al. 2022, Lin et al. 2023). According to the number of protein repeating domains, MYB proteins are generally divided into four categories, including 1R-MYB, R2R3-MYB, 3R-MYB and 4R-MYB (Dubos et al. 2010), where the R2R3-MYB family represents the vast majority in plants.
Due to the fact that stress conditions are inevitable in developmental processes of plants, they need to be countered by an effective defense mechanism, wherein MYB TFs related to plant tolerance to abiotic stresses have been widely reported. For example, GaMYB85 could promote the accumulation of free proline and chlorophyll, thereby enhancing the drought tolerance of cotton (Butt et al. 2017). PtrMYB94 acted as a critical gene in the regulation of drought tolerance in Populus trichocarpa (Fang et al. 2020). Lim et al. (2022) demonstrated that CaDIM1 could function as a positive regulator of drought response by modulating ABA-mediated gene expression. The expression of CsMYB genes in Cymbidium sinense was upregulated upon drought stress (Zhu et al. 2023). PtrMYB3 and FtMYB13 were reported to function as the key gene in salt response (Huang et al. 2018, Wei et al. 2021). AtMYB30 inhibited the expression of ANN1 and ANN4, followed by modulating heat responses (Liao et al. 2017). MdMYB308L could interact with MdbHLH33 to enhance cold tolerance in apple (An et al. 2019). The overexpression of RsMYB1 conferred the transgenic petunia tolerance against heavy metal stress (Ai et al. 2018). Collectively, MYB genes play critical roles in abiotic stress response in plants, which is of great significance in cotton breeding to perform the genome-wide analysis and function verification of MYB genes. The roles of MYB in other biological processes were also explored in plants. For instance, AtMYB112 is a negative regulator for photomorphogenesis in Arabidopsis thaliana (Cai et al. 2023). AtMYB59 plays an essential role in cell cycle regulation and root growth (Mu et al. 2009). MdMYB39L is involved in regulating apple stamen development and pollen tube growth (Meng et al. 2018). In addition, TCP3 protein could interact with MYB proteins to promote flavonoid accumulation in A. thaliana (Li and Zachgo 2013). Further, MYB genes have been shown to participate in the biosynthesis regulation of secondary cell wall components (Huang et al. 2019).
Thus far, the genome-wide analyses of cotton MYB have been conducted in some biological processes or several species. A brief genome-wide characterization and expression analysis of fiber development–associated GhMYBs have been carried out (Salih et al. 2016), while a genome-wide analysis of secondary wall–associated R2R3-MYBs has been reported in G. hirsutum (Gh) (Huang et al. 2019). A genome-wide analysis of the R2R3-MYB family was also performed among the four Gossypium species using partly old genomic data (Wang et al. 2019), and the genome-wide identification of R2R3-MYBs in G. raimondii (Gr) has been conducted during abiotic stress (He et al. 2016). Nonetheless, the accurate and systematic analyses of all MYB genes simultaneously in Gh, G. barbadense (Gb), G. arboreum (Ga) and Gr are not yet reported, the and functional validation of GhMYBs under abiotic stress is still incompletely known. Additionally, the Gh genome was accurately reassembled (Yang et al. 2019), which has offered us a great opportunity for further investigation.
Herein, we performed a genome-wide analysis of the MYB gene family in four cottons, focussing on phylogeny, chromosome localization, synteny, gene structure, conserved motif and promoter cis-acting elements. Next, we focused on GhMYBs and uncovered their roles in drought (in particular) and salinity response. The expression profiles of GhMYBs were shown, and the functional validation of selected GhMYBs was carried out under drought and salt stress by real-time quantitative PCR (RT-qPCR). Finally, virus-induced gene silencing (VIGS) technology and heterologous transformation were employed to further verify whether GhMYBs are involved in the response of cotton to drought stress. Our findings will not only provide new insight into thecotton MYB gene families but also, in large part, a theoretical reference for cotton breeding.
Results
Identification and characterization of MYB genes in cotton
To perform the genome-wide identification of MYBs, genomic data of Gh, Gb, Ga and Gr were downloaded from the Cotton Functional Genomics Database to further obtain potential MYB protein sequences. Herein, all members of the MYB gene family of four species were identified, in which 478, 472, 242 and 251 genes were identified in Gh, Gb, Ga and Gr, respectively (Table 1). To better understand their evolutionary relationship, the four phylogenetic trees were constructed based on the amino acid sequences of MYB proteins from cotton and Arabidopsis (130 AtMYB proteins). The phylogenetic tree of GhMYB and AtMYB proteins (Fig. 1) showed that all MYB proteins were classified into 13 subgroups with various numbers of genes in each. Similarly, all MYB proteins of Gb (Supplementary Fig. S1), Ga (Supplementary Fig. S2) and Gr (Supplementary Fig. S3) were divided into 15, 17 and 16 subgroups.
Number of MYB genes in four cotton species
| Gossypium spp. | 1R-MYB | R2R3-MYBs | 3R-MYB | 4R-MYB | Total |
|---|---|---|---|---|---|
| Gh | 100 | 365 | 12 | 1 | 478 |
| Gb | 109 | 348 | 14 | 1 | 472 |
| Ga | 52 | 183 | 6 | 1 | 242 |
| Gr | 51 | 193 | 7 | 0 | 251 |
| Gossypium spp. | 1R-MYB | R2R3-MYBs | 3R-MYB | 4R-MYB | Total |
|---|---|---|---|---|---|
| Gh | 100 | 365 | 12 | 1 | 478 |
| Gb | 109 | 348 | 14 | 1 | 472 |
| Ga | 52 | 183 | 6 | 1 | 242 |
| Gr | 51 | 193 | 7 | 0 | 251 |
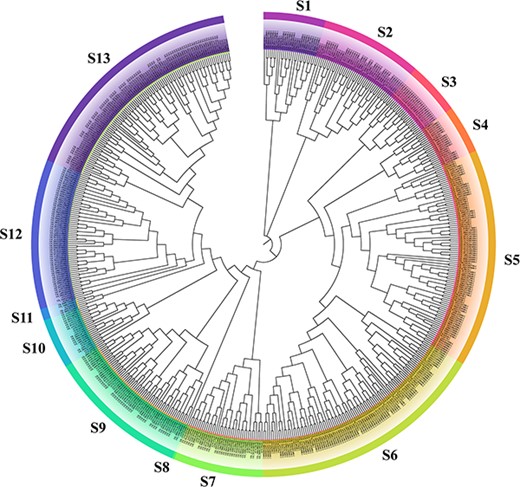
Phylogenetic tree of 478 GhMYB proteins of Gh and 130 AtMYB proteins of A. thaliana. The full-length sequences of MYB proteins were subjected to ClustalW to perform the multiple sequence alignment. Based on the amino acid sequences of MYB proteins, the circular phylogenetic tree was constructed using MEGA 7.0 by the neighbor joining method with 1,000 bootstrap replicates. Thirteen main clades were marked S1–S13.
Chromosomal distribution of MYBs and schematic representation of the duplicated gene
To analyse the physical distributions of MYBs on chromosomes, the locations were mapped by genome annotation files of four species. A total of 478 GhMYBs were unevenly distributed on 26 chromosomes, with 10, 6, 15, 9, 29, 11, 26, 25, 22, 9, 32, 23 and 25 distributed on At01–13 chromosomes, while 11, 10, 12, 12, 23, 11, 25, 23, 21, 9, 32, 23 and 24 distributed on Dt01–13 chromosomes (Fig. 2A). A total of 472 GbMYBs were unevenly distributed on 26 chromosomes (Supplementary Fig. S4A). Like the GhMYBs, the distribution of GbMYBs between At01-13 and Dt01-13 chromosomes presented a similar trend in either number or regularity. A total of 242 GaMYBs and 251 GrMYBs were unevenly distributed on their 13 chromosomes (Chr 01–13, Supplementary Figs. S5A and S6A). In general, all GhMYBs, GbMYBs and GaMYBs were mostly distributed on chromosomes 5, 7, 8, 9, 11, 12 and 13, but less distributed on 2 and 10. By contrast, the majority of GrMYBs were distributed on chromosomes 1, 4, 6, 7, 8, 9 and 13 and less distributed on 2, 3, 5 and 11.
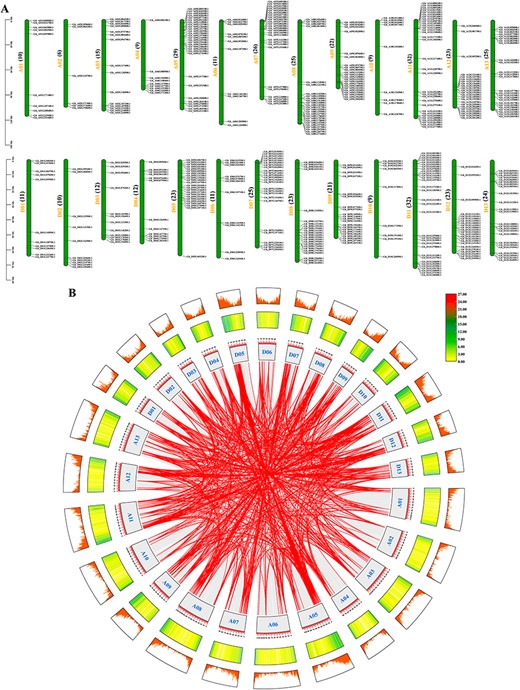
Chromosomal localization of GhMYBs and gene duplication events. (A) Chromosomal position of GhMYBs was mapped. GhMYBs are shown on the right of each chromosome. Chromosome number is indicated to the left of each chromosome, and its right side indicates the number of GhMYBs. Gene positions of each chromosome are estimated by the scale (megabases, Mb) on the left in figure. (B) The circular image displays inter-chromosome regions connected by bands. The different lines indicate GhMYB gene pairs with a syntenic relationship or the collinear pairs of all genes in Gh genome. Chromosome numbers were indicated inside of the box. The heat map represents the gene density on chromosomes. The scale above the box is in Mb.
The analysis of intraspecific collinearity was carried out using Multiple Collinearity Scan (MCScanX) based on the genome files. The 11,734, 12,437 and 50,164 pairs of collinearity genes were found in At, Dt and between At and Dt, respectively, wherein there were 801 pairs of collinearity GhMYBs (Fig. 2B). Similarly, 12,032, 12,982 and 51,187 pairs of collinearity genes were identified in At, Dt and between At and Dt, respectively, in which the collinear GbMYBs have 832 pairs (Supplementary Fig. S4B). Additionally, there were a total of 12,466 and 14,748 pairs of collinear genes in Ga and Gr genomes, respectively, wherein the collinear GaMYBs and GrMYBs have 147 and 185 pairs (Supplementary Figs. S5B and S6B). Gene duplication plays an important role in the process of evolution, and thus, gene duplication events of MYBs were analyzed. A total of 441 whole-genome or segmental duplications and 16 tandem duplications were identified in GhMYBs (Fig. 2B). The total of 421, 175 and 175 whole-genome or segmental duplications were found in GbMYBs, GaMYBs and GrMYBs, and 19, 12 and 10 tandem duplications were also observed (Supplementary Figs. S4B, S5B and S6B). Therefore, it could be inferred that whole-genome or segmental duplications are the main reasons for the expansion of the cotton MYB gene family.
The synteny among four cotton species and Ka/Ks analysis
To better demonstrate the evolutionary relationship of MYBs, the genome files of Gh, Gb, Ga and Gr were subjected separately to MCScanX to obtain the interspecific collinearity. The 1,825 pairs were identified between GhMYB and GbMYB (Fig. 3A). The collinear genes between GhMYB and GaMYB have 967 pairs (Fig. 3B). There were 1,058 pairs between GhMYB and GrMYB (Fig. 3C). As such, our results suggested that GhMYBs shared a better homology than those from the other three species.
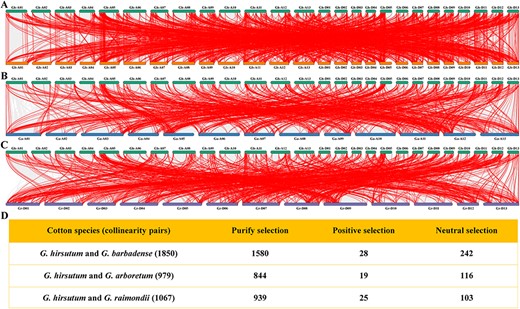
The collinear map of genome and the analysis of selection pressure for collinear gene pairs. The collinearity between GhMYB and GbMYB (A), GaMYB (B) or GrMYB (C) is presented. The lines denote collinearity between GhMYBs and MYB genes of other cotton species. (D) The selection pressure for collinear MYB gene pairs were evaluated by calculating Ka/Ks ratios. Purifying selection, Ka/Ks < 1; positive selection, Ka/Ks > 1; neutral selection, Ka/Ks = 1.
The signals of selection pressure among four species were measured using the ratios of non-synonymous substitution (Ka) and synonymous substitution (Ks) (Fig. 3D). For the collinear genes between GhMYB and GbMYB, 1,523 and 28 pairs underwent purification (mean Ka/Ks < 1) and positive selection (mean Ka/Ks > 1, Supplementary Table S1), respectively. Among the collinear genes between GhMYB and GaMYB, 833 and 19 pairs were subject, respectively, to purification and positive selection (Supplementary Table S2). In the collinear genes between GhMYB and GrMYB, 930 and 25 pairs underwent purification and positive selection (Supplementary Table S3), respectively. Furthermore, the molecular functions of positively selected genes (PSGs) were predicted by Gene Ontology (GO) enrichment (Supplementary Fig. S7). The majority of PSGs in four cottons were significantly enriched for the common molecular functions related to DNA binding, nucleic acid binding, TF binding, etc., inferring that the adaptive evolution related to gene expression and transcriptional regulation existed in the evolution of MYB gene family. Our results suggested that in the evolution of cotton MYB gene families, purification selection could be viewed as a main driving force, and the majority of PSGs might undergo adaptive evolution.
Phylogenetic tree, conservative motif, promoter cis element and gene structure
To further obtain detailed information on MYBs, the phylogeny, motifs, cis elements and gene structures were analyzed, and these results were combined and plotted using TBtools. First, phylogenetic trees were constructed (Fig. 4A; Supplementary Figs. S8A, S9A and S10A) using the MYB protein sequences of the four species. Next, the main conservative motifs of GhMYBs (Fig. 4B) and the amino acid sequence of motifs (Fig. 5) were shown, respectively, in which most GhMYBs contained one or more motifs 1, 2, 3, 4 and 6. We noted that the distributed range was broad, with 410, 403, 468, 399 and 421 of 478 GhMYB sequences containingmotifs 1, 2, 3, 4 and 6, respectively, suggesting that these motifs might be the main domain components. Additionally, the conservative motifs (Supplementary Figs. S8B, S9B and S10B) and their amino acid sequences (Supplementary Fig. S11) were also shown for GbMYB, GaMYB and GrMYB. Most MYBs in Gb and Gr contained one or more motifs 1–4, suggesting that they might be the main part of their domain. As such, motifs 1–5 might be the main part of the GaMYB domain. The prediction of conserved motifs indicated that the composition of MYB proteins was similar among four species.
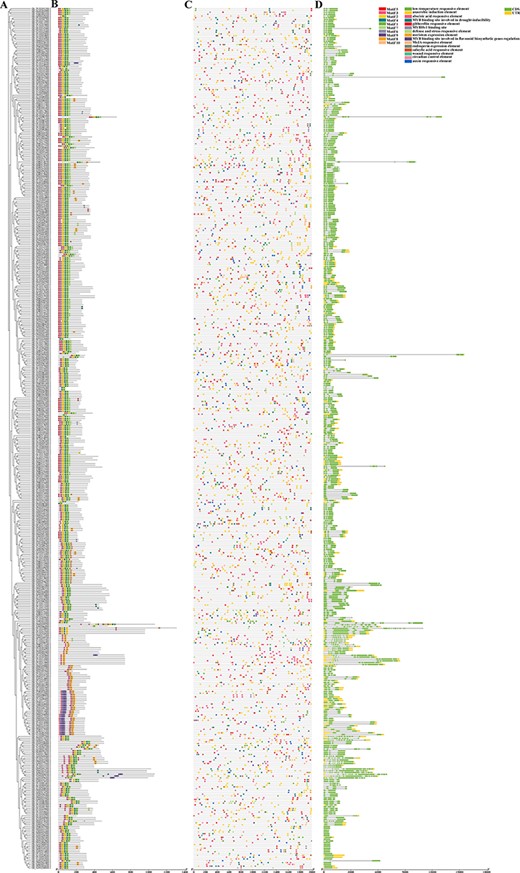
Phylogenetic relationships, conservative motifs, promoter cis elements and gene structure. (A) A phylogenetic tree of the GhMYB gene family was constructed with MEGA 7.0. (B) The conserved motifs of GhMYB proteins were elucidated using MEME webpage and visualized in TBtools. (C) The promoter cis elements of GhMYBs were predicted, and the blocks represent different cis elements. (D) Gene structures of GhMYBs are represented. The boxes represent untranslated regions or coding regions, and the lines indicate introns.
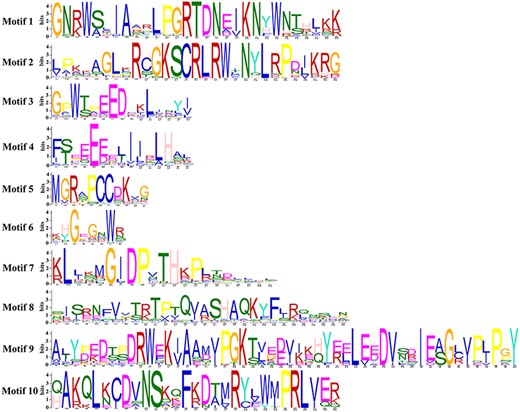
Conservative motif information of GhMYB proteins. The sequence logos of MYB repeats were based on full-length sequence alignments of all GhMYB proteins. The bit score indicated the information content for each position in the sequence. The overall height of each stack shows the conservation of the MYB protein sequence. Letters indicate the different types of amino acid residues.
Furthermore, the promoter cis elements were analyzed to predict the potential function of MYBs. A total of 5,064 cis elements with 15 different functions were identified in all GhMYBs (Fig. 4C), and some of them were related to the growth and development, hormone response and stress (such as salt and drought) response. A total of 4,722, 2,475 and 2,710 cis elements in GbMYB, GaMYB and GrMYB were found, respectively (Supplementary Figs. S8C, S9C and S10C), and all were classified into 15 groups with different functions in each species. Like the GhMYB, the cis elements related to the growth and development, hormone response and stress response were also observed in GbMYB, GaMYB and GrMYB. Together, the promoter of MYBs contained the abundant stress response–related ciselements, and thus, they played the indispensable roles in stress response.
Finally, the gene structure information suggested that all GhMYB, GbMYB, GaMYB and GrMYB contained the different numbers of coding sequences (CDS) and/or UTRs (Fig. 4D; Supplementary Figs. S8D, S9D and S10D). Both GhMYB and GaMYB had different numbers of CDS (ranging from 1 to 14), and the number of UTRs contained in GhMYB ranged from 0 to 4, while all GaMYBs had no UTR. The number of CDS present in both GbMYB and GrMYB ranged from 1 to 13. The number of UTRs ranged from 0 to 4 (GbMYB) and 0 to 5 (GrMYB). These results indicated that in each species, their gene structures were generally similar among the same subfamily, especially some close members.
Expression profiling and validation of GhMYB genes
Herein, GhMYBs were further selected to investigate the expression patterns of MYB following drought and salt stress. Based on transcriptomic data of GhMYB following drought treatment, the expression pattern of differentially expressed genes at different time points was presented in a heatmap (Fig. 6A) where the transcriptional levels of most GhMYBs were increased at 6 or 12 h. Subsequently, the expression patterns of 478 GhMYBs, at 0, 1, 3, 6, 12 and 24 h after drought stress, were sorted into nine clusters by K-means clustering, wherein a trend analysis was also performed (Fig. 6B). Similarly, the expression pattern of 478 GhMYBs after salt stress at different time points was presented in a heatmap (Supplementary Fig. S12A), which clustered into nine expression patterns (Supplementary Fig. S12B).
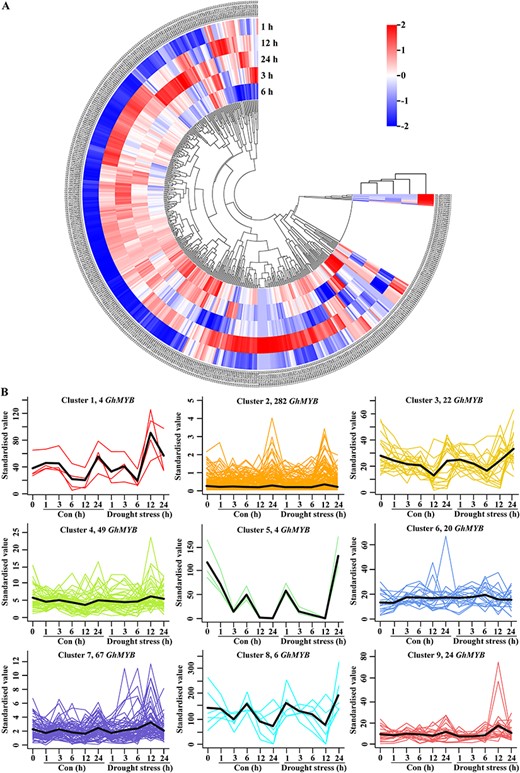
Analysis of GhMYB gene expression under drought stress. (A) Heatmap of differentially expressed genes between control (Con) and drought stress. For the scale, negative and positive values represent low and high expression levels, respectively. (B) The FPKM values of 478 GhMYB gene expression were subjected to the K-means cluster, and nine clusters were shown upon Con and drought stress. In each cluster, the lines indicate the expressed profiles of expression types, and the thickest lines indicate the mean of all expression types. The gene number in each cluster is displayed in the upper of each panel.
To verify the aforementioned results, the expression of nine of the 478 GhMYBs was detected in leaves under PEG treatment (mimicking drought stress). In our experiments, compared with controls, the expressions of nine GhMYBs were differentially induced at 1, 3, 6, 12 or 24 h, as shown by RT-qPCR analysis performed on 14-day-old seedlings irrigated with PEG solution (Fig. 7). The expression levels of nine GhMYBs displayed a trend in which an increase appeared with PEG treatment, followed by a decrease. The transcriptional levels of Gh_A12G154900.1, Gh_D01G168900.1, Gh_A08G266700.1, Gh_D08G040100.1, Gh_A01G171400.1, Gh_A03G14-6000.1, Gh_D03G146200.1, Gh_A13G077900.1 and Gh_D11G052400.1 reached the peak at 1, 3, 12, 6, 6, 1, 6, 1 and 1 h, respectively. Apparently, these players are involved in response to osmotic stress. Similar behaviors were found in changes in GhMYB expression following salt stress (Supplementary Fig. S13).
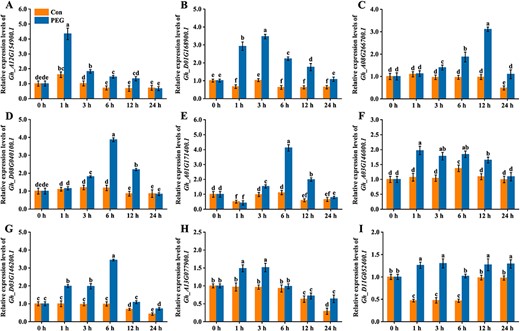
The time-course changes in the expression of GhMYBs upon osmotic stress. Two-week-old cotton plants were subjected to 20% PEG 6000 for 0, 1, 3, 6, 12 and 24 h. The expression levels of GhMYBs from leaves were determined by RT-qPCR. The expression levels are presented as values relative to the control (Con) sample at 0 h. Cotton plants without PEG treatment were used as the Con.
Silencing of GhMYBs and drought tolerance of GhMYB-silenced cotton plants
Next, Gh_D01G168900.1, Gh_D03G146200.1 and Gh_D-11G052400.1 were silenced using VIGS technology to determine their function in response to drought stress. Prior to the stress test, the expressions of Gh_D01G168900.1, Gh_D03G146200.1 and Gh_D11G052400.1 in three GhMYB-silenced lines were checked separately by RT-qPCR. As expected, compared to pYL156-00 plants (control), their expressions were clearly blocked in the corresponding GhMYB-silenced lines (Fig. 8B), implying that the three genes were effectively silenced in loss-of-function cotton.
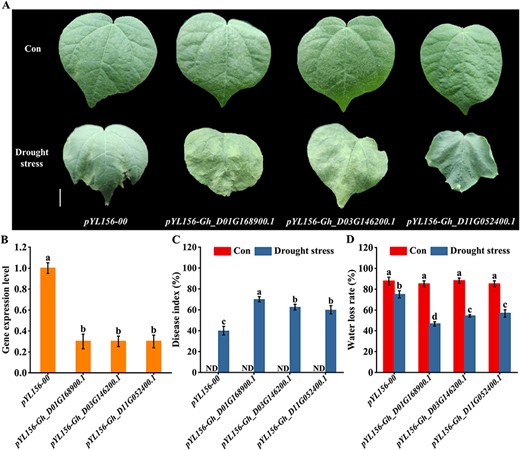
Analysis of silencing efficiency, damage index and water loss rate. (A) Three-week-old plants were subjected to water-deficit treatment for another 14 d, and then the representative phenotypes were photographed. The scale bar is 1 cm. (B) The silenced efficiency was detected at the four-leaf stage (21 d) by analyzing the gene expression levels. The gene expression is presented as values relative to the sample of pYL156-00 plants. (C and D) Three-week-old plants were subjected to water-deficit treatment for another 14 d, and then damage index and water loss rate were calculated. ND represents no data. Control groups were irrigated with Hoagland’s solution.
Thereafter, pYL156-00 plants and three GhMYB-silenced lines were subjected to water-deficit treatment. Dehydration along with leaf withering was clearly visible during drought stress, and these symptoms were more severe in the three GhMYB-silenced lines, compared to pYL156-00 plants (Fig. 8A). Growth between the three GhMYB-silenced lines did not vary strongly. Additionally, compared to pYL156-00 plants, the three GhMYB-silenced lines showed a higher damage index (Fig. 8C), but lower water loss rate (Fig. 8D). These findings strongly confirmed that GhMYBs play vital roles in response to drought stress.
Identification of GhMYB-expressing Arabidopsis and drought-tolerant test
Finally, Gh_D01G168900.1, Gh_D03G146200.1 and Gh_D11G05- 2400.1 were expressed in wild-type Arabidopsis to further investigate their roles during drought response. For each gene, five homozygotes of transgenic lines (OE1–5) were generated, and their expression levels were detected, respectively, in each line by RT-qPCR (Fig. 9A–C). Afterward, OE3, 4 and 5 lines of Gh_D01G168900.1 (Fig. 9D), OE1, 4 and 5 of Gh_D03G146200.1 (Fig. 9E) and OE1, 3 and 5 of Gh_D11G052400.1 (Fig. 9F) were challenged with water-deficit treatment. The drought-tolerant phenotypes, as expected, were most pronounced in transgenic Arabidopsis compared to wild-type. Growth between GhMYB-transgenic lines did not vary strongly.
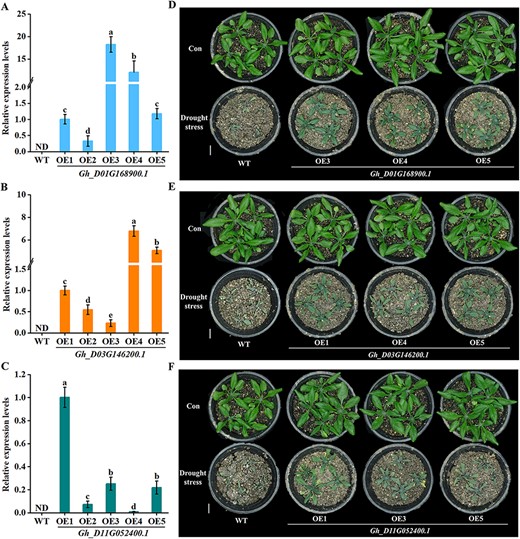
Identification of GhMYB-transgenic Arabidopsis and its drought-tolerant test. (A–C) The expression levels of Gh_D01G168900.1, Gh_D03G146200.1 and Gh_D11G052400.1 from the leaves of 1-month-old plants were determined by RT-qPCR. Within each set of experiments, the expression levels were presented as values relative to the control (Con) sample of OE1. (D–F) One-week-old seedlings were subjected to water-deficit treatment for another 18 d, and then the representative phenotypes were photographed. The scale bar is 5 cm. Plants without water-deficit treatment were used as Con.
To further validate the these results, the water loss rate, malondialdehyde (MDA) content and proline levels were checked. The water loss rate (Fig. 10A) and proline levels (Fig. 10C) of Gh_D01G168900.1-expressed lines were significantly higher than those of wild type (WT), but MDA content was significantly lower than that of WT (Fig. 10B). The same results were observed in transgenic lines of both Gh_D03G146200.1 (Fig. 10D–F) and Gh_D11G052400.1 (Fig. 10G–I). These findings strongly suggested that GhMYBs confer drought stress tolerance in transgenic Arabidopsis.
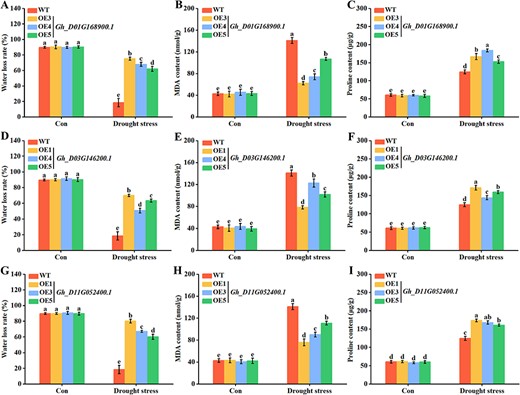
Determination of water loss rate, MDA content and proline levels in GhMYB-transgenic Arabidopsis. One-week-old GhMYB-transgenic lines were subjected to water-deficit treatment for another 18 d. The water loss rate (A, D and G), MDA content (B, E and H) and proline levels (C, F and I) were detected. Plants without water-deficit treatment were used as control (Con).
Discussion
It is generally accepted that MYB TFs play indispensable roles in plants, especially those found in highly dynamic and often inhospitable environments (Li et al. 2015). Although genome-wide analyses of cotton MYB related to specific biological processes have been conducted in several species (He et al. 2016, Salih et al. 2016, Huang et al. 2019, Wang et al. 2019), the accurate and systematic analyses of all MYB genes collectively in Gh, Gb, Ga and Gr had not yet been reported. Herein, the genome-wide analysis of all MYB genes in four cotton species was performed by optimizing bioinformatic methods. GhMYBs that were sensitive to stress were screened, in which the functional verification of three GhMYBs was carried out under drought stress.
We identified 478, 472, 242 and 251 MYB genes in Gh, Gb, Ga and Gr genomes, respectively (Table 1), which could be divided into 13, 15, 17 and 16 clusters (Fig. 1; Supplementary Figs. S1–S3). Regarding the different number of subgroups, we speculate that during Gossypium evolution, MYB genes underwent gene duplication or loss. Alternatively, these genes might have been lost in A. thaliana or acquired in Gossypium during the divergence from the last common ancestor. According to our analysis, most cotton MYBs were clustered with AtMYBs in different subfamilies (Fig. 1; Supplementary Figs. S1–S3). We found also that the R2R3-MYB family was the largest subfamily (Table 1) and the same was observed in Arabidopsis, rice, maize and soybean (Stracke et al. 2001, Chen et al. 2006, Du et al. 2012a, 2012b). Some studies have reported that the genome had undergone gene duplication events and chromosomal rearrangements during the evolution process (Li et al. 2016, Cheng et al. 2021, Hu et al. 2021, Zafar et al. 2022b, Su et al. 2023), which contributed to the amplification of many gene families and the establishment of new functions. Thus, the physical maps of MYBs on chromosomes were constructed in the four cotton species (Fig. 2A; Supplementary Figs. S4A, S5A and S6A), and the intraspecific syntenic relationships of MYBs were analyzed (Fig. 2B; Supplementary Figs. S4B, S5B and S6B). This analysis confirmed that whole-genome or segmental duplications and tandem duplications were found in the genome of four species, suggesting that the expansion of the MYB gene family was, in large part, due to duplication events. Likewise, the duplication events of DREB and ERF gene families occurred during the evolution of cotton (Zafar et al. 2022b, Su et al. 2023). Genome-wide segmental and tandem duplications of SlMYB and ZmWRKY were also found in Solanum lycopersicum and Zea mays (Li et al. 2016, Hu et al. 2021), which might have contributed to the expansion of these gene families. Next, abundant pairs of collinear genes were found between GhMYBs and MYBs of the other three species (Fig. 3A–C), suggesting that the genetic relationships of the GhMYB gene family were closed with those from the other three species. The selection pressure experienced in the process of gene evolution was reflected by the Ka/Ks ratios (Cheng et al. 2021, Li et al. 2021, Lin et al. 2023). Based on our findings (Fig. 3D, Supplementary Tables S1–S3), it is tempting to infer that in the evolution of the MYB gene family, although purification selection accounted the most, positive selection was also an indispensable force. GO enrichment assessment of molecular function for PSGs revealed the significant enrichment of common terms related to DNA binding, nucleic acid binding, TF binding, etc. (Supplementary Fig. S7). Collectively, new cotton genes that performed different functions might arise from the duplication events, and a series of Ka and/or Ks in genomic sequence were the driving force behind this process.
Subsequently, we sought to identify the conserved motifs, promoter cis elements and gene structures to obtain detailed information on cotton MYBs. The conserved motifs (Fig. 4B; Supplementary Figs. S8B, S9B and S10B) and the composition of amino acids (Fig. 5, Supplementary Fig. S11) in MYB proteins were very similar in the four species examined, suggesting partially that MYBs of each clade showed a certain degree of functional conservation during their evolution. Similar behaviors were found in the evolution of MYB from Arabidopsis thaliana, Glycine max, Prunus avium and Cymbidium sinense (Chen et al. 2006, Du et al. 2012b, Sabir et al. 2022, Zhu et al. 2023). Furthermore, the promoter of MYB genes contained many stress response–related cis elements (Fig. 4C; Supplementary Figs. S8C, S9C and S10C), and thus, MYB genes might play important roles in stress responses. As per previous reports (Abe et al. 1997, Liao et al. 2017, An et al. 2019, Wang et al. 2021), MYB protein specifically bound to the promoter of the related target genes activated or inhibited the transcriptional expression of genes, leading to regulation of stress tolerance in plants. Additionally, gene structure analyses showed that in the four species, most MYBs exhibited a certain differentiation within each species (Fig. 4D; Supplementary Figs. S8D, S9D and S10D). However, since no functions have been reported for most MYBs, it is unclear whether these differences resulted in a pronounced divergence in biological role.
Gossypium hirsutum is an important fiber crop worldwide with long seed fibers and high oil content, and is the main target of cotton breeding (Yang et al. 2023). Based on these characterization studies, further analyses were restricted to GhMYBs showing their positive effects in response to drought (especially) and salt stress. First, the expression profiling confirmed that the expression of GhMYBs was differentially upregulated, either under drought stress (Fig. 6) or salinity (Supplementary Fig. S12). Several studies has also confirmed that under drought, cold or salt stress, the expression of MYBs was upregulated in Gb, Malus domestica, Populus trichocarpa and Poncirus trifoliata (Chen et al. 2015, An et al. 2019, Fang et al. 2020, Wei et al. 2021). The expression levels of selected GhMYBs following osmotic and salt stress (Fig. 7, Supplementary Fig. S13) indicated further that GhMYBs were involved in response to drought and salt stress. Accordingly, we validated three players, including Gh_D01G168900.1, Gh_D03G146200.1 and Gh_D11G052400.1, that could explain not only the inferior drought tolerance in GhMYB-silenced cotton (Fig. 8) but also the superior drought tolerance in GhMYB-transgenic Arabidopsis (Fig. 9), as reflected in water loss rate, MDA content and/or proline levels (Fig. 8D, Fig. 10). Based on the comparative analysis, they were new previously uncharacterised genes, and several Arabidopsis genes that were homologous to the three players, in the same branch of phylogenetic tree, were associated with drought response. Here, our findings suggested that GhMYBs might be partially responsible for evoking drought tolerance of plants and largely validated the results in Figs. 6 and 7. This could also explain why the promoter sequence of GhMYBs contained ample cis elements related to stress response (Fig. 4C). Of note, our findings were reconciled with the role of MYB as a positive regulator in response to drought stress in plants (Butt et al. 2017, Fang et al. 2020, Lim et al. 2022, Zhu et al. 2023). Thus, our work has uncovered a signaling network related to MYB-induced tolerance following abiotic stress, which will be interesting and challenging for future research.
Furthermore, the comparative analyses of phylogeny, chromosome localization, synteny, motif, cis-acting element and gene structure will provide new insights into the comprehensive evolutionary relationship and functional characterization of the cotton MYB gene family. The contribution of MYBs in abiotic stress has been previously confirmed in other plants (Liao et al. 2017, Ai et al. 2018, Huang et al. 2018, An et al. 2019, Fang et al. 2020, Wei et al. 2021, Lim et al. 2022, Zhu et al. 2023); our work further confirmed that they play a major role in responding to drought stress, in cotton and Arabidopsis (summarised in Supplementary Table S4). Collectively, these reports suggested the potential function of the cotton MYB family as an inducer or a mediator in the signaling cascade. It would be interesting to investigate the regulatory mechanism of vital MYBs in follow-up research to provide a theoretical basis for their application in the breeding and improvement of cotton varieties.
Materials and Methods
Sequence retrieval and identification of cotton MYB TFs
To identify all members of the MYB gene family, the genomic data of four species: Gh (AD1, CRI assembly), Gb (AD2, HAU assembly), Ga (A2, CRI assembly) and Gr (D5, JGI assembly), were retrieved from the Cotton Functional Genomics Database (https://cottonfgd.org/) (Su et al. 2023). The Hidden Markov Model profiles of the MYB domain (accession number: PF00249, Huang et al. Huang et al. 2019) were obtained from Pfam database (http://Pfam.sanger.ac.uk/) to screen potential MYB protein sequences. The conservative domains of amino acid sequences were manually screened by NCBI Conserved Domain Database Search and SMART tools, and the low-quality protein sequences were removed. The sequences of MYB TFs from A. thaliana were obtained from the Arabidopsis Information Resource (https://www.arabidopsis.org/).
Multiple sequence alignment and phylogenetic tree construction
The full-length amino acid sequences of MYB proteins from Gh, Gb, Ga and Gr were aligned, with AtMYB using ClustalW (Thompson et al. 2002) with default parameters. Based on the aforementioned alignments, the phylogenetic trees were constructed individually using Molecular Evolutionary Genetics Analysis software (version 7.0; 4 Kumar et al. 2016) with the neighbor joining method, and these trees were visualized using the online Interactive Tree of Life tools (https://itol.embl.de/) (Huang et al. 2019). The reliability of phylogenetic trees was calculated by bootstrap analysis, with the bootstrap value set to 1,000.
Chromosomal distribution, gene duplication, syntenic analysis and calculation of selection pressure
According to their initial position given in the genome, the chromosomal distribution and the relative distances of MYB genes on the chromosomes or scaffolds were displayed using TBtools (https://github.com/CJ-Chen/TBtools) (Chen et al. 2020). The reference genomes of cotton were obtained from CottonFGD.
As previously described (Su et al. 2023), the MCScanX toolkit of TBtools software (the parameters were set as follows: for BlastP: 6, E-value: 1 × 10⁻¹⁰ and number of BlastHits: 5) was employed to identify the duplication events in each species, and the results of duplication genes were visualized and drawn using the Circos package of TBtools (Krzywinski et al. 2009).
Based on the complete genome sequences along with genome annotation files, the syntenic relationship was investigated using the MCScanX toolkit of Tbtools software (Chen et al. 2020). The selection pressures of MYB gene pairs during the evolution of cotton species were evaluated with Ka/Ks ratios calculated using Ka/Ks calculator 2.0 (Wang et al. 2010).
Conserved motifs, gene structure and promoter elements of MYB proteins
The conserved motifs of MYB proteins from four cotton species were analyzed using the online Multiple Em for Motif Elicitation (MEME) program (https://meme-suite.org/tools/meme, version 5.5.2), and the parameters were set according to previous reports (Li et al. 2016). The putative conserved motifs were annotated by searching Pfam and SMART.
For the analysis of MYB gene structure, the online Gene Structure Display Server (https://gsds.cbi.pku.edu.ch) (Li et al. 2016) was employed to map the distribution of exons and introns of each gene, in which cDNA sequences of each MYB gene and its corresponding genomic DNA sequences were uploaded and aligned.
To investigate the cis-acting elements of the promoter sequence, the upstream 2,000-bp region of start codon was subjected to the online PlantCARE database (https://bioinformatics.psb.ugent.be/webtools/plantcare/html/) according to the previous method (Lescot et al. 2002) with some modifications.
Cotton materials, growth conditions and stress tests
Seeds of upland cotton (Texas Marker-1, TM-1) were generous gifts from Prof. Fuguang Li (Chinese Academy of Agricultural Sciences). The plump seeds were selected and soaked in 30% hydrogen peroxide for 1 h to soften seed coat and were washed with distilled water 3–5 times (Su et al. 2023). The soaked seeds were planted in pots filled with mixture (1:2, nutrient soil and vermiculite) and were cultured under with a light and dark photoperiod regime of 16/8 h at 25°C (Chen et al. 2015).
For the validation of the expression patterns of GhMYBs under stress conditions, two-week-old cotton seedlings with the same growth potential were subjected to 20% (m/v) polyethylene glycol 6000 (PEG6000, mimicking drought stress) and 200 mM NaCl. Seedlings that were chemical-free were used as the control. Samples were obtained at 0, 1, 3, 6, 12 and 24 h and stored at −80°C for subsequent experiments.
RNA extraction, cDNA synthesis and RT-qPCR
Total RNA was extracted using the FastPure Universal Plant Total RNA Isolation Kit (Nanjing Vazyme Biotech Co., Ltd, Nanjing, China), and the concentration and purity of RNA were detected using NanoDrop 2000 (ThermoFisher Scientific; Waltham, MA) and agarose gel electrophoresis, respectively (Su et al. 2023). cDNA was synthesized according to the instructions of the HiScript II Q RT SuperMix for qPCR kit (Nanjing Vazyme Biotech Co., Ltd).
Here, ChamQ Universal SYBR qPCR Master Mix kit (Nanjing Vazyme Biotech Co., Ltd) was used for RT-qPCR. The expression level of target genes was detected using the Applied Biosystems® 7500 Fast Real-Time PCR System (ABI7500; ThermoFisher Scientific; Waltham, MA), with three biological and three technological repeats. The internal references for Gh and A. thaliana were Ghactin and Atactin2, respectively. The relative expression level of target genes was calculated using the 2−ΔΔCT method. The primers used for RT-qPCR are shown in Supplementary Table S5.
VIGS and stress treatments
The pYL156, pYL192 and pYL-PDS silencing systems were previously shown to be effective in induction of gene silencing in cotton (Long et al. 2019). The specific fragments of Gh_D01G168900.1, Gh_D03G146200.1 and Gh_D11G052400.1 were amplified through PCR with specific primers (Supplementary Table S6). Purity PCR products were cloned into the pYL156 plasmid via a homologous recombination method. The recombinant plasmids, pYL156-GhMYB, pYL192 and pYL-PDS, were transformed into Agrobacterium tumefaciens (GV3101) strain. The bacterial fluid was injected into the leaves of cotton seedlings.
To investigate the roles of GhMYBs during the response to drought stress, the water-deficit treatment of GhMYB-silenced seedlings and pYL156-00 plants was carried out at the two-leaf stage (7 d). The controls were irrigated with Hoagland’s solution (pH 5.9). On day 14 after water-deficit treatment, the water loss rate in leaves was calculated (Chen et al. 2015). Additionally, the damage index of plants after water-deficit treatment for 2 weeks was evaluated as previously described (Li et al. 2019), with some modifications.
Heterologous transformation of A. thaliana and stress treatments
The seeds of A. thaliana (Col-0) were surface-sterilized with 5% (w/v) NaClO for 20 min and were washed with sterile water three times (Su et al. 2019). These seeds were stored at 4°C for 2 d and evenly sown on 1/2 Murashige and Skoog (MS) solid medium with 1% (m/v) sucrose. After that, they were transferred to light culture under 16-h light/8-h dark at 21 ± 1°C. On day 7 after being sown, seedlings were replanted in a 1:2 mixture of nutrient soil and vermiculite.
CDS fragments of Gh_D01G168900.1, Gh_D03G146200.1 and Gh_D11G052400.1 were amplified through PCR with specific primers (Supplementary Table S7). The recombinant plasmids (Super1300 vector) were transformed in wild-type A. thaliana (Col-0) by the Agrobacterium (GV3101)-mediated floral dip method (Su et al. 2019). Here, the positive transgenic lines were screened on 1/2MS solid medium containing 25 μg/ml hygromycin. GhMYB-transgenic seedlings grown for 4 weeks were identified by RT-qPCR. Finally, five independent transgenic lines for each gene were obtained and named OE1, 2, 3, 4 and 5, respectively.
The transgenic A. thaliana plants grown for 7 d were challenged with water-deficit treatment for 18 d. Seedlings of control groups were irrigated with Hoagland’s solution (pH 5.9). After that, water loss rate, MDA content and proline levels were examined according to previous reports (Chen et al. 2015, Su et al. 2019).
Statistical analysis
The experimental data were statistically analyzed using SPASS11.0 software and then plotted using Origin 2019. For all experiments, the data were presented as means ± SD of three independent experiments with three biological replicates for each. The significant differences were detected using Duncan’s multiple range tests using the one-way analysis of variance method. Bars with different letters are significantly different at P < 0.05.
Supplementary Data
Supplementary Data are available at PCP online.
Data Availability
The data of cotton MYB TFs underlying this paper were available in the Cotton Functional Genomics Database at https://cottonfgd.org/. No new datasets were generated. The raw sequence data of Gh, Gb, Ga and Gr were available in NCBI-BioProject database and can be accessed with accession numbers PRJNA503326, PRJNA433615, PRJNA382310 and PRJNA171262, respectively. AtMYB protein sequences were derived from the Arabidopsis information source database at https://www.arabidopsis.org/.
Funding
This work was supported by Natural Science Foundation of Henan (number 232300421262), Project funded by China Postdoctoral Science Foundation (number 2022M721053), Postdoctoral Research Grant in Henan Province (number 202102068), National Science Foundation of China (number 31870312), Program for Innovative Research Team (in Science and Technology) in University of Henan Province (number 23IRTSTHN022) and Henan Science & Technology Research and Development Plan Joint Fund (number 222301420097).
Acknowledgments
We acknowledge the useful technical assistance by all colleagues. We appreciate ‘The High Performance Computing Center of Henan Normal University’ for providing the data analysis. We are also grateful for the comments proposed by the respected editors and reviewers for this paper.
Author Contributions
J.S., S.S. and H.D. conceived and designed the research. J.S., N.Z., X.C. and S.S. performed the main experiments. J.S., S.S., T.D. and H.D. analyzed all the experimental data. J.S., X.G. and H.D. wrote and revised the manuscript. All authors reviewed and approved the manuscript.
Disclosures
The authors have no conflicts of interest to declare.
