


Abstract
The spatial separation of photosystems I and II (PSI and PSII) is thought to be essential for efficient photosynthesis by maintaining a balanced flow of excitation energy between them. Unlike the thylakoid membranes of plant chloroplasts, cyanobacterial thylakoids do not form tightly appressed grana stacks that enforce strict lateral separation. The coexistence of the two photosystems provides a ground for spillover—excitation energy transfer from PSII to PSI. Spillover has been considered as a pathway of energy transfer from the phycobilisomes to PSI and may also play a role in state transitions as means to avoid overexcitation of PSII. Here, we demonstrate a significant degree of energy spillover from PSII to PSI in reconstituted membranes and isolated thylakoid membranes of Thermosynechococcus (Thermostichus) vulcanus and Synechocystis sp. PCC 6803 by steady-state and time-resolved fluorescence spectroscopy. The quantum yield of spillover in these systems was determined to be up to 40%. Spillover was also found in intact cells but to a considerably lower degree (20%) than in isolated thylakoid membranes. The findings support a model of coexistence of laterally separated microdomains of PSI and PSII in the cyanobacterial cells as well as domains where the two photosystems are energetically connected. The methodology presented here can be applied to probe spillover in other photosynthetic organisms.
Introduction
In most photosynthetic organisms, the two photosystems, photosystem I (PSI) and photosystem II (PSII), are equipped with separate light-harvesting antenna systems, including peripheral light-harvesting complexes whose abundance, composition and function are dynamically regulated to maintain the balanced energy flux to the photochemical reaction centers (RCs). Balancing the excitation flux is facilitated by the physical separation of the two photosystems and their antenna complexes. Thus, in land plants PSII and its peripheral antenna, LHCII, reside primarily in the appressed granal thylakoid membranes and PSI is exclusively in the stromal lamellae (Andersson and Anderson 1980, Anderson and Andersson 1988, Dekker and Boekema 2005). It has been argued (Trissl and Wilhelm 1993) that the separation of the antenna systems of PSI and PSII is essential for efficient photosynthesis because the kinetics of trapping of excitation energy is much faster in PSI than in PSII and locating the two antenna systems at short distances would lead to an uncontrolled flow of excitation energy from PSII to PSI. Historically, the excitation energy transfer from PSII to PSI, termed ‘spillover’, was proposed precisely as a mechanism to balance the excitation energy distribution (Myers and Graham 1963, Murata 1969, Butler 1978). The lateral separation not only prevents uncontrolled spillover but also provides the means to actively balance the excitation energy via state transitions, wherein mobile LHCII is shuttled between PSII and PSI (Allen and Forsberg 2001, Wollman 2001, Minagawa 2011, Rochaix 2014).
There are non-appressed regions of the thylakoid membrane, especially the grana margins, where the two photosystems are co-located and can interact with each other (van der Weij-de Wit et al. 2007, Suorsa et al. 2014), allowing the formation of PSII–LHCII–PSI megacomplexes (Krause and Weis 1991). PSII–PSI megacomplexes are proposed to serve as a photoprotective mechanism by which excess excitation energy in PSII is diverted to PSI (Yokono et al. 2015). Efficient quenching of excess excitation energy by PSI has been reported in Arabidopsis (Tiwari et al. 2016) and efficient spillover in a PSI–PSII megacomplex has been observed in a salt-treated macroalga Ulva prolifera, which has very few grana stacks (Gao et al. 2019). Recently, efficient energy spillover was reported in rice PSI–PSII megacomplexes (Kim et al. 2023).
The thylakoid membranes of cyanobacteria do not form grana (Van De Meene et al. 2006) and lack membrane-intrinsic light-harvesting complexes. Instead, the absorption cross-section of the photosystems is enhanced by the membrane-peripheral phycobilisomes (PBSs) that efficiently transfer energy to chlorophylls (Chls) in the photosystems (Glazer 1984, Adir et al. 2020). PBSs are generally considered as an antenna for PSII (which has a relatively smaller core antenna), but they can transfer energy to PSI as well either directly or indirectly via spillover (Murata 1969, Mullineaux 1994, Liu et al. 2013, Chukhutsina et al. 2015). Spillover has long been considered as one of the possible mechanisms by which cyanobacteria undergo state transitions under different light conditions (Murata 1969, Bruce et al. 1989, Li et al. 2004). However, the evidence for this has been inconsistent and there is a growing consensus that other processes, such as dynamic interactions between PBSs and photosystems, or excitation quenching in PSII, play a more important role in cyanobacterial state transitions (Calzadilla and Kirilovsky 2020). Nevertheless, the existence of spillover, be it regulated or constitutive, can be inferred from the lack of grana and hence, presumably, the lower degree of lateral separation of the photosystems as compared to plants. Cross-linking studies have suggested the existence of PBS–PSI–PSII megacomplexes in cyanobacterial thylakoid membranes (Liu et al. 2013) and there is spectroscopic evidence for spillover in megacomplexes (Yokono et al. 2011, Ueno et al. 2016). On the other hand, the existence of membrane microdomains enriched in either PSII or PSI has been reported in cyanobacteria (Vernotte et al. 1990, Folea et al. 2008, MacGregor-Chatwin et al. 2017, Strašková et al. 2019). This organization of microdomains in the thylakoid membranes is relatively stable but can vary over hours or days (Canonico et al. 2020). This would limit the formation of megacomplexes and spillover to contact regions between microdomains.
It is clear that the energy flow and energy balancing mechanisms in cyanobacteria are exceedingly difficult to distinguish. No studies have reported a reliable method to quantify the extent of spillover in quantum yield terms. Here, we used low-temperature fluorescence spectroscopy and time-resolved fluorescence spectroscopy of native thylakoid membranes from Thermosynechococcus vulcanus(Thermostichus vulcanus NIES-2134, hereafter T. vulcanus) and Synechocystis sp. PCC 6803 (hereafter S. 6803) with the specific aim of quantifying spillover. To quantify spillover from the fluorescence emission spectra (FES), we determined the relative fluorescence yields of isolated PSI and PSII in reconstituted membranes as a reference. We will show that in membranes containing both PSI and PSII, energy spillover occurs to an extent comparable to that in native thylakoid membranes and we propose a method to quantify spillover by time-resolved fluorescence spectroscopy, which yields similar results without the need for reference measurements on isolated photosystems.
Results
Low-temperature FES of reconstituted membranes
Reconstituted membranes were used as a model of energy spillover whereby the photosystem composition and stoichiometry were predefined. If there is energetic connectivity between the two photosystems, we can expect that PSII emission will be quenched as energy is efficiently trapped by PSI. We tested this hypothesis by comparing the FES of reconstituted membranes, containing PSI, PSII or both photosystems (from T. vulcanus) at an equimolar ratio of PSI trimers to PSII dimers (RC ratio 1.5:1). This stoichiometry falls within the range of values determined in native cyanobacteria (Supplementary Table S1). The FES were recorded at 77 K under the same instrumental conditions and scaled to the same PSI trimer and PSII dimer concentrations (Fig. 1A). The two photosystems can be readily distinguished by their fluorescence emission at low temperatures because PSII emission peaks in the red wavelength region around 686 nm (Andrizhiyevskaya et al. 2005), whereas PSI peaks in the far-red region at 720–730 nm (Gobets and van Grondelle 2001). Fig. 1B compares the measured FES of the mixed PSI:PSII membranes and the arithmetic sum of the PSI and PSII spectra. It is apparent that the PSII emission intensity, hence the relative fluorescence yield, is lower in the mixed PSI:PSII membranes.
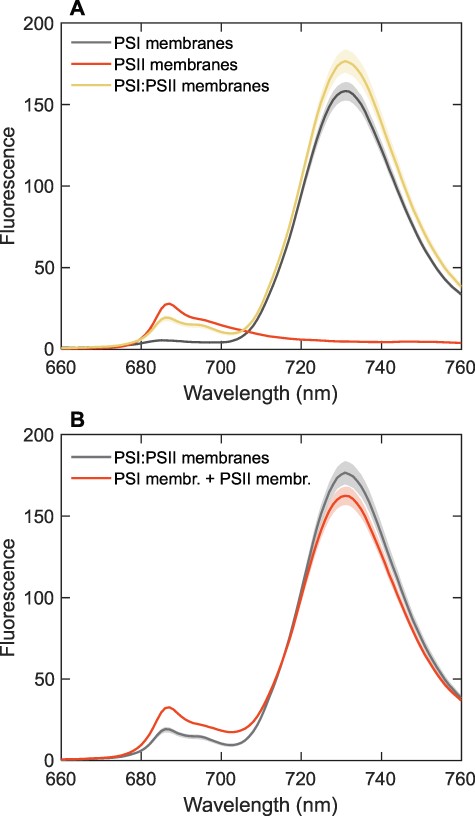
The FES of reconstituted membranes containing T. vulcanus PSI, PSII or PSI:PSII (1.5:1 ratio) recorded at 77 K with 440-nm excitation light. (A) A comparison of the spectra of PSI, PSII and PSI:PSII membranes. The spectra are the average from three independent experiments; the shaded areas represent standard errors. All samples had the same absorbance at the excitation wavelength and were measured using the same instrument settings. The spectra of PSI and PSII are scaled by 0.8 and 0.2, respectively, to correspond to the Chl content of each photosystem in the mixed PSI:PSII membranes. (B) A comparison of the measured spectrum of the PSI:PSII mixed membranes and the arithmetic sum of the spectra of PSI and PSII membranes measured separately.
Assuming that PSII quenching is due to energy spillover, we can estimate the degree of spillover from the relative fluorescence yield change of PSII in the mixed PSI:PSII membranes. We further assume that intrinsic fluorescence yields of PSI and PSII, |${{{\varphi }}_{\rm{I}}}$| and |${{{\varphi }}_{{\rm{II}}}}$|, in liposomes are unchanged when the two are reconstituted in mixed systems. We can estimate spillover, i.e. the fraction of energy absorbed by PSII that is transferred to PSI, from the reduction of the PSII fluorescence yield in the mixed PSI:PSII liposomes. Note that fluorescence spectra are measured from samples diluted to the same absorption at the excitation wavelength and at the same instrumental conditions. The fluorescence intensity can then be used as a proxy of the fluorescence yield. Table 1 shows the measured intensities of PSI, PSII and PSI:PSII liposomes at 686 nm. Due to spillover, the fluorescence in the mixed liposomes is reduced (quenched) by a factor |$q$|. The total emission of the PSII:PSI mix at 686 nm is the sum of (quenched) PSII and PSI contributions:
The 77-K fluorescence intensities of PSI and PSII liposomes at 686 nm
| Sample type | F686 |
|---|---|
| PSI liposomes | 4.6 |
| PSII liposomes | 26.8 |
| PSI:PSII liposomes (mix) | 20.2 |
| Sample type | F686 |
|---|---|
| PSI liposomes | 4.6 |
| PSII liposomes | 26.8 |
| PSI:PSII liposomes (mix) | 20.2 |
The change in PSI emission at 686 nm due to spillover is negligible. The spillover, |${{\xi }}$|, is then:
Thus, about 40% of the excitations of PSII are lost in the mixed PSI:PSII membranes, presumably due to energy spillover to PSI.
Fluorescence spectra of thylakoid membranes and intact cells
Next, we compare the 77-K FES spectra of intact dark-adapted cells and isolated thylakoid membranes of T. vulcanus and S. 6803 (Fig. 2). The excitation light (440 nm) is poorly absorbed by the PBSs; therefore, the spectra are dominated by Chl fluorescence. Although not identical, the FES of the thylakoid membranes and cells are similar to each other. The values of the maximal variable fluorescence Fv/Fm of thylakoid membranes were also comparable to cells albeit slightly lower (Supplementary Table S2). The values are in line with other reports for dark-adapted cyanobacteria (Campbell et al. 1998, Boulay et al. 2008, Santabarbara et al. 2019). Thus, the FES of the thylakoid membranes resemble the FES of cells in state II (Stadnichuk et al. 2009, Calzadilla and Kirilovsky 2020), although the similarity may only be coincidental since thylakoid membranes are largely devoid of PBS and may adopt different supramolecular organizations and interactions of the pigment–protein complexes. For instance, a slight blue shift of the PSI maximum is apparent in isolated thylakoid membranes. Nonetheless, it is worth pointing out that the FES spectra of cells and thylakoid membranes from T. vulcanus and the reconstituted PSI:PSII membranes are similar. The PSI:PSII emission peak ratios of isolated thylakoid membranes from T. vulcanus and S. 6803 were 12 and 6, respectively. These values are higher than the expected intensity ratios of PSI and PSII based on the estimated PSI:PSII RC stoichiometry (Supplementary Table S1) and assuming that the relative fluorescence yields of PSII and PSI in the native and reconstituted membranes are the same. Hence, the data indicate that PSII emission is also quenched in the native systems, which could be as a result of spillover.
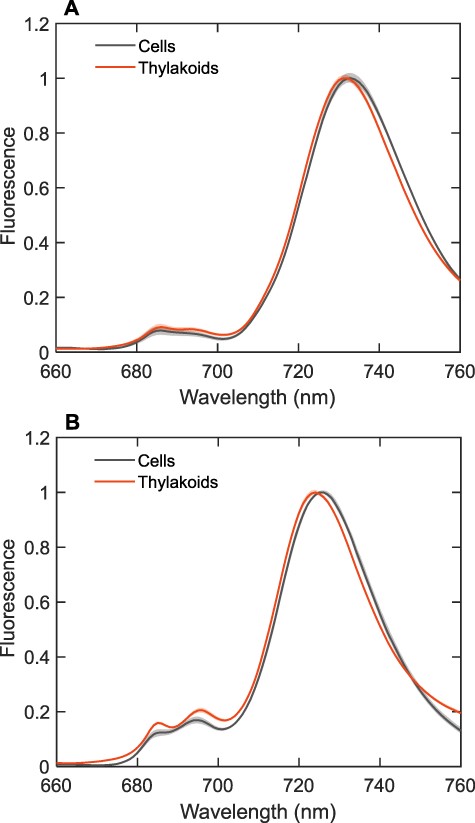
The FES of intact dark-adapted cells (in state II) and thylakoid membranes of T. vulcanus NIES-2134 (A) and Synechocystis sp. PCC 6803 (B) recorded at 77 K, normalized to the maximum fluorescence emission. The excitation wavelength was 440 nm. The spectra are the average from seven to nine independent experiments; the shaded areas represent standard errors. Note that the spectra of cells from S. 6803 were recorded with 5 nm spectral bandwidth.
Solubilization of the protein complexes in detergent micelles should prevent close physical interactions between them necessary for spillover. Hence, we would expect the emission from PSII to increase and the emission from PSI to decrease (although not to the same extent because the two systems have different abundance and fluorescence quantum yields). When the thylakoid membranes were solubilized by incubation in the presence of detergent [0.01 − 0.03% n-dodecyl-β-d-maltoside (β-DDM)], PSII emission increased significantly (Supplementary Fig. S1)—3-fold in S. 6803 and 5-fold in T. vulcanus, whereas PSI emission decreased (note that the spectra are not normalized). Although there could be different causes for the detergent-induced PSII fluorescence increase, the result is consistent with the abolition of the energy spillover by the detergent solubilization. The spectra also suggest that PSII fluorescence is more strongly quenched in T. vulcanus than in S. 6803—both based on the higher PSI:PSII peak ratio and on the larger detergent effect in T. vulcanus. Note that the emission from the two photosystems can also be resolved at room temperature, albeit not so prominently. Nevertheless, the FES of thylakoid membranes recorded at room temperature show the same qualitative trend upon solubilization—i.e. a strong increase in the PSII fluorescence at ∼680 nm and a slight decrease in the intensity of the far-red emission peak relative to 680 nm (Supplementary Fig. S2). Detergent treatment of reconstituted membranes brought about similar changes to the fluorescence spectra as in thylakoid membranes—the emission at 686 nm increased by a factor of 7 after incubation with 0.03% β-DDM (Supplementary Fig. S3). Note that it is generally not possible to quantify the spillover based on the FES of detergent-solubilized membranes because the effect of the detergent itself on the fluorescence yields of both photosystems cannot be precisely accounted for.
Time-resolved fluorescence spectroscopy
We recorded the fluorescence kinetics of isolated T. vulcanus PSI and PSII in reconstituted membranes and compared them with the kinetics of the mixed PSI:PSII membranes. The global exponential analysis of the fluorescence decays resulted in decay lifetimes and decay-associated emission spectra (DAES) presented in Fig. 3. The kinetics of PSI membranes (Fig. 3A) are essentially the same as PSI from T. elongatus reported by Byrdin et al. (2000). The main fluorescence decay components have lifetimes of 13 and 38 ps. The former shows a negative-amplitude peak at 728 nm representing the rising fluorescence of red Chls. The second DAES (38 ps) shows the trapping of equilibrated antenna excitations. Longer-lived components of low amplitudes (<5%) peaking between 672 and 680 nm apparently show small populations of uncoupled pigments and other impurities. The PSII kinetics (Fig. 3B) can be approximated with two decay lifetime components—typically around 40–60 and 200–400 ps—that share the same spectral shape and can be assigned to trapping and secondary electron transfer, respectively (Miloslavina et al. 2006). A low-amplitude (<8%) nanosecond DAES, assigned to a population of PSII with closed RCs, is omitted from the figure. The fact that PSI and PSII have distinct spectra, as well as decay lifetimes, allows us to resolve their contribution and connectivity.
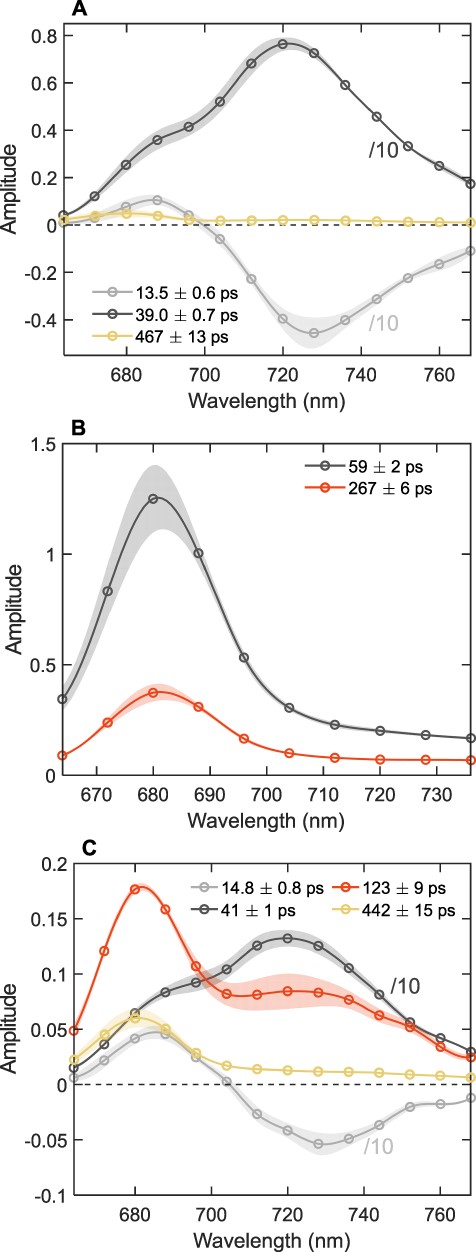
The DAES of T. vulcanus PSI and PSII in reconstituted membranes obtained by the global analysis of the fluorescence decays recorded at room temperature with 440-nm excitation. (A) PSI-only membranes. (B) PSII-only membranes. (C) PSI:PSII membranes (1.5:1). Note that only the symbols represent measured data points, whereas the lines are interpolated to guide the eye. For better visualization, the spectra of the short-lived PSI components are divided by 10 and low-amplitude long-lived components (>2 ns) are omitted. The spectra are the average from three independent measurements, normalized to the same integrated fluorescence intensity (area of the steady-state fluorescence spectrum). The standard error of the mean is shown by the shaded areas.
Fig. 3C shows the average DAES of reconstituted membranes containing PSI and PSII isolated from T. vulcanus at an RC ratio of 1.5:1. Five decay components were necessary to fit the fluorescence kinetics (decay curves and fit residuals are shown in Supplementary Fig. S4). The fluorescence kinetics is dominated by PSI, which contains the majority of Chls in the membranes. Note that the PSI DAES (gray curves) are divided by a factor of 10 for visual comparison. Short-lived PSII decay components (40–60 ps) are not resolved in these experiments as they overlap with the main PSI trapping lifetime. The main long-lived decay component has a ∼120-ps lifetime and a DAES possessing a prominent maximum in the far-red region (730 nm), which indicates that the fluorescence is also emitted from PSI. The far-red emission peak in the 120-ps DAES is apparent when comparing the area-normalized spectra (Supplementary Fig. S5). The DAES fits to a linear combination of the PSI and PSII DAES with scaling factors of 40% and 60%, respectively (Supplementary Fig. S5). As PSI on its own does not have such long-lived fluorescence (cf. Fig. 3A), the only possibility that PSI and PSII excitations decay simultaneously is that there is energy transfer between them—this is direct evidence for spillover. The decay lifetime (∼120 ps) reflects the effective timescale of PSII–PSI energy transfer. The next long-lived component (∼400 ps) shows a spectral shape consistent with PSII and can be assigned to emission from a population of PSII that is not affected by spillover.
The fluorescence decay lifetimes and DAES obtained for thylakoid membranes isolated from T. vulcanus and S. 6803 are shown in Fig. 4. Five decay components were necessary to fit the fluorescence kinetics of thylakoids from T. vulcanus, whereas four components were sufficient for S. 6803 (decay curves and fit residuals are shown in Supplementary Fig. S6). In T. vulcanus (Fig. 4A), PSI emission contributes to the two shortest lifetimes (13 and 37 ps). The DAES are divided by 15 for visual comparison. PSII emission is mainly attributed to the longer-lived decay components—about 130 and 480 ps. Similar to the reconstituted membranes, the 130-ps DAES shows a pronounced far-red maximum, indicating contribution from PSI, whereas the 480-ps DAES resembles the spectral profile of PSII (Fig. 3B). The 130-ps DAES can be represented as the sum of the DAES assigned to PSI (37 ps) and PSII (480 ps) with about 38% and 62% contribution, respectively.
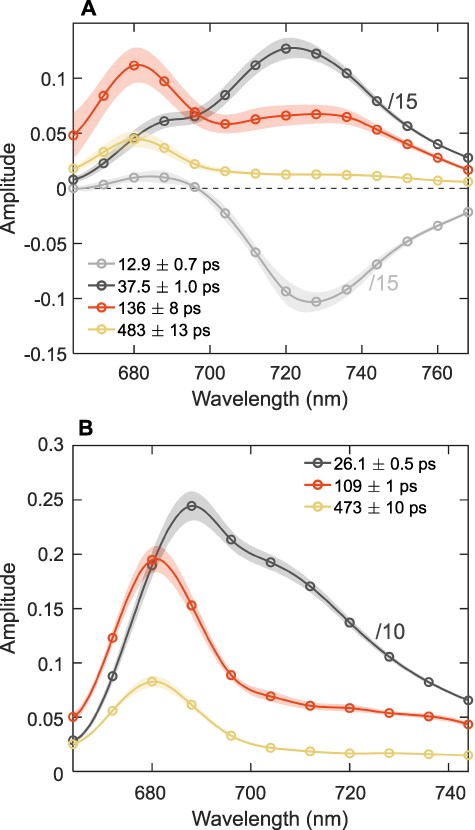
The DAES of thylakoid membranes from T. vulcanus (A) and S. 6803 (B) obtained by the global lifetime analysis of the fluorescence decays recorded at room temperature with 440-nm excitation. Note that only the symbols represent measured data points, whereas the lines are interpolated to guide the eye. For better visualization, the spectra of the short-lived PSI components are divided by 10 (for S. 6803) or 15 (for T. vulcanus). The spectra are the average from seven (T. vulcanus) or eight (S. 6803) independent measurements; the shaded areas represent standard errors. For clarity, long-lived 2-ns components with very small amplitudes (<3%) are omitted. Representative fluorescence decays and fit residuals are shown in Supplementary Figure S6.
In S. 6803 thylakoids (Fig. 4B), PSI is represented by a single-trapping lifetime (26 ps), whereas energy transfer to the red Chls is faster than the time resolution of the experiment (Gobets and van Grondelle 2001). The three longest-lived components have lifetimes comparable to T. vulcanus. Even though the far-red emission is less obvious in S. 6803, the results are qualitatively similar—the 110-ps DAES has a higher intensity in the far-red region than the 470-ps DAES (normalized DAES are shown in Supplementary Fig. S7). The 110-ps DAES can be well described as a linear combination of the 26-ps DAES (PSI) and the 470-ps DAES (PSII), with 30% and 70% contributions, respectively. From the fluorescence kinetics of thylakoid membranes, we conclude that the decay kinetics of a large fraction of PSII is significantly accelerated due to spillover as in reconstituted membranes and that the PSII–PSI energy transfer occurs on a similar effective timescale (110–130 ps).
The fluorescence kinetics of intact cells were measured and analyzed in the same way as thylakoid membranes (Fig. 5). The two shortest-lived components with lifetimes of 17 and 41 ps dominate the dynamics and strongly resemble the PSI components in reconstituted and thylakoid membranes, except that the former has negative amplitudes throughout the wavelength range. The lack of positive amplitudes is probably an artifact, for instance, caused by the incomplete rejection of the scattered excitation light due to the high turbidity of the cell suspension. The main ‘PSII’ decay lifetime resolved in T. vulcanus cells—166 ps—is longer than in isolated thylakoid membranes by a small but significant margin, and the DAES has a lower amplitude in the far-red region than the corresponding DAES in isolated thylakoid membranes. The DAES shape approximately corresponds to a sum of the 40- (20%) and 480-ps (80%) DAES. In S. 6803, the 170-ps DAES matches the sum of the 26- and 550-ps DAES weighted by approximately 30% and 70%, respectively.
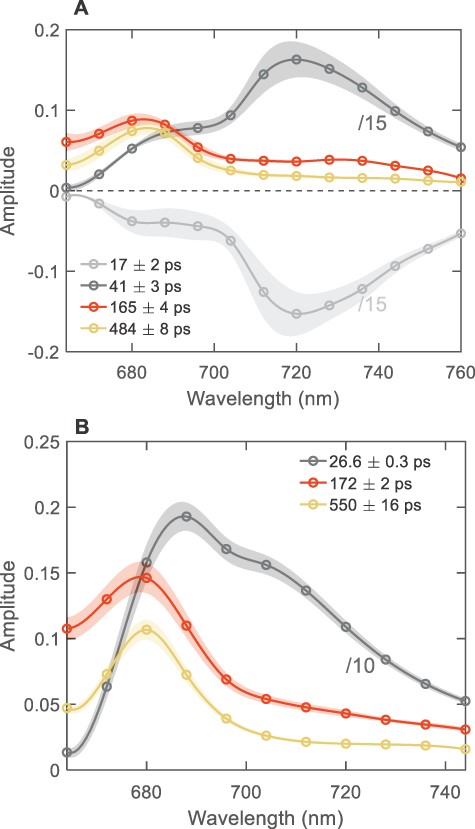
The DAES of intact cells T. vulcanus (A) and S. 6803 (B) obtained by the global lifetime analysis of the fluorescence decays recorded at room temperature with 440-nm excitation. For better visualization, the spectra of the short-lived PSI components are divided by 10 (for S. 6803) or 15 (for T. vulcanus). The spectra are the average from three (T. vulcanus) or six (S. 6803) independent measurements; the shaded areas represent standard errors. For clarity, long-lived 2-ns components with very small amplitudes (<1%) are omitted.
Quantification of spillover from DAES
The DAES strongly suggest that spillover occurs in the intact cells of both species but to a lower extent than in the isolated thylakoid membranes. The difference is evident, for instance, from the smaller apparent contribution of PSI to the 170-ps DAES (20%) compared to isolated membranes. The fact that the decay lifetime (170 ps) is longer than that of isolated membranes (120–130 ps) also testifies to the smaller degree of spillover in intact cells. We define the quantum yield of spillover as the relative number of quanta absorbed by the PSII antenna that are transferred to and trapped by the PSI RC. If we take 260 ps as the unquenched lifetime of PSII in the absence of spillover (Fig. 3B), we can estimate that the PSII decay lifetime in thylakoid membranes is approximately reduced by half. However, this value only applies to the fraction of PSII connected to PSI (we denote it by PSIIβ). The total yield of spillover must take into account the fraction of PSII that is not connected to PSI (PSIIα). An estimate of these fractions can be obtained from the amplitudes of the PSII DAES, in this case the ∼130- and ∼400-ps DAES (Fig. 4). The total spillover ξ is then calculated as follows:
where |${{\beta }}$| and |${{{\tau }}_{{\beta }}}$| are the relative concentration and decay lifetime of the connected PSII (PSIIβ) and |${{{\tau }}_0}$| is the unquenched PSII lifetime. The values of these parameters for the different samples are summarized in Table 2. The yield of spillover in isolated membranes varies between 0.34 and 0.40—comparable to the degree of PSII quenching estimated from low-temperature FES. In cells, we determine lower spillover yields (about 0.20), which are consistent with the analysis of the DAES shapes. Note, however, that |${{{\tau }}_{{\beta }}}$| and |${{{\tau }}_0}$| are only approximate measures of the PSII decay lifetimes (in reality PSII emission decays non-exponentially).
Spillover yields ξ estimated from the average DAES
| Sample type | β | τβ (ps) | 1 − τβ/τ0 | ξ |
|---|---|---|---|---|
| Reconstituted membranes | 0.75 | 123 | 0.53 | 0.39 |
| Thylakoid membranes of T. vulcanus | 0.71 | 136 | 0.48 | 0.34 |
| Thylakoid membranes of S. 6803 | 0.69 | 110 | 0.58 | 0.40 |
| Intact cells of T. vulcanus | 0.54 | 165 | 0.36 | 0.20 |
| Intact cells of S. 6803 | 0.58 | 172 | 0.34 | 0.20 |
Kinetic modeling
For a more detailed understanding of the excitation dynamics and the origin of the fluorescence decay components, we performed kinetic model fitting (target analysis) of the time-resolved spectroscopy data (Holzwarth 1996, van Stokkum et al. 2004). A minimal kinetic model that reproduces the measured fluorescence kinetics of reconstituted PSI:PSII membranes and isolated thylakoid membranes should consist of four kinetic compartments. The simplest kinetic scheme—a parallel model, where all four compartments decay simultaneously—is mathematically identical to the global lifetime analysis. In both models, two compartments represent the bulk and red Chls in PSI connected by reversible energy transfer with rate constants kbr and krb. A similar two-compartment model scheme is used to fit the kinetics of isolated PSI (Supplementary Fig. S8). The other two compartments are assigned to PSII (PSIIα and PSIIβ). In the ‘independent’ model scheme (Fig. 6A), the PSII compartments decay independently, whereas in the ‘spillover’ model (Fig. 6B), energy transfer is allowed between PSIIβ and PSI with rate constants ks and k−s. Both models fit the fluorescence decays with the same goodness-of-fit, decay lifetimes and DAES as the all-parallel global analysis (Supplementary Fig. S9). However, the species-associated emission spectra (SAES) and the rate constants are model-dependent. The rate constants are summarized in Table 3 and the SAES are shown in Fig. 6 for reconstituted membranes and in Supplementary Figs. S10 and S11 for thylakoid membranes and whole cells of T. vulcanus. The ‘independent’ model fit results in unrealistic SAES of the PSIIβ compartment with a prominent peak in the far-red region (Fig. 6C). In contrast, for the ‘spillover’ model, both PSII compartments have SAES and decay rate constants similar to isolated PSII (cf. Fig. 6D and Supplementary Fig. S8). Therefore, only the spillover model provides a physically plausible description of the experimental fluorescence kinetics of both reconstituted and thylakoid membranes.
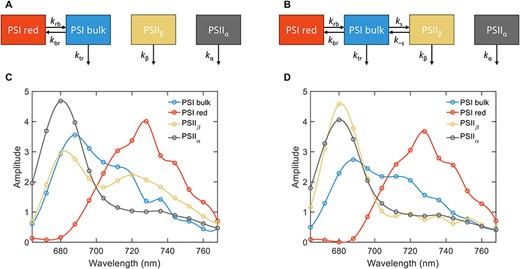
The kinetic model of energy spillover in reconstituted PSI:PSII membranes. (A) The kinetic model scheme for an ‘independent’ model consisting of two connected PSI compartments (bulk and red Chls) and two unconnected PSII compartments (PSIIα and PSIIβ). (B) The kinetic model scheme of a ‘spillover’ model, whereby the PSIIβ is energetically coupled to PSI with energy transfer rate constants ks and k−s. (C) SAES obtained by fitting the ‘independent’ model to the fluorescence decays. (D) SAES corresponding to the ‘spillover’ model. The spectra are normalized to their respective area.
Rate constants obtained from target analysis of the fluorescence kinetics
| Model | Sample type | ktr | kbr | krb | ks | k−s | kβ | kα |
|---|---|---|---|---|---|---|---|---|
| Independent | Reconstituted membranes | 37 | 7.5 | 45 | 11 | 2.5 | ||
| Thylakoid membranes of T. vulcanus | 39 | 9 | 50 | 7.2 | 1.9 | |||
| Spillover | Reconstituted membranes | 30 | 6.1 | 41 | 4.3 | 1.5 | 3.6 | 2.2 |
| Thylakoid membranes of T. vulcanus | 35 | 6.5 | 52 | 5.5 | 1.5 | 3.3 | 2.1 | |
| Intact cells of T. vulcanus | 30 | 10 | 54 | 2.3 | 1.8 | 2.0 | 1.4 |
The modeling shows qualitatively that spillover occurs in all three systems—reconstituted membranes, thylakoid membranes and intact cells. The degree of spillover depends largely on the magnitude of the rate constants ks and k−s. The rate constants have similar values for thylakoids and reconstituted membranes and are somewhat smaller for cells, suggesting a lower degree of spillover, which is in agreement with the estimates presented earlier. It should be noted that ks and k−s are effective rate constants due to the simplified representation of the PSII kinetics. Extended models can be constructed including primary and secondary charge separation in PSII (Supplementary Fig. S12). In these models, PSII→PSI energy transfer rate constants fall in the range of 8−10 ns−1.
Discussion
In this study, we compared the fluorescence emission of PSI and PSII in the thylakoid membranes of two cyanobacterial strains, T. vulcanus and S. 6803, and found clear evidence for the occurrence of spillover, i.e. excitation energy transfer from PSII to PSI. The first indication for spillover is the fluorescence quenching of PSII seen in the emission spectra of mixed reconstituted membranes and native isolated thylakoid membranes. We employed reconstituted membranes as a model system for energy spillover. The results showed that the fluorescence emission of PSII is markedly decreased (by 40%) when PSII and PSI coexist in the same membranes. The fluorescence quenching of PSII in the mixed membranes is consistent with spillover, although the mechanism of quenching cannot be inferred from the PSII fluorescence yield alone. Alternatively, one could hypothesize that energy is lost non-radiatively, for instance, because of pigment–pigment interactions in the dense protein arrays (aggregation quenching) or due to specific PSII–PSI interactions inducing non-photochemical quenching (NPQ) in PSII. Note, however, that aggregation is not a likely reason for the quenching because the PSI:PSII membranes had higher lipid:protein ratios (360:1) than the PSII-only membranes (180:1). In the absence of other known mechanisms, we assume that the quenching of PSII emission is due to spillover.
Whereas the steady-state FES only allow us to compare the relative fluorescence yields of PSII and PSI, time-resolved fluorescence spectroscopy reveals that the mechanism of PSII fluorescence quenching is via energy transfer to PSI because we observe long-lived decay components (120 ps) in the far-red wavelength region in the mixed PSI:PSII membranes that can be attributed to a population of PSI accepting energy from PSII. Thus, the far-red emission in the ∼120-ps DAES can be used as a marker to spot the occurrence of spillover in other samples as well. The close similarity of the FES and the fluorescence kinetics of reconstituted membranes and thylakoid membranes of T. vulcanus suggests that spillover occurs in the thylakoid membranes to a similar extent. The strongest attestation to this is the similar contribution of PSI emission in the 130-ps DAES of isolated thylakoid membranes.
The total spillover yield estimated from the lifetimes and amplitudes of the PSII-associated DAES is substantial in both the reconstituted and thylakoid membranes from both T. vulcanus and S. 6803—the results indicate that up to 40% of the excitations in PSII are lost due to energy spillover to PSI (Table 2). Evidently, this would strongly affect the excitation balance of the two photosystems and the linear electron flow from water to NADPH. On the other hand, the results obtained from intact cells suggest that the degree of spillover is significantly lower than in isolated thylakoid membranes—judged by the longer PSII lifetimes (160–170 ps) as well as the smaller amplitudes of the respective DAES in the far-red region. It should be noted that the PSII decay lifetimes of S. 6803 are similar to those reported by Bhatti et al. (2020). Their 160-ps DAES also appear to have some contribution from PSI in the far-red region, consistent with the results presented here.
The apparently smaller spillover magnitude observed in cells could be attributed to the presence of separate PSII- and PSI-enriched microdomains in the cells (MacGregor-Chatwin et al. 2017, Strašková et al. 2019). The stable occurrence of separate microdomains of PSI and PSII and, more generally, protein heterogeneity in the cyanobacterial thylakoid membranes (Rexroth et al. 2011, Konert et al. 2019, Rast et al. 2019, Canonico et al. 2021) could well be a major factor controlling the extent of spillover in intact cells. The membrane-attached PBS could influence the interactions between PSII and PSI and energy equilibration of PSII with the attached PBS will compete with PSII − PSI spillover. On the other hand, the lateral separation of photosystems may be disrupted during the isolation of thylakoid membranes and removal of the attached PBS. The isolated thylakoid membranes of cyanobacteria can vary in terms of their integrity, depending on the technique and conditions of isolation and the specific cyanobacterial species. Likewise, reconstituted membranes do not necessarily mirror the assembly of native membranes—for instance, the lipid/protein ratio can affect the PSI/PSII organization and diffusion (Kirchhoff 2014). Conversely, the occurrence of intersystem energy transfer has been reported even in membrane-free PSI–PSII aggregates in solution by Federman et al. (2000) who proposed that spillover may be controlled by non-hydrophobic interactions between peripheral subunits of PSI and PSII.
The extent of spillover might depend on species, growth and physiological conditions. The detection of spillover in this work relies on the ability to identify PSI by the presence of far-red emitting low-energy Chls (red Chls). In comparison to S. 6803, PSI from T. vulcanus contains a higher number of red Chls and more red-shifted forms, resulting in stronger emission in the far-red region, as well as slower equilibration and trapping kinetics that can be observed by time-resolved fluorescence (Gobets and van Grondelle 2001, Croce and van Amerongen 2013). In contrast, PSI in S. 6803 exhibits relatively lower intensity in the far-red region and is represented by a single ∼26-ps lifetime component. Because of the lower far-red emission, it is more difficult to evaluate the degree of spillover in S. 6803. Nevertheless, the fluorescence data of thylakoid membranes from S. 6803 indicate a similar degree of PSI emission in the 110-ps DAES. The estimated spillover yield of intact cells was also found to be similar for the two organisms. This is an intriguing result considering the anatomical and physiological differences between the two-model organisms. Thermosynechococcus vulcanus has rod-shaped cells compared to the spherical S. 6803 and is very similar to the model strain Synechococcus sp. PCC 7942, which is known to have different photoprotective and light regulation properties than S. 6803 (Muzzopappa and Kirilovsky 2020). For instance, S. elongatus and T. elongatus lack the genes for the orange carotenoid protein (OCP) and the blue-light-activated NPQ that OCP is responsible for in other species, including S. 6803 (Abasova et al. 2008, Kirilovsky 2015, Muzzopappa and Kirilovsky 2020).
One could view the occurrence of spillover in cyanobacteria merely as an artifact of their (imperfect) thylakoid membrane architecture that permits the co-localization of PSI and PSII. However, it can also be regarded as a mechanism with a physiological role, e.g. to balance the excitation flow between the photosystems along with state transitions (McConnell et al. 2002, Li et al. 2004). In support of the latter, it should be considered that the occurrence of spillover is not limited to cyanobacteria. It has been reported that red algae have efficient spillover (50% of PSII excitations transferred to PSI) that they use as a mechanism to achieve the excitation balance between PSII and PSI (Yokono et al. 2011, Ueno et al. 2016). A more general view is emerging that spillover may occur to various extents in PSI–PSII megacomplexes in higher plants as well, especially under high light conditions (Yokono et al. 2015, Ifuku 2023). It could be valuable to conduct a systematic evaluation of spillover among photosynthetic groups, for instance using the methodology described here. However, it is important to note that the degree of spillover is a complex aspect of photosynthetic organisms and can vary widely even within a single group (e.g. different species of plants or cyanobacteria).
Cyanobacteria, similar to green algae and higher plants, have highly dynamic thylakoid membranes displaying a high degree of protein mobility and reorganizations in response to the changing light conditions (Casella et al. 2017, Lambrev and Akhtar 2019). It is conceivable that dynamic membrane reorganizations and protein trafficking affect the extent of spillover and the excitation balance. Another possibility to consider is that spillover has a photoprotective role by reducing the excitation pressure on PSII—and has been proposed as a photoprotective mechanism in several groups of photosynthetic organisms, including lichens (Slavov et al. 2013) and conifer plants (Bag et al. 2020). As photoprotection is crucial for survival of all aerobic photosynthetic organisms, virtually all have multiple and sometimes redundant photoprotective mechanisms, acting on different levels of organization and different time and irradiation ranges. In cyanobacteria, state transitions together with the OCP-controlled NPQ are proposed as the main photoprotective mechanisms but others play a role too, such as photoprotection by high-light-inducible proteins (Staleva et al. 2015, Pathak et al. 2019) or photoprotection by iron-stress-inducible protein A in iron-starved cyanobacteria (Wilson et al. 2007). What photoprotective effect spillover exerts in comparison with other mechanisms is not clear. Evidently, more work would be necessary to estimate spillover in intact cells under different physiological conditions/states. Further investigation is needed to quantify spillover in cells in defined physiological states, e.g. with open and closed PSII RCs, in state I and state II, to elucidate the role of spillover in the regulation of light harvesting in physiologically relevant scenarios. Going forward, the methodology to detect spillover presented here opens the possibility to test these hypotheses experimentally and can also be extended to other photosynthetic organisms.
Materials and Methods
Cyanobacterial cultures and growth conditions
The cyanobacterium Synechocystis sp. PCC 6803 wild type (WT) was grown photoautotrophically in 1 l Erlenmeyer flasks containing 500 ml of BG-11 medium supplemented with 5 mM HEPES–NaOH (pH 7.5) as a batch culture. The cultures were placed on a rotary shaker (100 rpm) at 30°C, under continuous white-light illumination at an intensity of ∼35 μmol photons m−2 s−1 photon flux density. The thermophilic cyanobacterium T. vulcanus was grown photoautotrophically as a batch culture in BG-11 medium (pH 7) at 45°C under continuous illumination with a white fluorescent lamp at an intensity of 50–100 μmol photons m−2 s−1 photon flux density.
Sample preparation
Thylakoid membranes of S. 6803 were prepared following the protocols described in Akhtar et al. (2021) and thylakoid membranes of T. vulcanus were isolated following the method of Fromme and Witt (1998) with small modifications. Briefly, 1-week-old cells were harvested and washed in a buffer containing 20 mM MES/NaOH, pH 6.4, 10 mM MgCl2 and 10 mM CaCl2 (hereafter called buffer A) at room temperature by centrifugation for 5 min at 6,000×g. In the case of S. 6803, the pelleted cells were resuspended in buffer A supplemented with 25% glycerol, 0.5 mM phenylmethanesulfonyl fluoride and 1 mM benzamidine and for T. vulcanus in buffer A supplemented with 0.5 M of mannitol. The pelleted cells were broken with glass beads (≤106 μm) using a Precellys Evolution bead beater (Bertin Technologies, Montigny-le-Bretonneux, France) equipped with a dry ice cooling compartment. The suspension of broken cells was centrifuged (4°C, 6 min, 4,000×g) to remove the unbroken cells/cell debris and remaining glass beads. The thylakoids were obtained by centrifuging the supernatant at 4°C for 15 min at 30,000×g. The pellet was resuspended in buffer A or buffer A supplemented with 0.5 M of sorbitol and used immediately or stored at −80°C until use. To check the photosynthetic activity of membranes, Fv/Fm was measured using an AquaPen AP-C 100 fluorometer (PSI, Brno, Czech Republic).
PSI from T. vulcanus was isolated following the protocol of Fromme and Witt (1998). PSII core complexes were isolated from T. vulcanus as described earlier (Shen and Kamiya 2000, Kawakami and Shen 2018).
Liposomes were prepared with a plant thylakoid lipid mixture of 45% (w/v) monogalactosyldiacylglycerol, 30.0% digalactosyldiacylglycerol, 15% phosphatidylglycerol and 10% sulfoquinovosyldiacylglycerol. The organic solvent (chloroform:methanol) from the lipid mixture was slowly dried in a vacuum rotatory evaporator to form a thin film of lipids on the wall of a round-bottom glass vial. After completely drying the solvent, the lipid film was hydrated with a total lipid concentration of 5 mg ml−1. The suspension was vortexed for approximately 40–50 min and subsequently subjected to 10 freeze–thaw cycles. Large unilamellar vesicles were formed by extruding the suspension through a 100-nm pore membrane (Mini-Extruder, Avanti Polar Lipids, Birmingham, UK). The liposomes were then destabilized by adding 0.05% detergent β-DDM prior to the addition of the isolated complexes.
For preparing PSI:PSII membranes, purified solubilized trimeric PSI complexes and PSII core complexes were mixed at a PSI:PSII molar ratio of 1.5:1 (on a monomer basis). The complexes were incorporated into the preformed liposomes at a Chl:lipid ratio of 5:1. The protein suspension was added dropwise to the liposome suspension while agitating continuously. The mixture was then incubated at room temperature for 15–20 min in the dark. The detergent was removed by repetitive incubation of the sample with absorbent beads (Bio-Beads SM2, Bio-Rad, Hercules, CA, USA). PSI- and PSII-only membranes were prepared in the same way. Assuming 96 Chls per PSI and 36 Chls per PSII, the lipid:protein molar ratios were 480:1, 180:1 and 360:1 for PSI, PSII and PSI:PSII membranes, respectively.
For spectroscopy measurements, all samples were diluted in buffer medium without detergent (control) or were solubilized by incubating in medium with 0.01% or 0.03% β-DDM (as indicated) for 1 h and then centrifuged for 5 min at 10,000×g.
Pigment analysis
Chls were extracted from the cell suspensions in 90% methanol and the Chl contents were determined spectrophotometrically using molar absorption coefficients described in Lichtenthaler (1987).
Quantification of PSI and PSII
The PSI and PSII concentrations were determined spectrophotometrically using the previously established protocol (Akhtar et al. 2022). The P700 was first oxidized with 1 mM potassium ferricyanide and then reduced with sodium ascorbate. P700 abundance was estimated from the absorption difference spectra (690–720 nm) between oxidized and reduced P700 with a molar extinct coefficient Δεox-red = 64 mM−1 cm−1 at 700 nm. For PSII determination, first all cytochromes were oxidized with 1 mM of potassium ferricyanide, followed by reduction with hydroquinone, sodium ascorbate and sodium dithionite. PSII abundance was determined from the difference spectra (520–580 nm) between hydroquinone- and ascorbate-reduced thylakoid membranes.
Steady-state absorption and fluorescence spectroscopy
Absorption spectra in the range of 350–750 nm were recorded at room temperature with a Thermo Evolution 500 dual-beam spectrophotometer. The measurements were performed in a standard glass cell of 1 cm optical path length with 1 nm spectral bandwidth.
FES in the visible range were measured from the same samples at room temperature and 77 K on an FP-8500 (JASCO, Tokyo, Japan) spectrofluorometer. The samples were diluted to an absorbance of 0.1 per cm at the red maximum. Emission spectra in the range of 600–800 nm were recorded with an excitation wavelength of 440 nm and an excitation/emission bandwidth of 2.5 nm (unless specified otherwise). The measurements were performed with a 1-nm increment and a 1- and 4-s integration time at room temperature and 77 K, respectively. For 77-K measurements, samples were cooled in a home-built accessory used with the FP-8500 spectrofluorometer. The spectra are corrected for the spectral sensitivity of the instrument.
Time-resolved fluorescence spectroscopy
Picosecond time-resolved fluorescence measurements were performed with a time-correlated single-photon counting instrument (FluoTime 200/PicoHarp 300 spectrometer, PicoQuant, Berlin, Germany). Excitation was provided by Fianium WhiteLase micro (NKT Photonics, Southampton, UK) supercontinuum laser, generating white-light pulses with a repetition rate of 20 MHz. The fluorescence decays were recorded at wavelengths of 664–760 nm with 8-nm steps, at room temperature with 440-nm excitation selected using a bandpass filter. Samples, diluted to an absorbance of 0.03 at the excitation wavelength, were placed in a 1-mm flow cell and circulated at a flow rate of 4 ml min−1. In addition, the buffer medium of the thylakoid and reconstituted membranes was supplemented with 25 µM dichlorophenolindophenol and 0.5 mM potassium ferricyanide.
The total instrument response function (IRF) measured using 1% Ludox as scattering solution has a width of 40 ps (FWHM). Global multiexponential lifetime analysis with IRF reconvolution was performed using MATLAB, whereby the decay lifetimes and wavelength-dependent IRF time shifts were determined by non-linear least-squares minimization of the squared sum of the Poisson-weighted residuals. The pre-exponential amplitudes were obtained by linear least-squares fit.
Supplementary Data
Supplementary Data are available at PCP online.
Data Availability
The generated datasets for this study can be provided by the corresponding authors upon request.
Funding
National Research, Development and Innovation Fund (NKFI FK-139067 to P.A., ANN-144012 to P.H.L., 2018-1.2.1-NKP-2018-00009 to P.H.L.); Hungarian Research Network (SA-176/2021 to P.A.); National Key R&D Program of China (2022YFA0911900, 2022YFC1803400); Chinese Academy of Sciences Project for Young Scientists in Basic Research (YSBR-004); a Strategic Priority Research Program of the Chinese Academy of Sciences (XDA26050402).
Disclosures
The authors have no conflicts of interest to declare.
