


Abstract
We observed the first-ever recorded outburst of PM J03338+3320, the cataclysmic variable selected by proper-motion survey. The outburst was composed of a precursor and the main superoutburst. The precursor outburst occurred at least 5 d before the maximum of the main superoutburst. Despite this separation, long-period superhumps were continuously seen between the precursor and main superoutburst. The period of these superhumps is longer than its orbital period by 6.0(1)% and can be interpreted to reflect the dynamical precession rate at the 3 : 1 resonance for a mass ratio of 0.172(4). These superhumps smoothly evolved into those in the main superoutburst. These observations provide the clearest evidence that the 3 : 1 resonance is triggered by the precursor outburst, even if it is well separated, and the resonance eventually causes the main superoutburst as predicted by the thermaltidal instability model. The presence of superhumps well before the superoutburst cannot be explained by alternative models (the enhanced mass-transfer model and the pure thermal instability one) and the present observations clearly support the thermaltidal instability model.
1 Introduction
Cataclysmic variables (CVs) are composed of a white dwarf and a mass-transferring red (or brown) dwarf filling the Roche lobe. The transferred matter forms an accretion disk. Dwarf novae are a class of CVs characterized by outbursts. SU UMa-type dwarf novae are a subclass of dwarf novae characterized by the presence of superhumps and superoutbursts. Superoutbursts are ∼0.5–1.0 mag brighter than normal outbursts and are accompanied by superhumps, which have a period (superhump period: PSH) a few percent longer than the orbital period (Porb). For general information on CVs, DNe, SU UMa-type dwarf novae, and superhumps, see, e.g., Warner (1995) and Hellier (2001).
Although there had been a long debate regarding the origin of superoutbursts and superhumps, it is now widely believed that superhumps are a result of the eccentric (or flexing) deformation of the accretion disk caused by the 3 : 1 resonance (Whitehurst 1988; Hirose & Osaki 1990; Lubow 1991a, 1991b). Osaki (1989) proposed a model [the thermal-tidal instability (TTI) model] to explain the occurrence of a superoutburst after a sequence of normal outbursts when the disk radius reaches the 3 : 1 resonance. Osaki and Meyer (2003) refined this TTI model to explain various types of superoutbursts. In some systems [usually with a lower mass-transfer rate (|$\dot{M}$|)], the mass stored in the disk is sufficient to trigger a superoutburst without experiencing normal outbursts. The extreme cases are WZ Sge-type dwarf novae—see Kato (2015) for a modern review. This TTI model predicted the systematic variation of the disk radius over successive outbursts and superoutbursts. This prediction was finally confirmed in Kepler observations, which have so far led to the strongest support for the TTI model (Osaki & Kato 2013a).
On the other hand, it has been demonstrated that periods of superhumps systematically vary (Kato et al. 2009): stage A superhumps (long, constant superhump period), stage B superhumps (short superhump period with
systematic period variation), and stage C superhumps (constant period shorter than those of stage B superhumps typically by 0.5%). The superhump period reflects the precession rate of the eccentric disk, which is mainly a combination of prograde dynamical precession by the gravitational field of the secondary and the retrograde precession by the pressure gradient in the disk (e.g., Lubow 1992). It has been proposed that stage A superhumps correspond to the growing phase of the 3 : 1 resonance (Osaki & Kato 2013b; Kato & Osaki 2013) and the superhump period in this stage reflects the dynamical precession rate at the 3 : 1 resonance. This expectation was successfully used to determine mass ratios (q) in many systems (Kato & Osaki 2013).
In the standard TTI model, superoutbursts are triggered by a normal outburst during which the disk radius reaches that of the 3 : 1 resonance. In actual SU UMa-type dwarf novae, there is diversity in how superoutbursts start (cf. Marino & Walker 1979). In some cases, there are superoutbursts preceded by widely separated precursor outbursts. Although the TTI model predicts that the 3 : 1 resonance (and resultant superhumps) starts to grow during the preceding precursor or sometime after the precursor, observational clues for this interpretation have been limited since it is difficult to make high-quality time-resolved photometry before superoutbursts start. The only exception has been continuous observations by the Kepler satellite (Borucki et al. 2010; Koch et al. 2010). Kepler recorded a deep dip between the precursor outburst and the main superoutburst in V1504 Cyg. Although a frequency analysis by Osaki and Kato (2014) strongly favored the interpretation of the TTI model, the case of V1504 Cyg was not ideal in that the precursor outburst was not sufficiently separated and that the superhump signal was not continuously present. Here we report on an ideal case to test this interpretation: the 2015 superoutburst of PM J03338+3320.
2 PM J03338+3320
PM J03338+3320 is a CV selected by its high proper motion (Skinner et al. 2014).1 Skinner, Thorstensen, and Lépine (2014) indicated that PM J03338+3320 has doubly peaked emission lines of hydrogen and He i superimposed on a blue continuum. The spectrum was typical for a dwarf nova in quiescence. Skinner, Thorstensen, and Lépine (2014) also obtained an orbital period of 0.06663(7) d by a radial-velocity study. The period was suggestive of an SU UMa-type dwarf nova.
On 2015 November 28, E. Muyllaert detected the first-ever outburst at an unfiltered CCD magnitude of 14.58 (cvnet-outburst 6781). Although subsequent observations detected superhumplike modulations (vsnet-alert 19303), the object rapidly faded. Although there was some suspicion of a normal outburst, the long period compared to the known orbital period strongly suggested that these modulations were superhumps. The object stayed around 17 mag for three nights and it continuously showed these long-period superhumps (vsnet-alert 19310). The object eventually entered the main superoutburst on December 2–3.
3 Observation and analysis
The data were obtained under campaigns led by the VSNET Collaboration (Kato et al. 2004). We also used the public data from the AAVSO International Database.2
Time-resolved observations were performed in 15 different locations by using 30 cm-class telescopes (supplementary table 1). The data analysis was performed in the same way as described in Kato et al. (2009, 2014), and we mainly used R software3 for data analysis. In de-trending the data, we divided the data into four segments in relation to the outburst phase and used locally weighted polynomial regression (LOWESS: Cleveland 1979). The times of superhump maxima were determined by the template-fitting method as described in Kato et al. (2009). The times of all observations are expressed in barycentric Julian dates (BJD).
We used phase dispersion minimization (PDM: Stellingwerf 1978) for period analysis and 1 σ errors for the PDM analysis were estimated by the methods of Fernie (1989) and Kato et al. (2010).
4 Results
4.1 Outburst light curve
As shown in the upper panel of figure 1 , this object showed a separate precursor outburst which occurred at least 5 d before the peak of the main superoutburst. The main superoutburst lasted for ∼7 d. Between the precursor and the main superoutburst, the object stayed at ∼16.8, ∼0.5 mag brighter than in quiescence. There was at least one post-superoutburst rebrightening on BJD 2457374–2457375, 7 d after the rapid fading. The object was also caught during the fading part of another outburst on BJD 2457400 (E. de Miguel). It was not certain whether this outburst was the second rebrightening or the first normal outburst of the next supercycle.
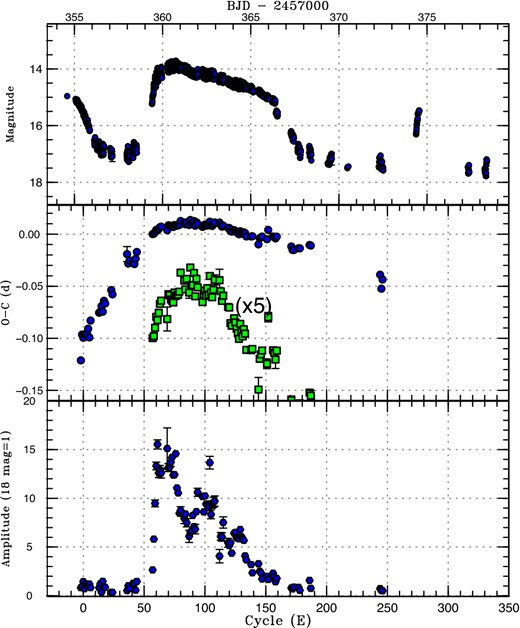
O − C diagram of superhumps in PM J03338+3320 (2015). (Upper) Light curve. The data were binned to 0.0069 d. There was at least one post-superoutburst rebrightening on BJD 2457374–2457375. (Middle) O − C diagram (filled circles). We used a period of 0.0690 d for calculating the O − C residuals. Filled squares are enlarged by five times in the O − C values and shifted arbitrarily to better visualize the stage transitions. (Lower) Amplitudes of superhumps. The scale is linear and the pulsed flux is shown in units corresponding to 18 mag = 1. (Color online)
4.2 Superhumps
Superhumps were continuously detected already during the fading branch of the precursor outburst (figure 2). The superhumps before the rise to the main superoutburst had a long period [0.07066(1) d on average; figure 3; supplementary table 2]. As shown in the O − C diagram in figure 1, these superhumps showed no period variation. They smoothly evolved into superhumps during the main superoutburst. The period became slightly shorter when the object reached a maximum of the superoutburst (around E = 60–65 in figure 1). Superhumps following this phase had a shorter, relatively constant period of 0.06902(2) d between E = 70 and E = 115 in figure 1. The period then was shortened to another constant one of 0.06876(3) d (figure 4, mean profile after E = 70 in figure 1; supplementary table 3). These superhumps persisted at least before the rebrightening. We identified these three stages as stage A, B, and C as introduced in Kato et al. (2009). The most striking feature is the continuous presence of stage A superhumps between the separate precursor and the main superoutburst. The apparent lack of a phase jump in stage C superhumps when the superoutburst terminated is also worth mentioning.
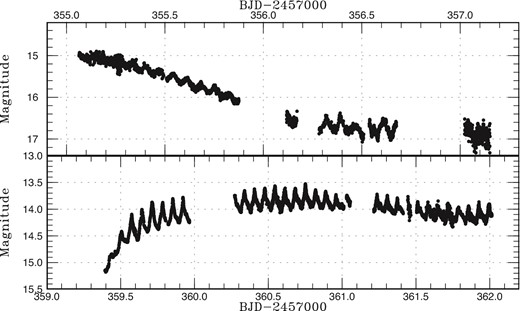
Superhumps in PM J03338+3320 (2015). (Upper) Fading part of the precursor. (Lower) Initial part of the main superoutburst.
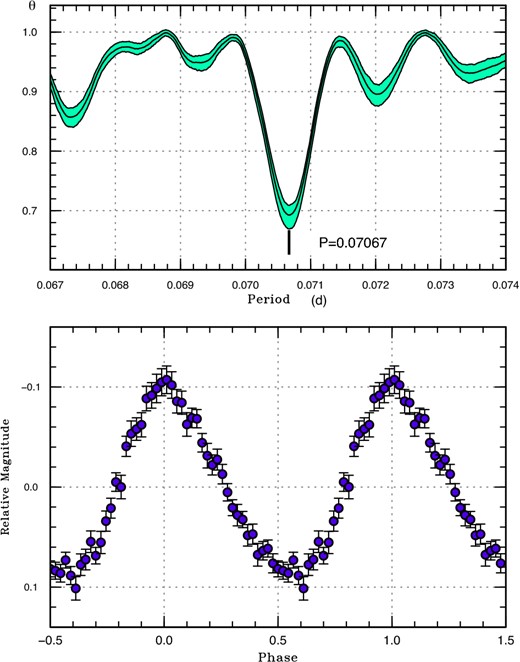
Superhumps in PM J03338+3320 (2015) from the precursor to the main superoutburst. The data before BJD 2457360 were used. (Upper) PDM analysis. (Lower) Phase-averaged profile. (Color online)
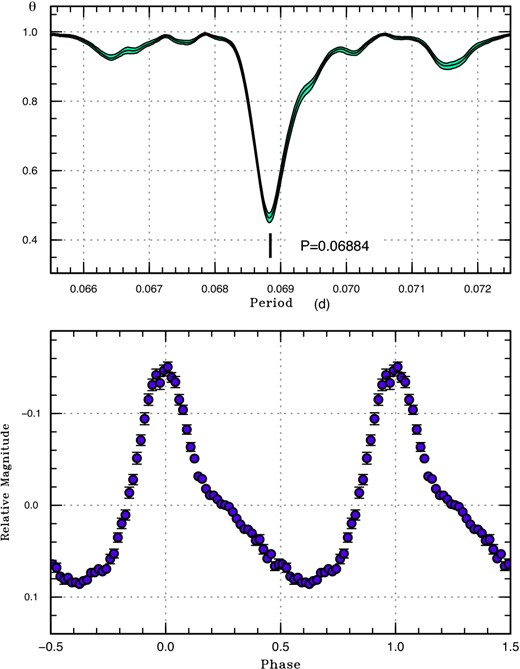
Superhumps in PM J03338+3320 (2015) during the main superoutburst after transition to stage B superhumps. The data after BJD 2457360 were used. (Upper) PDM analysis. (Lower) Phase-averaged profile. (Color online)
There are likely to be modulations of the superhump amplitudes with a period of ∼30 cycles (see lower panel of figure 1). This is most likely a beat phenomenon between the orbital period and the superhump period (the expected beat period is 2.15 d = 31 cycles). The presence of the beat phenomenon is also consistent with the likely high inclination inferred from doubly peaked emission lines in spectroscopy.
5 Discussion
5.1 Separate precursor and stage A superhumps
It has been known that there is a continuous sequence of precursor–main superoutburst in VW Hyi (Marino & Walker 1979). As discussed in subsection 2.2 in Osaki and Kato (2014), this phenomenon can be understood in the framework of the TTI model that the 3 : 1 resonance is reached during the precursor outburst, and superhumps start to grow, finally triggering the main superoutburst. In the case of Kepler data in V1504 Cyg, a frequency analysis has shown that long-period growing superhumps (stage A superhumps) were indeed present between the precursor outburst and the main superoutburst (Osaki & Kato 2014). However, the superhump waves were rather irregular in shape and the signal almost disappeared during the rising branch to the main superoutburst (see figure 5 in Osaki & Kato 2014). This made it impossible to make an O − C analysis to see whether or not the superhumps between the precursor outburst and the main superoutburst have properties being continuous with those recorded during the main superoutburst.
The present case of PM J03338+3320 provides an ideal opportunity to study the properties of the superhumps between the precursor outburst and the main superoutburst: the superhump signals were strong and regular and we could measure individual maxima. The result (middle panel of figure 1) clearly indicates that the superhumps had the same period and phase as those of the precursor until the peak of the main superoutburst. We can now safely say that stage A superhumps were persistently present following the precursor outburst and smoothly evolved into stage B superhumps during the main superoutburst. The present case is more extreme than in V1504 Cyg case where the precursor is more isolated from the main superoutburst. This finding provides strong support for the TTI model.
The striking finding is the constancy of the period during and after the precursor outburst despite the greatly decreasing brightness of the system. As discussed in Kato and Osaki (2013), the fractional superhump excess in frequency ϵ* = 1 − (Porb/PSH) has a functional form of ϵ* = Q(q)R(r), where r is the disk radius, when the pressure effect can be neglected. When the system is faint (as in the faint state between the precursor outburst and the main superoutburst), we can safely neglect the pressure effect and ϵ* can be used to estimate the change of the radius (cf. Osaki & Kato 2014). The measured ϵ* for superhumps between the precursor outburst and the main superoutburst was large and constant and the disk radius needs to be constant. We consider that this radius represents the radius of the eccentric part of the disk. As shown in subsection 5.2, this radius is compatible with that of the 3 : 1 resonance assuming a reasonable q for the orbital period. We now have evidence that the eccentric disk at the 3 : 1 resonance is continuously present between the precursor outburst and the main superoutburst, which has been supposed, but has not been sufficiently verified yet, in the TTI model.
5.2 Mass ratio from stage A superhumps
Kato and Osaki (2013) proposed a method to determine q from ϵ* for stage A superhumps. In the present case, the observed ϵ* = 0.0604(13) corresponds to q = 0.172(4). This value is somewhat large for a Porb = 0.06663 d object (cf. in figure 4 Kato & Osaki 2013). This largely estimated q safely excludes the possibility that the radius where stage A superhumps arose was somewhere inside the 3 : 1 resonance—if the radius is smaller, it requires an even more unlikely larger q for this Porb.
5.3 Difference from V1504 Cyg
In the case of Kepler data for V1504 Cyg, although frequency analysis detected stage A superhumps between the precursor and the main superoutburst, individual hump profiles were rather complex and we could not sufficiently measure individual maxima. The profiles in PM J03338+3320 were, however, much clearer and we could measure the times of all observed superhumps in the same outburst phase. The difference may be due to the difference in the mass-transfer rate. In the case of V1504 Cyg, the frequent normal outbursts and short supercycle (cf. Osaki & Kato 2013a, 2013b, 2014) suggests a high mass-transfer rate. In contrast, PM J03338+3320 apparently has much more infrequent outbursts. Indeed, no outbursts were recorded in observations on 90 different nights spanning BJD 2453642–2456593 in the CRTS data (Drake et al. 2009). In the case of V1504 Cyg, the strong mass-accretion flow may have masked low-amplitude stage A superhumps before the main superoutburst by the resulting strong flickering. Although the stage A superhump method is expected to work for determination of the mass ratio when superhumps start to evolve before the main superoutburst (as in the present case), the best application may be sought for low-|$\dot{M}$| objects. This interpretation needs to be confirmed by further observations of different objects.
5.4 Growth time of stage A superhumps
Kato (2015) suggested that the growth time of stage A superhumps in WZ Sge-type dwarf novae can be a good measure of the growth of the 3 : 1 resonance, which is theoretically expected to be proportional to q2 (Lubow 1991a, 1991b). In WZ Sge-type dwarf novae, q = 0.06 roughly corresponds to the growth time of 60 cycles, and the time is usually much shorter in ordinary SU UMa-type dwarf novae. Kato et al. (2016) claimed that high-q systems close to the stability limit of the 3 : 1 resonance also show slow growth of superhumps, requiring a time comparable to WZ Sge-type dwarf novae. The present case of PM J03338+3320 required at least 60 cycles, which is comparable to low-q WZ Sge-type dwarf novae. Since PM J03338+3320 does not have a high q close to the stability limit, this long growth time requires another explanation. The main difference of PM J03338+3320 from WZ Sge-type dwarf novae and other SU UMa-type dwarf novae is the widely separate precursor outburst. Stage A superhumps showed little tendency to grow in amplitude during their phase (lower panel of figure 1), and it is likely that stage A superhumps grow slowly near the quiescent state. Since the growth of stage A superhumps, and finally the spread into the entire disk, would require viscous spread of the eccentric region, it may be that the low-viscosity state near quiescence requires more time than in the outbursting disk as in WZ Sge-type dwarf novae and SU UMa-type dwarf novae without separate precursor outbursts. This means that the duration of stage A would not be a good measure of q in systems with separate precursor outbursts. This would, in turn, explain the diversity in the intervals between the precursor outburst and the main superoutburst (ranging from almost continuous transition to intervals as long as 10 d in QZ Vir (1998, Ohshima et al. 2011) and 11 d in V699 Oph (2001, Kato et al. 2009; see Osaki & Kato 2014) since the growth time of stage A superhumps is not a unique function of q near the quiescent state.
5.5 Cases of enhanced mass-transfer and pure thermal instability models
Up to this subsection, we considered the TTI model to interpret the observations. As reviewed in Osaki and Kato (2013a), there are currently three models to explain superoutbursts and supercycles. In addition to the TTI model, there are the enhanced mass-transfer (EMT) model advocated by Smak (Smak 1991, 2004, 2008), and the pure thermal instability model by Cannizzo in its original form (Cannizzo et al. 2010, 2012).
In the present case, superhumps appeared well before the main superoutburst, which excludes the EMT model as already discussed in Osaki and Kato (2013a). We consider here if the present observations can be explained by the pure thermal instability model. As reviewed in Osaki and Kato (2013a), this model claims normal outbursts and superoutbursts are equivalent to “narrow” and “wide” outbursts seen in SS Cyg-type dwarf novae and that superhumps are excited as the result of the expansion of the disk during wide outbursts. In this model, the heating wave from the inner part of the disk is reflected before reaching the outer edge of the disk in normal outbursts—see figures 3 and 4 in Cannizzo et al. (2010); this type of outburst corresponds to type “Bb” in the classification in Smak (1984). Only in superoutbursts does the heating wave reach the outer edge. In the pure thermal instability model, precursor outbursts (or shoulders) are formed since the speed of the heating wave becomes slower when it passes through the disk mass which has been accumulated during the repeated cycles of normal outbursts preceding the superoutburst. During such precursors, the heating wave should not be reflected since such reflection will quench the outburst (see subsection 3.2 in Osaki & Kato 2013a). There should not be a deep dip between the precursor (shoulder) and the peak of the main superoutburst (see also subsection 2.2 in Osaki & Kato 2014). Its natural consequence is that it is impossible to reproduce a separate precursor as seen in the present observations. Another difficulty in the pure thermal instability model is that the disk does not expand during normal outbursts or during the precursor (shoulder) phase, since the heating wave does not reach the outer edge of the disk. In this model, the disk cannot reach the 3 : 1 resonance before the heating wave reaches close to the outer edge, i.e., around the peak of the superoutburst. The presence of long-period superhumps well before the superoutburst, which is the direct consequence of the disk reaching the 3 : 1 resonance, cannot be explained by the pure thermal instability model, and the TTI model is the only model that can explain the present observations.
In this subsection, we used “in its original form” for the pure thermal instability model by Cannizzo. This was because Cannizzo (2015) recently introduced a pure thermal instability model allowing the radius variation of the disk, and claimed that the model could reproduce the SU UMa-type supercycle. Although this model appears to have successfully reproduced the presence of a precursor outburst, the reason why such a precursor was made possible is unclear because this paper is a conference proceeding and no details of the model were given. It would be better for a full article on this model to appear to make a fair comparison between the TTI model and this new extension of the pure thermal instability model, and we restrict our discussion to the original pure thermal instability model. We can, however, point out that the model in Cannizzo (2015) would predict a constant disk radius during the superoutburst (as in figure 2 in Cannizzo 2015) which contradicts observations, such as the decrease in the disk radius measured in eclipsing systems (see, e.g., figure 10 in Osaki & Kato 2014) and the systematic decrease in the superhump period (i.e., precession rates) between superhump stages B and C.
6 Summary
We observed the 2015 superoutburst of PM J03338+3320. The superoutburst was preceded by a separate precursor outburst which occurred at least 5 d before the maximum of the main superoutburst. Superhumps were continuously present during the fading branch of the precursor and persisted until the rise to the main superoutburst. The O − C analysis has shown that these superhumps (stage A superhumps) have continuous phases and a constant period all the time before the maximum of the main superoutburst. The period was very long, 0.07066(1) d, 6.0(1)% longer than the orbital period, and can be interpreted to reflect the dynamical precession rate at the 3 : 1 resonance for a mass ratio of 0.172(4). This result provides the clearest evidence that the 3 : 1 resonance starts to operate around the precursor outburst, even if it is well separated, and this resonance eventually results in the main superoutburst as predicted by the thermaltidal instability model. These superhumps took a long time (more than 60 cycles) to evolve, suggesting that stage A superhumps persist for a longer time (or take a longer time to fully evolve) when the system is near quiescence than in the outburst state. This could explain a wide variety of intervals between the precursor and the main superoutburst. The presence of superhumps well before the superoutburst cannot be explained by alternative models (the enhanced mass-transfer model and the pure thermal instability model) and the present observations provide strong support for the thermaltidal instability model.
This work was supported by a Grant-in-Aid “Initiative for High-Dimensional Data-Driven Science through Deepening of Sparse Modeling” (25120007) from the Ministry of Education, Culture, Sports, Science and Technology (MEXT) of Japan. We acknowledge with thanks the variable star observations from the AAVSO International Database contributed by observers worldwide and used in this research. The authors are grateful to observers of the VSNET Collaboration and VSOLJ observers who supplied vital data. We are grateful to the anonymous referee for drawing our attention to the pure thermal instability model, and Professor Yoji Osaki for helpful comments. This work was also partially supported by RFBR grants 15-32-50920, 15-02-06178, and 14-02-00825, and by VEGA grant No. 2/0002/13.
Supporting information
Additional supporting information can be found in the online version of this article:
Supplementary tables 1, 2, and 3.
Although the name PM I03338+3320 was used in Skinner, Thorstensen, and Lépine (2014), we use the name used in SIMBAD, conforming to the nomenclature convention of the International Astronomical Union. The acronym LSPM was also used in Skinner, Thorstensen, and Lépine (2011), and the name LSPM J03338+3320 was used in VSNET reports.
The R Foundation for Statistical Computing 〈http://cran.r-project.org/〉.
References
