


Abstract
Retinoblastoma is the most common intraocular malignant tumor occurring among children, with an incidence rate of 1/15 000. This study built a joinpoint regression model to assess the incidence trend of retinoblastoma from 2004 to 2015 and constructed a nomogram to predict the overall survival (OS) in children.
Patients less than 19 years diagnosed with retinoblastoma from 2004 to 2015 were selected from the SEER database. Joinpoint regression analysis (version 4.9.0.0) was performed to evaluate the trends in retinoblastoma incidence rates from 2004 to 2015. Cox Regression Analysis was applied to investigate prognostic risk factors that influence OS.
Joinpoint regression revealed that retinoblastoma incidence exhibited no significant increase or decrease from 2004 to 2015. As per the multiple Cox regression, tumor size, laterality, and residence (rural-urban continuum code) were correlated with OS and were used to construct a nomogram. The nomogram exhibited a good C-index of 0.71 (95% CI, 0.63 to 0.79), and the calibration curve for survival probability demonstrated that the predictions corresponded well with actual observations.
A prognostic nomogram integrating the risk factors for retinoblastoma was constructed to provide comparatively accurate individual survival predictions. If validated, this type of assessment could be used to guide therapy in patients with retinoblastoma.
This nomogram could be used as a predictive model integrating potential risk factors affecting overall survival (OS). Tumor size was the largest contributing factor and the most significant predictor of OS. Three other significant predictors of OS were laterality, year at the time of diagnosis, and Rural-Urban Continuum Codes, a classification scheme that classifies metropolitan (metro) and nonmetropolitan (nonmetro) counties.
Introduction
Retinoblastoma accounts for 3% of all childhood tumors and originates from primitive neuroendocrine tissues. This cancer is the most commonly diagnosed intraocular malignancy among pediatric cancers.1,2 Children with retinoblastoma exhibit strabismus3 and defects in vision.3 Retinoblastoma is induced through biallelic loss-of-function mutations in the RB1 gene, (a tumor suppressor gene),3 which result in the deregulation of the retinoblast cell cycle and foster uncontrolled proliferation due to the failure of differentiation into intraretinal photoreceptor and nerve cells.4 Early detection can improve the prognosis of retinoblastoma; early diagnosis and disease management are critical for choosing a suitable therapeutic regimen.5-7 Therapeutic modalities for retinoblastoma have typically focused on minimizing morbidity and mortality.5
Ultrasound scanning and magnetic resonance imaging (MRI) are the most significant diagnostic strategies for retinoblastoma. Enucleation, external beam radiation, radioactive plaque, cryotherapy, photocoagulation, and chemotherapy are strategies currently implemented to treat retinoblastoma.8,9 Treatment failures result in extraocular tumor metastases and subsequently reduce overall survival (OS).10,11 Laterality is another risk factor that could determine the mortality of retinoblastoma patients. Laterality and T-stage exhibit significant influence on the OS of patients with retinoblastoma.12
Joinpoint, a software developed by the National Cancer Institute (NCI), can analyze the incidence trend of retinoblastoma by dividing the study time into different intervals through several joinpoints and performing trend fitting and optimization for each interval. It can evaluate disease change characteristics specific to different intervals in the global time range in more detail.
Subsequently, this test can evaluate the trends in retinoblastoma incidence rates by calculating the annual percent change (APC: used to evaluate the internal trend of each independent interval or the global trend with 0 connection points) and average annual percent change (AAPC: used to evaluate global average trends across multiple intervals).13-15 A nomogram is a practical tool capable of predicting OS by integrating potential risk factors and is widely used for cancer prognosis precisely due to its ability to simplify statistical predictive models into a single numerical estimate of probability.16,17 Therefore, we constructed a joinpoint regression to assess the incidence trend over time and built a nomogram to predict the OS of retinoblastoma.
Methods
Patients and Selection Criteria
The SEER program is a population-based cancer registry that allows the analysis of data from 18 registries obtained from 14 states in the US, representing approximately 30% of the total US population. A total of 1466 patients diagnosed with retinoblastoma during the period from 2004 to 2015 were selected from the SEER database. Patients with missing data relating to unknown race (n = 21), unknown Rural-Urban Continuum Code (n = 1), and blank tumor size (n = 521), were excluded. The variables used for further analysis acquired from the SEER database were as follows: race, age, sex, tumor size, histologic type, and laterality, year of diagnosis, residence depending on Rural-Urban Continuum Codes, and household income.
Variables Definition
SEER* Stat classified race into 3 categories as White, Black, and Other (American Indian/AK Native, Asian/Pacific Islander). Tumor sizes were analyzed by X-Tile (version 3.6.1) and obtained the appropriate cutpoints. Hence, tumor size was classified into 3 categories: <16 mm, ≥16 mm, and unknown. The year at diagnosis was divided into 3 phases, including 2004-2007, 2008-2011, and 2012-2015. As there is no significant difference between the right and left side, laterality was divided into 2 categories, bilateral and unilateral, the latter including both left and right-sided tumors. The histologic types of retinoblastomas were categorized as follows: NOS (not otherwise specified), differentiated, undifferentiated, and diffuse types. Household income was adjusted for inflation to 2019. Income was classified into 3 levels: “low income (less than $54,999),” “middle income ($55,000 - $69,999),” and “high income (greater than $70,000).” The patient residence was divided according to the information given by the Rural-Urban Continuum Codes as urban, urban-rural fringe zone, and rural. Gender was categorized as male and female. Age at the time of diagnosis was classified into 3 groups, <1 year old, 1-4 years old, and 5-19 years old, respectively (Supplementary Material Sl-1, S2).
Statistical Analysis
The age-adjusted rate expressed as retinoblastoma cases per 1 000 000 person-years and standard error (SE) were calculated by SEER*Stat software. The age-adjusted rate was defined as a weighted average of crude rates, where the crude rates were calculated for different age groups, and the weights were the proportions of persons in the corresponding age groups of a standard population. Furthermore, we analyzed the incidence of retinoblastoma based on gender, race, and the above other variables. Then, the joinpoint regression program (version 4.9.0.0) was used to analyze incidence trends from the year 2004 to 2015.
SPSS software was used to analyze survival probability for the risk factors. Cox regression analysis was conducted to ascertain the effect of a factor on survival and to determine whether this effect was the same at all times during the study period. Therefore, a time-dependent Cox regression analysis was performed, which demonstrated that these factors exhibited typically no strong correlation with time (T_COV_> 0.5). Then, a Cox proportional hazards model was applied to estimate statistical significance. As retinoblastoma is a rare disease, the sample size was insufficient, and the estimated mortality rate was 3.7%. Only 37 patients known to have died were available in the database. Variables with P < .2 in univariate Cox regression analysis were selected and subsequently included in the multivariate Cox regression analysis to identify independent predictors of OS. Finally, the variables with P < .05 in multivariate analysis were included in the nomogram to predict OS, and Harrell’s concordance index (C-index) was used to measure the discrimination ability of the prediction model. Data extraction was performed using the SEER*Stat software version 8.3.9. Data analysis was performed by SPSS version 21.0 for Windows (SPSS Inc., Chicago, IL, USA) and R software version 4.1.0. Thus, sufficient discrimination and calibration were performed to validate the prognostic accuracy of the nomogram model. Discrimination was ascertained using C-index, and a C-index close to 1 indicates that the particular nomogram model exhibits a strong predictive ability.
Results
Patient Demographics
In this study, we queried Incidence-SEER Research Data, 9 Registries, and obtained patient data from the years 1975 to 2018 (November 2020 Submission). We identified 1466 individuals using site and morphology records. Patients without suitable information related to prognosis (n = 543) were eliminated from the analysis, as described in the methods, leaving 923 patients for analysis. The majority of included patients were of White race (75.1%), living in urban environments (90.5%), and found to have unilateral eye disease (68.9%). A large tumor size (≥16 mm) accounted for 25.5%, whereas a smaller tumor size (≤16 mm) accounted for 34.7% and the remaining had unknown size (39.8%). Statistics pertinent to all the patients’ demographics and tumor characteristics were included in Table 1.
Demographic and clinicopathologic characteristics, and overall survival of patients with retinoblastoma.
| Characteristics | Patients [N (%)] | Deaths [N (%)] | Overall survival rate (%) | P-value | |
|---|---|---|---|---|---|
| 5-year | 10-year | ||||
| All patients | 923 | 37 | 96 | 95 | |
| Sex | .355 | ||||
| Male | 457 (49.5) | 21 (56.7) | 95 | 94 | |
| Female | 466 (50.5) | 16 (70.3) | 97 | 96 | |
| Ethnicity | .453 | ||||
| White | 694 (75.1) | 27 (72.9) | 96 | 95 | |
| Black | 132 (14.3) | 10 (27.1) | 94 | 91 | |
| Others | 97 (10.6) | 0 | 100 | 100 | |
| Age (years) | .447 | ||||
| 0 | 400 (43.3) | 13 (35.1) | 98 | 95 | |
| 1-4 | 487 (52.8) | 23 (62.2) | 95 | 95 | |
| 5-19 | 36 (3.9) | 1 (2.7) | 97 | 97 | |
| Histologic type | .277 | ||||
| NOS | 814 (88.1) | 35 (94.6) | 96 | 94 | |
| Undifferentiated | 78 (8.5) | 1 (2.7) | 99 | 99 | |
| Differentiated | 25 (2.7) | 1 (2.7) | 99 | 99 | |
| Diffuse | 6 (0.7) | 0 | 100 | 100 | |
| Laterality | .058 | ||||
| Unilateral | 636 (68.9) | 20 (54.1) | 97 | 96 | |
| Bilateral | 287 (31.1) | 17 (45.9) | 94 | 92 | |
| Rural-urban | .026 | ||||
| Urban | 836 (90.5) | 30 (81.1) | 97 | 95 | |
| Rural-urban | 44 (4.8) | 3 (8.1) | 93 | 93 | |
| Rural | 43 (4.7) | 4 (10.8) | 89 | 89 | |
| Size | .004 | ||||
| <16 mm | 320 (34.7) | 10 (27.1) | 97 | 97 | |
| ≥16 mm | 235 (25.5) | 18 (48.6) | 93 | 90 | |
| Unknown | 368 (39.8) | 9 (24.3) | 98 | 96 | |
| Year of diagnosis | .085 | ||||
| 2004-2007 | 314 (34.0) | 8 (21.6) | 98 | 97 | |
| 2008-2011 | 299 (32.4) | 18 (48.6) | 94 | 93 | |
| 2012-2015 | 310 (33.6) | 11 (29.7) | 96 | 92 | |
Rural-urban indicates: Rural-urban fringe zone.
Incidence Trends
Using joinpoint analysis, there was neither a significant trend in the age-adjusted incidence for all genders during the period from 2004 to 2018, nor a significant variation of incidence between races. Incidence trends of retinoblastoma declined during the period from 2004 to 2018 among the male population with an APC of 1.90% (95% CI, 4.4% to 0.7%, P < .1) (Supplementary Fig. S1A), whereas this incidence trend increased among the female population with an APC of 1.84% (95% CI, -0.6% to 4.4%, P < .1) (Supplementary Fig. 1B).
Overall Survival
The survival period of 937 patients with retinoblastoma ranged from 0 to 179 months and a total of 37/923 patients died. OS rates for different variables were analyzed and depicted in Fig. 1.
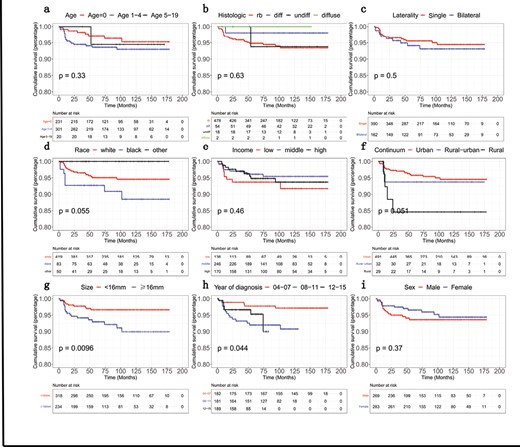
Schematic depiction of Kaplan-Meier overall survival curves related to the retinoblastoma patients stratified into different groups at the time of diagnosis: (A) age, (B) histologic type, (C) laterality, (D) race, (E) income, (F) residence (depending on Rural-Urban Continuum Codes), (G) tumor size, (H) year of diagnosis, (I) sex.
The assessment of variables whose P-value was less than 0.2 using the Cox multivariable proportional hazards model revealed that the patients with “larger tumor size” (HR = 2.58, 95% CI, 1.18-5.62, P = .018), “bilaterality” (HR = 1.94, 95% CI, 1.01-3.73, P = .048), and patients living in “rural regions” (HR = 3.43, 95% CI, 0.98-12.0, P = .054) as well as patients diagnosed with retinoblastoma during the period from 2008 and 2011 (HR = 2.72,95% CI, 1.12-6.57, P = .027) were considered independent predictors of shorter OS. However, the multivariable regression analysis delineated that income was not identified as a risk factor for ascertaining OS (Table 2 and Fig. 2).
Multivariate Cox regression analysis including all variables for predicting the overall survival of retinoblastoma patients.
| Characteristic | HR* | 95% CI | P-value |
|---|---|---|---|
| Size | .009 | ||
| Size < 16 cm | Reference | ||
| Size ≥ 16 cm | 2.576 | 1.180-5.626 | .018 |
| Unknown | 0.851 | 0.344-2.103 | .727 |
| Laterality | .048 | ||
| Unilateral | Reference | ||
| Bilateral | 1.938 | 1.005-3.735 | .048 |
| Rural-urban | .138 | ||
| Urban | Reference | ||
| Rural-urban | 1.943 | 0.536-7.047 | .312 |
| Rural | 3.431 | 0.980-12.007 | .054 |
| Year of diagnosis | .084 | ||
| 2004-2007 | Reference | ||
| 2008-2011 | 2.716 | 1.123-6.567 | .027 |
| 2012-2015 | 1.947 | 0.731-5.182 | .182 |
| Income | .612 | ||
| Low income | Reference | ||
| Middle income | 1.008 | 0.383-2.656 | .987 |
| High income | 1.442 | 0.551-3.769 | .456 |
Rural-urban represents “Rural-urban fringe zone.”
*HR, Hazard Ratio (describes death from disease).
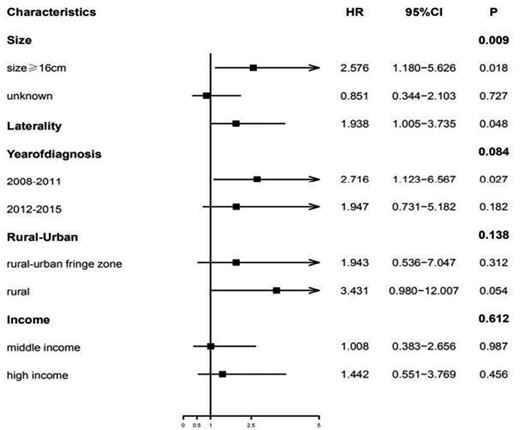
Multivariate analysis of risk factors attributed to the overall survival (OS) of the retinoblastoma patients. The reference value of the tumor size was <16 mm, whereas the laterality was unilateral. The reference value for the year of diagnosis was considered from 2004 to 2007, whereas the reference value for residence was the urban/rural region, and low income was considered as the reference value for “income status.”.
Prediction of Overall Survival (OS)
A nomogram integrating potential risk factors affecting OS was depicted in Fig. 3. Tumor size was the largest contributing factor and the most significant predictor of OS. Two other significant predictors of OS were “residence” and “laterality.” The prognostic nomogram for OS prediction exhibited a good C-index of 0.71 CI (0.63-0.79). The calibration curve constructed for survival probability, and the nomogram showed a good predictive ability (Supplementary Fig. S2A-S2B).
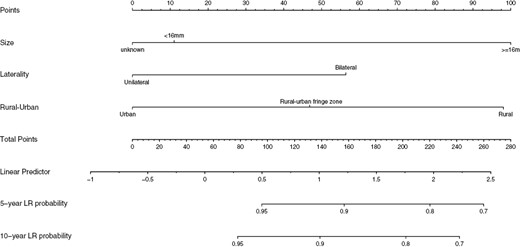
Nomogram constructed for predicting the 5-year and 10-year overall survival (OS) in retinoblastoma patients.
Discussion
Previously, the incidence rates of retinoblastoma were studied in different countries due to its rarity and distinct incidence rates between developed and developing countries.18-20 A study by Broaddus et al delineated the stable incidence of retinoblastoma in the US from 1975 to 2004 and concluded the steady improvement in OS for 30 years was due to the improved clinical outcomes with current therapeutic modalities.2,21 Another study by Andreoli et al (2017) reported on the association between tumor characteristics pertinent to retinoblastoma with the patient’s characteristics such as age at the time of diagnosis, OS, second malignancies, and tumor features such as stage, pathological grade, and laterality based on an analysis of total 1452 cases in SEER database.5 As per this report, the mean age-adjusted incidence was 11.8 per million children aged 0-4 years (95% CI, 10.9 to 12.8) with a steady trend in age-adjusted incidence over the last 30 years.5 In the present study, we deciphered the data pertinent to incidence trends of retinoblastoma from 2004 to 2015, and we concluded that there was no significant decrease or increase in the age-adjusted incidence.
Nindyastuti et al described the survival probability for 60 patients from a developing country, with a 2-year survival probability 45%. The overall median survival time was 21.5 (7.25-40.75) months in developing countries,22 while the cure rate of retinoblastoma is as high as 98% in industrialized countries. As described by Andreoli et al (2017), the rate of high-grade retinoblastoma tumors decreased over the study period and the early identification of these tumors could enable them to identify lesions when they are at a lower grade, which can substantially enhance OS.5 In the present study, factors such as tumor size, laterality, year of diagnosis, and residence were considered as independent prognostic factors in children; mainly tumor size and laterality were considered as the strong and accurate prognostic indicators. Furthermore, OS decreased significantly when the tumor size was greater than 16 cm. Laterality could affect the prognostication of survival in patients with retinoblastoma.12 The selection of suitable therapeutic modalities to target retinoblastoma partially relies upon the nature of laterality.23,24 Mainly, intravenous chemotherapy with intermittent periocular chemotherapy and intra-arterial chemotherapy has been the preferred regimen for treating bilateral retinoblastomas.23 Bilateral retinoblastoma cohorts exhibited a specific decrease in OS and also reported higher incidence rates of second nonocular malignancies like osteosarcoma, and pineoblastoma when compared to the patients with unilateral retinoblastoma tumors.5 A report by Lezama et al demonstrated that the survival rate of retinoblastoma correlated with the residence of the patient with retinoblastoma, being higher in urban areas, which was in line with our present study.9
In this study, we established a nomogram and described the significance of clinically relevant risk factors for the retinoblastoma incidence trends and OS in the children. The C-index and calibration curve suggested a reliable prediction of OS through the nomogram analysis. The SEER database only provides information about whether patients were treated with chemotherapy rather than a detailed treatment plan, so, this could not be incorporated into the nomogram. In addition, we can only use internal validation to test the nomogram due to the rarity of retinoblastoma.25,26 External verification of the model is required, although the nomogram demonstrated good discriminatory ability and consistent calibration curves.
Conclusions
Our study evaluated the incidence trends of retinoblastoma in children younger than 19 years from 2004 to 2015 and constructed a nomogram to predict long-term survival. The nomogram provides a prognostic scale that clinicians may be able to use in guiding the choice of therapeutic regimens.
Acknowledgments
The authors thank the staff of the SEER program for providing open access to the SEER database.
Funding
This study was supported by the Henan Natural Science Foundation of China (No. 222300420534).
Conflict of Interest
The authors indicated no financial relationships.
Author Contributions
Conception/design: X.G., L.W. Provision of study material or patients: N.M.B., C.L. Collection and/or assembly of data: X.Z., R.Z., N.M.B. Data analysis and interpretation: H.Y. Manuscript writing: N.M.B., J.L. Final approval of manuscript: All authors.
Data Availability
The authors did not take any third-party support in conducting this research, analyzing the data, or preparing the manuscript for submission. The whole process of methodology pertinent to data acquisition is shown in the supplementary material.
Ethical Considerations
We obtained permission to access SEER database files pertinent to this study, and there was no personal identification information; hence, informed consent was not required. The first affiliated hospital of Zhengzhou University waived the informed consent due to data acquisition, particularly from the SEER database (https://seer.cancer.gov/data/). All the statistical analytical procedures were executed in accordance with the relevant guidelines and regulations (Declaration of Helsinki).
References
Author notes
Xiaohong Guo, Li Wang and Chunying Liu Contributed equally.
