


Abstract
Few studies examine how patients with advanced cancer cope with stress. The objective of our study was to evaluate coping strategies adopted by patients with cancer and their relationship with symptom burden.
A secondary data analysis of a prospective cross-sectional survey of patients with cancer and tobacco use was conducted, which examined demographics, symptom burden (Edmonton Symptom Assessment System), and coping strategies (the Brief COPE Questionnaire). Demographic characteristics were summarized by standard summary statistics; we also examined associations between patient characteristics and coping strategies using t-test, rank-sum test, chi-squared test, or Fisher’s exact test depending on the distribution of data.
Among 399 patients, the majority were female (60%), Caucasian (70%), the mean age was 56.5 (±12.0) years, and the most common malignancies were gastrointestinal (21%) and breast (19%). Patients with cancer adopted multiple adaptive coping strategies, most frequently acceptance (86.7%) and emotional support (79.9%), with humor (18.5%) being the least. Common maladaptive strategies included venting (14.5%) and self-distraction (36.6%), while substance use (1.0%) was infrequently reported. Of the adaptive strategies, female gender was significantly associated with higher engagement with emotional and instrumental support, positive reframing, religious coping, and acceptance (P < .05 for all). College educated patients reported significantly higher implementation of humor, planning, and acceptance. Maladaptive coping strategies such as denial were associated with increased pain and depression, while patients adopting emotional-focused strategies rated decreased emotional distress.
The majority of patients with advanced cancer reported adopting multiple, adaptive coping strategies, and a minority utilized maladaptive or avoidant strategies, rarely substance use, and may need additional psychological support.
The majority of patients with advanced cancer reported implementing multiple adaptive as opposed to maladaptive or avoidant coping strategies. Patients with cancer with advanced disease who adopted problem-focused or maladaptive coping strategies including venting and denial were reported to have a higher symptom burden, while patients engaged in emotion-focused coping strategies reported less anxiety and depression. Identifying patients with cancer with unhealthy coping mechanisms is critical to direct psychological support and encourage alternative approach-orientated or emotion-focused strategies to cope with stress.
Introduction
The term coping is a broad concept used to describe a wide variety of cognitive and behavioral strategies to manage situations or emotions that are either internally or externally overwhelming.1 Several coping strategies and classification systems have been proposed to better understand and categorize how people cope with stressful situations; however, no consensus has been agreed upon.
Forerunners in distinguishing these strategies, Folkman and Lazarus classified coping into 4 groups including problem-focused, emotion-focused, support-seeking, and meaning-making.2 Various coping strategies can further be identified as either healthy (positive, adaptive or constructive, approach orientated or engaged) resulting in reduced distress, or unhealthy (negative, maladaptive, disengaged, or avoidant).3-5 As more research has been conducted, some academics have questioned the psychometric validity of the categorization of coping mechanisms,2 noting that people’s responses to stress are often complex and multidimensional. Investigators also reported that people adopted various coping strategies, often using several strategies simultaneously, and noted a high likelihood of changing strategies over time.1,6 In addition, the complexities of coping, and its effectiveness, are likely to be influenced by an individual’s unique personality as well as their social environment.1
Unfortunately, research on coping strategies among patients with advanced cancer is limited. One study of female patients with recurrent breast cancer found their coping capacity to be a predictor of the degree to which these patients experienced distress.7 Lower coping capacities were noted in patients who had higher emotional distress and worse QOL.7 In a study of men with prostate cancer who adopted avoidance coping strategies (behavioral disengagement, denial, and distraction) reported increased sleep disorders.8
In addition, religion and substance use—the use of alcohol or other drugs to deal with stress—have been found to impact coping. Negative religious coping, characterized by feeling abandoned or punished by God, was associated with psychological distress and worse QOL.9 Also, history or active tobacco use in patients with cancer was noted to be significantly associated with increased substance use as a coping strategy, pain and higher opioid use potentially increasing the patients risk for opioid-induced neurotoxicity.10
With a better understanding of how patients with advanced cancer cope, palliative care professionals can facilitate the adoption of health coping strategies or may intervene when patients adopt maladaptive or avoidant strategies to decrease symptom burden and psychological distress, and improve quality of life.11 The objective of our study was to evaluate coping strategies in patients with advanced cancer, and identify patient characteristics of those who adopted unhealthy, maladaptive strategies, and associated symptom burden.
Methods
We prospectively screened 490 consecutive patients with advanced cancer who were evaluated in an outpatient supportive care center (SCC) from 2015 to 2016. A total of 441 patients who attended at least 1 follow-up visit in our SCC were eligible to participate in the study. A total of 399, out of the 400 enrolled in the study, completed the survey. Fig. 1 shows the CONSORT diagram. Eligible patients had a diagnosis of advanced cancer and were ≥18 years of age. Advanced cancer was defined as locally advanced, metastatic, or locally recurrent disease for solid tumors and primary progressive or recurrent/refractory disease for hematologic malignancies. Patients with cancer with locally advanced disease and who received curative surgery or definitive chemoradiation as defined by no evidence of disease were excluded.

Consolidated Standards Of Reporting Trials (CONSORT) diagram.
Previously published findings reported patients with cancer who had a history of tobacco use had increased pain expression and higher daily opioid use.10 In this study, we conducted a secondary analysis examining various coping behaviors assessed using the Brief COPE Questionnaire12 in patients with advanced cancer, associated patient characteristics, and symptom burden.
Data Collection
We collected baseline patient demographics including age, sex, ethnicity, and marital status. Data regarding the primary cancer type including the date of diagnosis of advanced cancer and location of the primary cancer, stage of disease at the time of initial SCC consultation, and follow-up dates were documented.
Assessments collected included the Edmonton Symptom Assessment System (ESAS),13 the CAGE alcoholism screening questionnaire,14 the Brief COPE questionnaire,12 and the patient’s morphine equivalent daily dosing (MEDD). All participating patients were informed that their responses to the questions were completely confidential and would not affect the clinical care or treatment provided by the healthcare team.
The ESAS scores the severity of 10 symptoms (pain, fatigue, nausea, depression, anxiety, drowsiness, dyspnea, anorexia, feeling of well-being, and insomnia) on a numerical scale from 0 to 10 in which 0 indicates no symptoms and 10 indicates the worst possible symptom intensity.13
The Brief COPE is a self-reported, validated, 28-item questionnaire that evaluates state coping, which is the number of ways an individual copes in response to a specific stressful situation (such as a cancer diagnosis).12 It consists of 14 subscales (2 items per subscale) measuring the following: self-distraction, active coping, denial, substance use, use of emotional support, use of instrumental support, behavioral disengagement, venting, positive reframing, planning, humor, acceptance, religion, and self-blame. Cronbach alphas range from 0.50 to 0.90 for the Brief COPE subscales. Each single item is scored along a 4-point scale with the following options: 1 (I usually don’t do this at all); 2 (I usually do this a little bit); 3 (I usually do this a medium amount); and 4 (I usually do this a lot). The following 8 subscales are classified as adaptive strategies: active coping, planning, positive reframing, acceptance, humor, religion, use of emotional support, and use of instrumental support (Fig. 2). The remaining 6 subscales are noted to be unhealthy, maladaptive, and include self-distraction, denial, venting, substance use, behavioral disengagement, and self-blame.15,16 The maximum score for the 14 subscales is 8 points, with a higher score indicating greater use of a specific coping strategy. The Brief COPE has been used previously to assess styles of coping in patients with breast cancer,6 primary caregivers of patients with Alzheimer’s disease,17 symptomatic men infected with the human immunodeficiency virus,18 and hematological malignancies.19,20
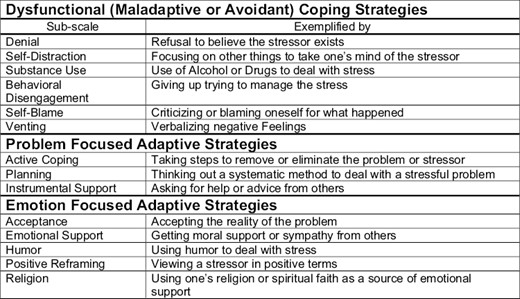
Sub-classifications of coping strategies as outlined by brief-cope questionnaire.
The CAGE questionnaire is a validated 4-item screening tool for a history of alcoholism and has been reported to be approximately 85% sensitive and 90% specific for the diagnosis of alcohol use disorder or dependence.10 The questionnaire asks the following: (1) Have you ever felt you needed to cut down on drinking? (2) Have people annoyed you by criticizing your drinking? (3) Have you ever felt Guilty about drinking? and (4) Have you ever felt you needed a drink in the morning (eye-opener)?
All patients provided informed consent prior to participation in the survey and the institutional review board at The University of Texas MD Anderson Cancer Center in Houston approved the study.
Statistical Analysis
Demographic and clinical characteristics of the study population were summarized with standard summary statistics. The characteristics of patients were compared by various subscales of coping strategies using t-test, rank-sum test, chi-squared test, or Fisher’s exact test depending on the underlying distribution of the data. An average score was calculated for each of the adaptive and maladaptive measures and were compared using a sign rank test. Logistic regression models were conducted to estimate the odds ratio along with 95% CI of subscales of coping strategies having a score greater than or equal to 6. Univariate models were conducted, and a final multivariable model was conducted based on univariate results and included variables with P-values <.10. All statistical analyses were performed using Stata/MP v17.0.
Results
A total of 399 consecutive patients (90%) out of the 441 approached completed the comprehensive questionnaire. Table 1 summarizes patient characteristics. Among 399 patients, the most common malignancies were gastrointestinal (21%) and breast (19%). Most patients (72%) had an advanced degree or some college education, were Caucasian (69.4%), were female gender (56%), and had metastatic or recurrent cancer (91.5%).
Baseline characteristics of patients with advanced cancer.
| Patient characteristics | Total N = 399 (%) |
|---|---|
| Age (mean ± SD) | 56.5 (±12.0) |
| Cancer type | |
| Breast | 78 (19.5) |
| Gastrointestinal | 84 (21.1) |
| Genito-urinary | 41 (10.3) |
| Gynecological | 42 (10.5) |
| Head and neck | 46 (11.5) |
| Thoracic | 50 (12.5) |
| Leukemia and other | 58 (14.5) |
| Education | |
| Some college or more | 287 (72.3) |
| High school or less | 110 (27.7) |
| Ethnicity | |
| White | 277 (69.4) |
| African American | 71 (17.8) |
| Hispanic and other | 51 (12.8) |
| Gender | |
| Female | 223 (55.9) |
| Marital status | |
| Married or living with partner | 263 (63.9) |
| Stage of cancer | |
| Locally advanced | 34 (8.5) |
| Metastatic/recurrent | 365 (91.5) |
| CAGE positive (≥2) | 70 (17.5) |
| Zubrod performance status (mean ± SD) | 1.9 (± 0.7) |
In general, adaptive coping strategies were adopted by patients with advanced cancer more frequently than maladaptive strategies (mean score [SD]; 5.7 [1.1] vs. 3.2 [0.7], respectively). Table 2 summarizes patient coping strategies and associated symptom burden as measured by the ESAS. Of the adaptive coping strategies, patients with cancer incorporated at moderate to high frequency (% patients with ≥6 score on Brief Cope subscale) included acceptance (86.7%), emotional support (79.9%), religion (69.4%), active coping (62.4%), instrumental support (48.4%), positive reframing (48.6%), planning (49.6%), and less commonly, humor (18.5%). Negative or maladaptive coping strategies that were adopted at moderate to high frequency included self-distraction (36.6%) and venting (14.5%), while self-blame (6.3%), denial (4.5%), behavioral disengagement (1.8%), and substance use (1.0%) were infrequently reported.
Coping styles of patients with advanced cancer and associated symptom burden.
| Coping strategies | Brief COPE score n = 399 (mean ± SD) | Number of patients with medium to high adoption (≥6) (%) | Significant symptom scores ESAS (0-10) Mean (±SD) | |||||
|---|---|---|---|---|---|---|---|---|
| Symptom | Low utilization | Medium-High utilization | P-valuea | |||||
| Adaptive | Problem-focused | Active Coping | 6.0 ± 1.7 | 249 (62.4) | No significant differences in symptom burden (>0.1) | |||
| Planning | 5.4 ± 1.8 | 198 (49.6) | Pain | 3.7 (2.7) | 4.2 (2.7) | .08 | ||
| Fatigue | 4.0 (2.7) | 4.6 (2.9) | .04 | |||||
| Anxiety | 1.7 (2.2) | 2.6 (2.8) | <.001 | |||||
| Depression | 1.5 (2.0) | 2.2 (2.6) | .004 | |||||
| Drowsiness | 2.4 (2.5) | 2.8 (2.7) | .08 | |||||
| Sleep | 3.5 (2.5) | 4.1 (2.7) | .02 | |||||
| Wellbeing | 3.3 (2.3) | 4.0 (2.6) | .006 | |||||
| Instrumental support | 5.3 ± 1.8 | 185 (48.4) | Drowsiness | 2.4 (2.7) | 2.9 (2.6) | .04 | ||
| Dyspnea | 1.8 (2.5) | 2.3 (2.6) | .05 | |||||
| Sleep | 3.5 (2.5) | 4.2 (2.7) | .01 | |||||
| Wellbeing | 3.4 (2.5) | 3.8 (2.4) | .06 | |||||
| Emotion-focused | Positive reframing | 5.5 ± 1.9 | 194 (48.6) | Fatigue | 4.5 (2.8) | 4.1 (2.8) | .10 | |
| Sleep | 3.6 (2.5) | 4.1 (2.7) | .09 | |||||
| Wellbeing | 3.8 (2.4) | 3.4 (2.5) | .08 | |||||
| Emotional support | 6.8 ± 1.6 | 319 (79.9) | Pain | 4.5 (2.7) | 3.9 (2.7) | .06 | ||
| Anxiety | 2.6 (2.9) | 2.0 (2.3) | .03 | |||||
| Depression | 2.6 (2.9) | 1.7 (2.1) | .03 | |||||
| Nausea | 2.2 (2.7) | 1.7 (2.3) | .08 | |||||
| Humor | 3.7 ± 1.9 | 74 (18.6) | Anxiety | 2.1 (2.5) | 2.7 (2.7) | .08 | ||
| Depression | 1.8 (2.3) | 2.2 (2.3) | .05 | |||||
| Acceptance | 7.0 ± 1.3 | 346 (86.7) | Anxiety | 2.2 (2.8) | 2.0 (2.4) | .01 | ||
| Depression | 2.9 (3.3) | 1.7 (2.2) | .003 | |||||
| Nausea | 2.7 (2.8) | 1.6 (2.2) | .005 | |||||
| Religion | 6.4 ± 1.9 | 277 (69.4) | Depression | 2.3 (2.5) | 1.7 (2.3) | .03 | ||
| Appetite | 4.2 (2.8) | 3.5 (2.9) | .01 | |||||
| Sleep | 4,2 (2.5) | 2.7 (2.7) | .05 | |||||
| Wellbeing | 4.0 (2.5) | 3.5 (2.4) | .09 | |||||
| Maladaptive | Substance use | 2.2 ± 0.8 | 4 (1.0) | Small sample size | ||||
| Self-blame | 2.9 ± 1.4 | 25 (6.3) | Anxiety | 2.1 (2.5) | 2.8 (2.7) | .10 | ||
| Denial | 2.6 ± 1.3 | 18 (4.5) | Pain | 3.9 (2.7) | 6.0 (2.3) | .001 | ||
| Anxiety | 2.1 (2.4) | 4.3 (3.4) | .01 | |||||
| Depression | 1.7 (2.2) | 4.2 (3.3) | .001 | |||||
| Nausea | 1.7 (2.4) | 3.1 (3.4) | .05 | |||||
| Venting | 3.8 ± 1.5 | 58 (14.5) | Anxiety | 2.0 (2.5) | 3.0 (2.9) | .01 | ||
| Depression | 1.7 (2.3) | 2.5 (2.7) | .02 | |||||
| Behavioral disengagement | 2.3 ± 0.9 | 7 (1.8) | Small sample size | |||||
| Self-distraction | 4.9 ± 1.6 | 146 (36.6) | Depression | 1.7 (2.4) | 2.1 (2.3) | .03 | ||
| Dyspnea | 2.3 (2.7) | 1.7 (2.3) | .05 | |||||
| Sleep | 3.7 (2.5) | 4.1 (2.7) | .08 | |||||
at-test or rank-sum test.
Abbreviation: ESAS, Edmonton Symptom Assessment System (<2.5% missing symptom ratings).
Table 2 also reports trends and significant symptoms associated, on univariate analysis, with various classifications of coping mechanisms. Of the unhealthy, maladaptive strategies, patients who adopted venting either moderate to high were noted to significantly rate higher symptoms of anxiety (mean ESAS [0-10] [SD]); (3.0 [2.9] vs. 2.0 [2.5], P = .01) and depression (2.5 [2.7] vs. 1.7 [2.3], P = .02). Self-distraction was utilized by patients who rated depression significantly higher (2.1 [2.3] vs. 1.7 [2.4], P = .03) but noted less dyspnea (1.7 [2.3] vs. 2.3 [2.7)], P = .05). Patients who adopted denial at moderate to high frequency had higher ratings of pain (6.0 [2.3] vs. 3.9 [2.7], P = .001), worse nausea (3.1 [3.4] vs. 1.7 [2.4], P = .02), increased depression (4.2 [3.3] vs. 1.7 [2.2], P = .01), and elevated anxiety (4.3 [3.4] vs. 2.1 [2.4], P = .01).
Of the adaptive strategies, patients with cancer who engaged in emotional support either moderate to high degree reported significantly less anxiety (2.0 [2.3] vs. 2.6 [2.9], P = .03) and depression (1.7 [2.1] vs. 2.6 [2.9], P = .03). Patients who adopted instrumental support noted higher drowsiness (2.9 [2.6] vs. 2.4 [2.7], P = .04), increased dyspnea (2.3 [2.6] vs. 1.8 [2.5], P = .05), and worse sleep ratings (4.2 [2.7] vs. 3.5 [2.5], P = .01). Planning as a moderate to high coping strategy versus low adoption was associated with increased fatigue (4.6 [2.9] vs. 4.0 [2.7], P = .04), higher anxiety (2.6 [2.8] vs. 1.7 [2.2], P < .001), increased depression (2.2 [2.6] vs. 1.5 [2.0], P = .004), worse sleep (4.1 [2.7] vs. 3.5 [2.5], P = .02), and well-being (4.0 [2.6] vs. 3.3 [2.3], P = .006). Patients who implemented acceptance at moderate to high frequency rated less anxiety (2.0 [2.4] vs. 2.2 [2.8], P = .01) and depression (1.7 [2.2] vs. 2.9 [3.3], P = .003) as well as decreased nausea (91.7 [2.3] vs. 2.2 [2.7], P = .005). Patients who engaged in moderate to high religious coping versus low were noted to rate less depression (1.7 [2.3] vs. 2.3 [2.5], P = .03), better appetite (3.5 [2.9] vs. 4.2 [2.8], P = .01), and sleep (2.7 [2.7] vs. 4.2 [2.5], P = .05).
Table 3 reports the unadjusted and adjusted odds ratios for symptoms and associated with moderate to high adoption versus low of various subclassifications of coping strategies. Of note, patients with cancer who adopted denial at moderate to high frequency were noted to have higher depression (adjusted OR [95%CI]; 1.69 [1.15, 2.48], P = .007) and increased pain (1.38 [1.05, 1.81], P = .02). Patients who adopted positive reframing noted worse ratings of sleep (1.16 [1.05, 1.27], P = .002).
Symptom burden and subcategories of coping styles of patients with advanced cancer.
| Coping strategies | Medium-high vs. low utilization | ||||||
|---|---|---|---|---|---|---|---|
| Symptom burden | OR [95%CI] Unadjusted | P-value | OR [95%CI] Adjusted | P-valuea | |||
| Adaptive | Problem-focused | Active coping | No significant differences in symptom burden (>0.1) | ||||
| Planning | Pain | 1.07 [1.00, 1.15] | .06 | 0.99 [0.90, 1.09] | .87 | ||
| Fatigue | 1.08 [1.00, 1.16] | .04 | 1.02 [0.91, 1.14] | .72 | |||
| Anxiety | 1.16 [1.07, 1.26] | <.001 | 1.06 [0.93, 1.21] | .37 | |||
| Depression | 1.15 {1.06, 1.26] | .002 | 1.04 [0.90, 1.21] | .59 | |||
| Drowsiness | 1.07 [0.99, 1.15] | .08 | 1.00 [0.89, 1.11] | .97 | |||
| Sleep | 1.10 [1.02, 1.18] | .02 | 1.07 [0.96, 1.18] | .21 | |||
| Wellbeing | 1.13 [1.04, 1.23] | .004 | 1.04 [0.92, 1.17] | .54 | |||
| Instrumental support | Pain | 1.07 [1.00, 1.16] | .06 | 1.04 [0.96, 1.13] | .33 | ||
| Drowsiness | 1.07 [0.99, 1.15] | .09 | 1.02 [0.93, 1.11] | .66 | |||
| Dyspnea | 1.07 [0.99, 1.16] | .09 | 1.03 [0.94, 1.12] | .52 | |||
| Sleep | 1.10 [1.02, 1.19] | .01 | 1.08 [0.99, 1.17] | .10 | |||
| Wellbeing | 1.08 [0.99, 1.17] | .08 | 1.01 [0.91, 1.11] | .88 | |||
| Emotion-focused | Positive reframing | Pain | 0.94 [0.87, 1.01] | .10 | 0.96 [0.88, 1.04] | .34 | |
| Fatigue | 0.94 [0.88, 1.01] | .10 | 0.95 [0.88, 1.03] | .22 | |||
| Sleep | 1.07 [0.99, 1.16] | .07 | 1.16 [1.05, 1.27] | .002 | |||
| Emotional support | Pain | 0.92 [0.84, 1.01] | .08 | 0.98 [0.89, 1.09] | .77 | ||
| Fatigue | 0.93 [0.85, 1.01] | .10 | 0.99 [0.89, 1.12] | .92 | |||
| Nausea | 0.92 [0.83, 1.01] | .07 | 0.97 [0.86, 1.09] | .63 | |||
| Anxiety | 0.85 [0.78, 0.93] | .001 | 0.90 [0.78, 1.03] | .13 | |||
| Depression | 0.86 [0.78, 0.95] | .003 | 0.95 [0.81, 1.11] | .50 | |||
| Humor | Anxiety | 1.09 [0.99, 1.19] | .08 | 1.09 [0.99, 1.20] | .09 | ||
| Acceptance | Anxiety | 0.84 [0.78, 0.93] | .001 | 0.92 [0.77, 1.10] | .38 | ||
| Depression | 0.82 [0.74, 0.95] | <.001 | 0.90 [0.74, 1.09] | .27 | |||
| Nausea | 0.86 [0.77, 0.95] | .004 | 0.90 [0.79, 1.03] | .12 | |||
| Religion | Depression | 0.91 [0.83, 0.99] | .04 | 0.92 [0.83, 1.02] | .12 | ||
| Appetite | 0.91 [0.84, 0.98] | .02 | 0.94 [0.86, 1.03] | .20 | |||
| Sleep | 0.92 [0.85, 1.00] | .06 | 0.96 [0.87, 1.06] | .39 | |||
| Wellbeing | 0.92 [0.85, 1.01] | .08 | 1.01 [0.90, 1.14] | .82 | |||
| Maladaptive | Substance use | Small sample size | |||||
| Self-blame | No significant differences in symptom burden (>0.1) | ||||||
| Denial | Pain | 1.34 [1.11, 1.62] | .002 | 1.38 [1.05, 1.81] | .02 | ||
| Nausea | 1.21 [1.04, 1.41] | .02 | 1.19 [0.97, 1.47] | .10 | |||
| Anxiety | 1.30 [1.11, 1.51] | .001 | 0.90 [0.66, 1.21] | .48 | |||
| Depression | 1.48 [1.17, 1.64] | <.001 | 1.69 [1.15, 2.48] | .007 | |||
| Dyspnea | 1.16 [0.99, 1.37] | .06 | 1.17 [0.93, 1.48] | .17 | |||
| Wellbeing | 1.21 [1.00, 1.47] | .05 | 0.96 [0.73, 1.27] | .77 | |||
| Venting | Anxiety | 1.14 [1.03, 1.26] | .009 | 1.10 [0.95, 1.28] | .22 | ||
| Depression | 1.13 [1.02, 1.26] | .02 | 1.05 [0.90, 1.24] | .52 | |||
| Behavioral disengagement | Small sample size | ||||||
| Self-distraction | Dyspnea | 0.91 [0.83, 0.99] | .03 | 0.92 [0.83, 1.01] | .09 | ||
aWald test.
Abbreviation: ESAS, Edmonton Symptom Assessment System (<2.5% missing symptom ratings).
Table 4 reports significant unadjusted and adjusted odds ratio for patient characteristics associated with various coping strategies. Male patients were significantly less likely to engage in emotional (0.45 [0.27, 0.78], P = .004) and instrumental support (0.62 [0.41, 0.93], P = .02), positive framing (0.45 [0.30, 0.68], P < .0001), acceptance (0.40 [0.21, 0.83], P = .01), and religious coping (0.45 [0.29, 0.70], P < .0001) compared to females. With respect to maladaptive strategies, male patients reported less likely to adopt self-distraction (0.54 [0.34, 0.87], P = .01) and venting (0.38 [0.20, 0.73], P = .004). Patients with only a high school education or less were significantly less likely to incorporate planning (0.51 [0.31, 0.83], P = .006), humor (0.47 [0.25, 0.89], P = .02), and acceptance (0.42 [0.21, 0.83], P = .01) but more likely to adopt denial (7.66 [2.02, 29.0], P = .003) as compared with patients with some college experience or more. In addition, younger patients with cancer were more frequently to adopt at moderate to high frequency versus low planning as a coping strategy (mean age in years [SD]; 55.2 [11] vs. 57.8 [12], P = .03) as well as self-distraction (54 [13] vs. 58 [11], P = .003).
Characteristics associated with coping strategies among patients with cancer.
| Patient characteristic | Adaptive Coping styles | Moderate to high vs. low utilization | Maladaptive Coping styles | Moderate to high vs. low utilization | ||||||
|---|---|---|---|---|---|---|---|---|---|---|
| OR [95%CI] Unadjusted | P-value | OR [95%CI] Adjusted | P-valuea | OR [95%CI] Unadjusted | P-value | OR [95%CI] Adjusted | P-valuea | |||
| Male vs. Female gender | Emotional Support | 0.58 [0.35, 0.95] | .03 | 0.45 [0.27, 0.78] | .004 | Self-distraction | 0.50 [0.33, 0.76] | .001 | 0.54 [0.34, 0.87] | .01 |
| Instrumental support | 0.65 [0.43, 0.96] | .03 | 0.62 [0.41, 0.93] | .02 | Venting | 0.35 [0.19, 0.67] | .001 | 0.38 [0.20, 0.73] | .004 | |
| Positive framing | 0.45 [0.30, 0.67] | <.001 | 0.45 [0.30, 0.68] | <.0001 | ||||||
| Acceptance | 0.43 [0.24, 0.77] | .005 | 0.40 [0.21, 0.83] | .01 | ||||||
| Religion | 0.44 [0.28, 0.68] | <.001 | 0.45 [0.29, 0.70] | <.0001 | ||||||
| High school or less vs. college or more | Planning | 0.43 [0.27, 0.67] | <.001 | 0.51 [0.31, 0.83] | .006 | Self-distraction | 0.62 [0.39, 0.99] | .05 | 0.62 [0.38, 1.01] | .06 |
| Humor | 0.44 [0.24, 0.82] | .01 | 0.47 [0.25, 0.89] | .02 | Denial | 3.37 [1.21, 9.34] | .02 | 7.66 [2.02, 29.0] | .003 | |
| Active coping | 0.67 [0.43, 1.04] | .07 | 0.70 [0.44, 1.12] | .14 | ||||||
| Acceptance | 0.53 [0.28, 1.01] | .05 | 0.42 [0.21, 0.83] | .01 | ||||||
| Other minority vs. white ethnicity | Planning | 0.64 [0.41, 0.98] | .04 | 0.78 [0.46, 1.31] | .35 | |||||
| Active coping | 0.67 [0.43, 1.03] | .07 | 0.61 [0.38, 0.99] | .04 | ||||||
| Single or other vs. married or living with a partner | Emotional support | 0.52 [0.32, 0.86] | .01 | 0.47 [0.28, 0.81] | .006 | Self-distraction | 1.55 [1.01, 2.37] | .04 | 1.62 [1.00, 2.62] | .05 |
| Metastatic or recurrent vs. locally advanced | Active coping | 0.40 [0.17, 0.95] | .04 | 0.29 [0.11, 0.80] | .02 | |||||
aWald test.
In an exploratory analysis, looking at patients with advanced cancer adopting either low versus moderate to high spiritual coping showed no association with CAGE questionnaire positivity ≥2 (19% vs. 17%, P = .67) or increased opioids use (morphine equivalent daily dosing ≥30) (56 vs. 60, P = .44), respectively.
Discussion
Most patients with advanced cancer seen in the SCC reported utilizing multiple adaptive coping strategies. In addition, patients with cancer who adopted problem-focused (apart from active coping) strategies or maladaptive coping including venting or denial had a higher symptom burden, while patients engaged in emotion-focused coping strategies reported less anxiety and depression. Other studies21-23 on coping in patients with cancer reported similar findings including acceptance being the most common implemented coping strategy, followed by emotional support, active coping, and religion. In addition, most people, including patients with cancer, do not fit neatly into any one strategic sub-group, but rather report adopting a variety of coping strategies, which may change over time and be affected by symptom burden. This flexibility may be important to develop resilience to the stressors experienced during a life-limiting illness.6 Further prospective longitudinal study is needed to determine whether counseling patients with cancer with advanced disease to adopt emotion-focused coping strategies, approach orientated as opposed to avoidant strategies, or the engagement of more than one healthy adaptive coping strategy will help to reduce their symptom burden, increase resilience, or improve QOL.
A minority of our patients reported unhealthy, negative coping strategies such as behavioral disengagement (avoidance), denial, and self-blame. The 2 most common unhealthy coping strategies reported were self-distraction and venting. It is unclear if these strategies lead to poor clinical outcomes; however, in our sample, these strategies were also associated with higher ratings of emotional distress with adoption of denial being associated with both higher pain and depression ratings. Similar findings have been noted in a systematic review examining coping styles and psychological distress, where disengaged coping was associated with higher psychological distress and worse QOL.24 Also, in patients with recently diagnosed lung or gastrointestinal cancers, the adoption of denial and self-blame were associated with worse QOL and increased anxiety and depression.25 In a recent longitudinal study of coping strategies in patients with hematological malignancies, avoidant coping (denial, self-blame, and behavioral disengagement) was associated with increased emotional distress.19
It is likely the degree to which such negative coping strategies are used to determine whether they are healthy or unhealthy. Self-distraction can be healthy, but when over-utilized, may be an indicator of denial, whereby the patient is not spending any time facing or avoiding what is happening. Similarly, venting can be healthy at times, but if used alone, may prevent healthy cognitive processing. Comparable findings have been noted in the literature to suggest sometimes positive coping strategies can be maladaptive. For example, religious/spiritual coping can be problematic when patients question their faith due to their illness,26 or problem-focused coping adaptive strategies can falter in the setting of an incurable disease. In our patient population of patients with advanced cancer, it is unclear if a higher symptom burden resulted in patients with cancer engaging in problem-focused coping or if the coping strategy itself resulted in increased distress. In addition, the ideal classification system for coping strategies, a complex phenomenon, as either adaptive versus maladaptive as opposed to approach-orientated or engaged versus avoidant, is unclear and more research is needed to determine which coping classification has the greatest clinical utility.
Gender differences were noted in our study and were significantly associated with different styles of coping. Research suggests an underlying difference between men and women with males displaying a “fight-or-flight” reaction or problem-focused coping to stress, whereas females adopt a “tend-and-befriend” reaction or emotion-focused coping mechanisms.27 In addition, minority patients with cancer or those with less than a high school education were significantly less likely to engage in planning which may have implications for why minorities may not engage in advanced care planning (ie, identifying healthcare proxies or completion of do-not-resuscitate order) as noted by other researchers.28,29 A study attempting to identify mediators of racial/ethnic differences noted that terminal illness knowledge, religiousness, or treatment preferences did not account for differences30, and more research is needed.
Findings related to substance use, an avoidant coping strategy, may have been limited by the means in which it was assessed by the 2 questions used in the brief-COPE Questionnaire. Despite the survey being confidential and staff trained to administer the questions in a non-judgmental manner, only 1% of our patient population reported moderate to high frequency of substance use as a coping strategy. In contrast, in the same patient population, CAGE positivity was noted to be 17.5% and the short form of the Screener and Opioid Assessment for Patients with Pain was positive in 18.1%.10 When the CAGE questionnaire is adapted to include drugs, the CAGE-AID, the sensitivity decreases.31 A positive CAGE-AID response rate was noted to be 10.5% in a prospective study and 11.4% in a large retrospective study.32 This suggests questions regarding non-medical opioid or alcohol use in times of stress may be perceived by patients to be too sensitive to disclose or they may also lack insight or awareness of the subconscious adoption of substance use as a coping mechanism. A confidential clinical interview by a psychologist or psychiatrist incorporating DSM-5 criteria is the gold standard to assess stigmatized behavior such as substance use disorders and may be needed to detect patients who engage in these harmful coping strategies.
The development of screening tools followed by a clinical interview are needed to assist in identifying the subset of patients with cancer engaging in unhealthy or avoidant coping strategies to triage psychological resources, which are often limited, to better assist patients with cancer in developing alternative, healthier coping strategies. Cognitive behavioral therapy (CBT) may be used to assist with redirecting patients’ thoughts and behavioral patterns to those that help them to process and develop, rather than avoid, healthy coping. This is also enhanced by our use of family meetings that include a patient with advanced cancer (when able), close family caregivers, and an interdisciplinary team, to assist with communication and to promote acceptance and other approach-orientated techniques. In a study evaluating early integration of palliative care (EIPC) for patients with advanced cancer, approach-orientated coping (acceptance, active coping, and positive reframing) mediated the effects of EIPC on improvements in symptoms and QOL.33
Another specific example of beneficial interventions includes a recent randomized trial reporting Mindfulness-Oriented Recovery Enhancement to be superior to psychotherapy in patients with chronic pain with respect to non-medical opioid use, opioid craving, and emotional distress.34 In addition, a recent study noted opioid tapering, defined as 15% or more relative reduction in mean daily opioid dose, for non-cancer patients on chronic opioid therapy, was associated with an increased risk for substance use disorders or a mental health crisis.35 This suggests that if an alternative healthy coping mechanism is not supplemented for substance (opioid) use, the risk of non-medical opioid use or emotional distress may counterintuitively increase in frequency.
Similarly, religious/spiritual coping assessment consisted of only 2 questions regarding prayer or meditation and comfort from religion or spiritual beliefs. These questions may not be sensitive enough to detect negative religious coping or spiritual pain. In a study examining 100 patients with cancer, almost all patients considered themselves spiritual (98%), spiritual pain was reported in 44% of patients, and a noted trend toward increased emotional distress.36 In our study, we also noted no difference in CAGE positivity or MEDD in patients with cancer who engaged in religious coping with moderate to high frequency. A recent study of the US religious landscape reported that among the religiosity domains, only frequency of service attendance was associated with substance use disorder including alcohol, tobacco, and cannabis,37 and more research is needed in patients with cancer.
Limitations of our study include the cross-sectional design, the high correlation between symptoms as measured by ESAS resulting in multicollinearity and less reliable multivariate models, and the small sample size of patients adopting maladaptive strategies at a moderate to high frequency. Although the brief COPE was used to not burden patients with cancer with too many questions, a more formal clinical interview using the DSM-5 criteria would ideally be used to assess for unhealthy coping mechanisms, such as substance use disorders.
Conclusion
Most patients with advanced cancer seen in an SCC by palliative healthcare providers reported utilizing multiple adaptive as opposed to maladaptive coping strategies. Screening tools for maladaptive or avoidant coping strategies, followed by a confidential clinical interview by a psychologist or psychiatrist, should be integrated to identify the minority of patients who may be more likely to use unhealthy coping strategies. Identifying patients with cancer who utilize unhealthy or avoidant coping is critical to direct psychological support and encourage alternative healthy strategies to cope with stress.
Acknowledgments
Hilda Cantu, Janet Williams assistance in data collection.
Funding
Bryan Fellman was supported in part by the National Institutes of Health through MD Anderson’s Cancer Center Support Grant CA016672.
Conflict of Interest
The authors indicated no financial relationships.
Author Contributions
Conception/design: R.D., M.A., S.B., C.C., E.B. Provision of study material or patients: R.D., M.A., A.R., S.B., J.A., A.H., C.C., D.H., E.B. Collection and/or assembly of data: R.D., D.H. Data analysis and interpretation: R.D., B.F., D.H., E.B. Manuscript writing: R.D., M.A., C.C., E.B. Final approval of manuscript: All authors.
Data Availability
The data underlying this article will be shared on reasonable request to the corresponding author.
References
Author notes
Rony Dev and Monica Agosta Contributed equally.
