


Abstract
Genomic biomarkers that predict response to anti‐PD1 therapy in prostate cancer are needed. Frameshift mutations are predicted to generate more neoantigens than missense mutations; therefore, we hypothesized that the number or proportion of tumor frameshift mutations would correlate with response to anti‐PD1 therapy in prostate cancer.
To enrich for response to anti‐PD1 therapy, we assembled a multicenter cohort of 65 men with mismatch repair‐deficient (dMMR) prostate cancer. Patient characteristics and outcomes were determined by retrospective chart review. Clinical somatic DNA sequencing was used to determine tumor mutational burden (TMB), frameshift mutation burden, and frameshift mutation proportion (FSP), which were correlated to outcomes on anti‐PD1 treatment. We subsequently used data from a clinical trial of pembrolizumab in patients with nonprostatic dMMR cancers of various histologies as a biomarker validation cohort.
Nineteen of 65 patients with dMMR metastatic castration‐resistant prostate cancer were treated with anti‐PD1 therapy. The PSA50 response rate was 65%, and the median progression‐free survival (PFS) was 24 (95% confidence interval 16–54) weeks. Tumor FSP, more than overall TMB, correlated most strongly with prolonged PFS and overall survival (OS) on anti‐PD1 treatment and with density of CD8+ tumor‐infiltrating lymphocytes. High FSP similarly identified patients with longer PFS as well as OS on anti‐PD1 therapy in a validation cohort.
Tumor FSP correlated with prolonged efficacy of anti‐PD1 treatment among patients with dMMR cancers and may represent a new biomarker of immune checkpoint inhibitor sensitivity.
Given the modest efficacy of immune checkpoint inhibition (ICI) in unselected patients with advanced prostate cancer, biomarkers of ICI sensitivity are needed. To facilitate biomarker discovery, a cohort of patients with DNA mismatch repair‐deficient (dMMR) prostate cancer was assembled, as these patients are enriched for responses to ICI. A high response rate to anti‐PD1 therapy in these patients was observed; however, these responses were not durable in most patients. Notably, tumor frameshift mutation proportion (FSP) was identified as a novel biomarker that was associated with prolonged response to anti‐PD1 therapy in this cohort. This finding was validated in a separate cohort of patients with nonprostatic dMMR cancers of various primary histologies. This works suggests that FSP predicts response to anti‐PD1 therapy in dMMR cancers, which should be validated prospectively in larger independent cohorts.
Introduction
Immune checkpoint inhibition (ICI) offers durable responses for many patients with advanced cancer. Yet, unfortunately, it is ineffective for the majority of patients with advanced prostate cancer [1–3]. Why prostate cancer fails to respond more robustly to ICI is incompletely understood, but some speculate that it is due to low numbers of neoantigens, low expression of PD‐L1 protein, an immunosuppressive microenvironment, and/or immunomodulation mediated by castration [4–7].
Despite evidence that ICI is broadly ineffective in unselected patients with prostate cancer, it is approved for use in the rare subset of prostate cancers with mismatch repair deficiency (dMMR). dMMR is characterized by loss of function of one or more of the DNA mismatch repair proteins (MSH2, MSH6, MLH1, or PMS2), resulting in accumulation of hundreds to thousands of mutations within the cancer cell genome as a result of DNA microsatellite instability [8]. This hypermutated genome results in formation of putative mutation‐associated neoantigens that can be recognized by the immune system as foreign [9]. Indeed, advanced solid tumors with dMMR were found to have high response rates to the anti‐PD1 antibody pembrolizumab irrespective of histologic type, which led to the U.S. Food and Drug Administration (FDA) approval of pembrolizumab in May 2017 for this indication [10]. However, only a small proportion of prostate cancers exhibit dMMR, with estimates ranging from 3% to 8% [11–15]. Thus, our best estimates of the efficacy of anti‐PD1 therapy in dMMR or microsatellite instability (MSI)–high prostate cancer are derived from retrospective case series with small numbers and short follow‐up [15–19]. More data are needed to define depth and durability of responses to anti‐PD1 therapy for men with dMMR prostate cancer.
In addition, study of dMMR prostate cancers offers an opportunity to determine factors that are associated with response to anti‐PD1 agents in prostate cancer. A better understanding of what drives response to anti‐PD1 therapy in dMMR prostate cancer would not only allow better selection of patients who may benefit from this treatment, but also may lead to rational strategies to make mismatch repair–proficient (pMMR) prostate cancer susceptible to immunotherapy approaches.
Prior studies suggest that neoantigen production and antigen presentation by tumor cells are required for efficacy of anti‐PD1 therapy across cancer types [20–22]. However, what drives these processes is unclear. Tumor mutational burden (TMB) predicts response to anti‐PD1 in melanoma, non‐small cell lung cancer, and urothelial cancer [23–26], which has led to the hypothesis that a high number of tumor mutations translates into a high quantity of neoantigens and subsequent immunotherapy response. To this end, in June 2020, the FDA approved the use of pembrolizumab for patients with advanced solid tumors with a TMB of >10 mutations per megabase (mut/Mb) [27].
However, TMB fails to predict response to anti‐PD1 therapy in several notable tumor types, including renal cell carcinoma and Hodgkin's lymphoma, which generally demonstrate robust response rates despite a low TMB. More recent studies have suggested that insertion and deletion (indel) mutations leading to frameshifts may be more predictive of response to anti‐PD1 agents [28–30]. Frameshift mutations can create novel open reading frames leading to production of peptides that are markedly different from those produced from the nonmutated native DNA sequence (supplemental online Fig. 1). In fact, frameshift mutations generate on average three times as many potential neoantigenic peptides than nonsynonymous single nucleotide variants (i.e., missense mutations). T‐cell tolerance to novel peptides generated by frameshift mutations may be less stringent than germline‐encoded self‐antigens, allowing for more robust antitumor immune responses [30].
Here we sought to determine genomic biomarkers that may predict response to anti‐PD1 therapy in prostate cancer. To enrich for responses to anti‐PD1 treatment, we assembled a cohort of 65 patients with dMMR prostate cancer, which is, to our knowledge, the largest such cohort to date. We show that high frameshift mutation proportion (FSP) is associated with longer progression‐free survival (PFS) to anti‐PD1 therapy in dMMR prostate cancer, as well as in dMMR cancers of other histologies.
Materials and Methods
dMMR Prostate Cancer Patient Cohort Assembly
Inclusion criteria included a diagnosis of prostate cancer with a pathogenic inactivating mutation in MSH2, MSH6, MLH1, or PMS2 in somatic or germline DNA sequencing, mismatch repair (MMR) protein loss on immunohistochemistry (IHC), or MSI‐intermediate or ‐high status on DNA microsatellite analysis. Pathogenic MMR gene alterations were defined as those leading to a truncated protein product (e.g., nonsense, frameshifts, canonical splice‐site mutations) or partial/complete genomic deletions or rearrangements involving these genes. Missense mutations in the MMR genes were only designated as deleterious if they were listed on ClinVar as “pathogenic” or “likely pathogenic.” Somatic MMR mutations and MSI status were determined by clinical‐grade next‐generation sequencing assays, including those by Foundation Medicine (Cambridge, MA), Personal Genome Diagnostics (Baltimore, MD), and Tempus (Chicago, IL), and in house whole‐exome sequencing. Germline assays were performed using the Color Genomics (Burlingame, CA) or Invitae (San Francisco, CA) commercial platforms (from blood or saliva). IHC for MMR proteins was performed per clinical laboratory standards, as previously described [14]. This study was approved by the institutional review boards of Johns Hopkins University, University of Utah, Mayo Clinic Arizona, and University of Indiana, and the need for informed consent was waived.
Clinical Features and Outcomes
Clinical features (demographics, disease characteristics, histologic characteristics) and efficacy outcomes were determined by retrospective chart review. The best prostate‐specific antigen (PSA) response to ICI was determined by the following equation: best PSA response = (baseline pretreatment PSA – lowest PSA while on treatment) ÷ baseline pretreatment PSA. PFS was defined from the start of a systemic therapy until the first date of clinical or radiographic progression (or death if that occurred first), or patients were censored at the last follow‐up date if progression had not occurred.
Estimation of TMB, Frameshift Mutation Burden, and FSP
TMB was determined by each clinical‐grade test, as previously defined, and was denoted as the total number of somatic coding base substitutions and short insertions/deletions per megabase of genome examined (mut/Mb) [31–33]. Frameshift mutation burden (FSB) was calculated as number of frameshift mutations divided by length of genome examined and was similarly reported as number of frameshift mutations per megabase (mut/Mb). Frameshift mutation proportion was calculated as number of frameshifts divided by total reported genomic alterations, yielding a value between 0 and 1. For correlation of genomic biomarkers with tumor‐infiltrating lymphocyte (TIL) density, somatic DNA sequencing was performed using the University of Washington (Seattle, WA) OncoPlex platform as previously described [14] and was reanalyzed to calculate frameshift mutation burden and frameshift mutation proportion as indicated above.
Tumor‐Infiltrating Lymphocyte Density Analysis
TIL density was determined by semiquantitative IHC using an antibody against CD8, as previously described [14].
Statistical Analyses
Descriptive statistics were used to summarize baseline clinical and molecular characteristics of our cohort. We analyzed all time‐to‐event endpoints (e.g., PFS, overall survival [OS]) with the Kaplan‐Meier method, and the log‐rank test was used to compare curves and to generate hazard ratios and p values. The correlation between two continuous variables was assessed by calculating the Pearson correlation coefficient, r, with a two‐tailed t test. The concordance index, C, was used to estimate the predictive power of each genomic variable (TMB, FSB, FSP) with respect to PFS outcomes. We performed statistical analyses with GraphPad Prism (GraphPad Software, San Diego, CA) and R statistical package (version 3.4.0).
Results
Clinical Characteristics of dMMR Prostate Cancer
Our cohort included 65 patients with dMMR prostate cancer assembled from four institutions. Inclusion criteria included a diagnosis of prostate cancer with an inactivating mutation in MSH2, MSH6, MLH1, or PMS2 in somatic or germline DNA sequencing, or MMR protein loss on IHC, or MSI‐intermediate or ‐high status on DNA microsatellite analysis. Consistent with previous reports, we found that patients with dMMR prostate cancer frequently had high‐grade disease (63% with Gleason grade groups 4–5), nonacinar histology (17% with ductal, intraductal, cribriform, neuroendocrine, or small cell histology), metastases at diagnosis (36%), and visceral involvement (37%) (Table 1). Nineteen of 65 patients were treated with anti‐PD1 therapy for metastatic castration‐resistant prostate cancer, and these appeared to have similar clinical characteristics as the rest of the cohort (Table 1).
Clinical characteristics of all patients and patients treated with anti‐PD1
| Characteristic | All patients (n = 65), n (%) | Patients treated with anti‐PD1 (n = 19), n (%) |
|---|---|---|
| Age at diagnosis, median (range), years | 65 (47–87) | 68 (50–84) |
| Race | ||
| Black | 9 (14) | 4 (21) |
| Asian | 2 (3) | 1 (5) |
| White | 45 (69) | 12 (63) |
| Unknown | 9 (14) | 2 (11) |
| PSA at diagnosis, median (range), ng/mL | 16 (1–5,786) | 31 (2.7–5,786) |
| Grade group at diagnosis | ||
| 2 | 5 (8) | 2 (10) |
| 3 | 10 (15) | 3 (16) |
| 4 | 6 (9) | 0 (0) |
| 5 | 35 (54) | 10 (53) |
| Result unavailable | 9 (14) | 4 (21) |
| Atypical histology at diagnosis | ||
| None | 54 (83) | 17 (89) |
| Ductal or intraductal | 6 (9) | 2 (11) |
| Cribriform features | 3 (5) | 0 (0) |
| Neuroendocrine/small cell | 2 (3) | 0 (0) |
| Presence of perineural invasion | 18 (28) | 6 (32) |
| Clinical stage at diagnosis | ||
| TxN0M0 | 34 (52) | 8 (42) |
| TxN1M0 | 8 (12) | 2 (11) |
| TxNxM1 | 23 (36) | 9 (47) |
| Low volume disease | 8 (35) | 4 (44) |
| High volume disease | 15 (65) | 5 (56) |
| Last known disease state, n | ||
| Nonmetastatic | 16 | 0 |
| Metastatic | 49 | 19 |
| Sites of metastases | ||
| Bone | 36 (73) | 15 (79) |
| Bone only | 17 (35) | 5 (26) |
| Lymph node | 25 (51) | 11 (58) |
| Visceral | 18 (37) | 7 (37) |
| Presence of secondary malignancy | 9 (14) | 2 |
| Family history of cancer: First‐degree relative | 39 (60) | 16 (84) |
Abbreviation: PSA, prostate‐specific antigen.
Efficacy of Anti‐PD1 Therapy Among Patients with dMMR Prostate Cancers
Of the 19 patients treated with anti‐PD1 agents, 11 of 17 evaluable patients (65%) experienced a PSA decline of at least 50% (PSA50 response) (Fig. 1A). One patient died prior to the first PSA measurement, and one patient had not yet had a posttreatment PSA measured at the time of data collection. However, despite this high PSA response rate, the median PFS was only 24 (95% confidence interval [CI], 16–54) weeks, and only one patient was observed to have a response lasting longer than 14 months (Fig. 1B). It should be noted that estimation of PFS in retrospective studies is less accurate than assessment in prospective studies because of variable durations between response assessments. For all patients treated with anti‐PD1 therapy, PFS equaled treatment duration. Radiographic response to anti‐PD1 was not assessed. Yet it seemed that a high initial response rate to anti‐PD1 therapy did not translate into a durable response for most patients with dMMR prostate cancer, unlike many other nonprostatic dMMR cancers [10]. There was not a clear difference in PSA response or PFS based on MMR gene alteration (supplemental online Fig. 2), although numbers were too small to assess this.
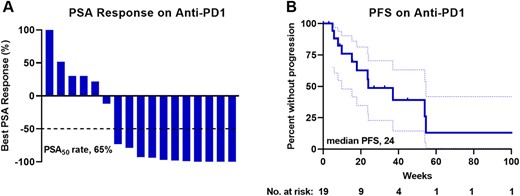
Efficacy of anti‐PD1 therapy for patients with mismatch repair‐deficient prostate cancer. (A): Waterfall plot of best PSA response to anti‐PD1 therapy. PSA50 is shown with a dotted line. Responses greater than 100% are truncated at 100%. (B): Clinical and/or radiographic PFS to anti‐PD1 therapy is shown as a Kaplan‐Meier curve (solid line) with 95% confidence intervals shown with dotted lines. Abbreviations: PSA, prostate‐specific antigen; PSA50, 50% decline in PSA; PFS, progression‐free survival.
Genomic Characteristics of dMMR Prostate Cancer
To determine what features of dMMR prostate cancer might modulate the efficacy of anti‐PD1 therapy, we assessed concurrent genetic alterations found within these tumors. Of the 65 patients, 59 had available somatic DNA sequencing information. The majority of tissue samples sequenced were derived from the primary tumor (59%) and were obtained prior to the initiation of systemic therapy (73%) (supplemental online Table 1). Therefore, the tumor genomics assessed in this study primarily reflect primary untreated dMMR prostate cancer. Forty‐four patients received germline genetic testing, and 13 (30%) were found to harbor germline (i.e., Lynch syndrome) mutations (supplemental online Table 2). Tumors from 35 patients underwent testing for MMR protein expression by IHC, and 27 (77%) showed loss of at least one MMR protein (supplemental online Table 2).
We tabulated concurrent gene mutations found within these dMMR tumors to assess whether there might be enrichment of altered genes that might reflect selective pressure by an endogenous immune response and alter subsequent response to anti‐PD1 therapy. The most frequently coaltered gene was TP53, followed by PTEN, ASXL1, and JAK1 (supplemental online Table 3). Given that JAK1 inactivation has been reported to mediate resistance to anti‐PD1 therapy by diminishing major histocompatibility complex class I expression in other cancers [34], we assessed whether patients with JAK1 alterations had shorter PFS on anti‐PD1 treatment. We found that patients with JAK1 alteration had similar PFS on anti‐PD1 to patients with wild‐type JAK1 (supplemental online Fig. 3). Interestingly, we noted that all JAK1 alterations were frameshift mutations that occurred at several hotspots. This suggested that the JAK1 gene may have multiple microsatellite tracts that render it susceptible to secondary alteration in a dMMR tumor. In contrast, alterations of TP53 and PTEN were similar to those reported in pMMR prostate cancer and were generally not frameshift mutations, which suggested that they were not a direct consequence of the MSI phenotype. No other single gene alteration was enriched in patients with prolonged response to anti‐PD1. Thus, we did not identify a specific single gene that appeared to regulate response to anti‐PD1 treatment in this cohort.
Frameshift Mutation Proportion Positively Correlates with PFS on Anti‐PD1 Therapy
We subsequently turned our attention to the hypothesis that global genomic features, including TMB and specifically enrichment of frameshift mutations, may predict response to anti‐PD1 because of production of neoantigens. We assessed frameshift mutations both in terms of overall FSB and FSP. Specifically, FSP was defined as the number of frameshift mutations divided by the total number of genomic alterations (including single nucleotide variants, insertion‐deletions, splice‐site variants, copy number variants, and gene fusions). Among all patients in our cohort, the median TMB was 15 mut/Mb (interquartile range, 5–28), the median FSB was 3.75 mut/Mb (interquartile range, 1.25–7.5), and the median FSP was 0.17 (interquartile range, 0.09–0.25) (supplemental online Table 2).
To assess the relationship of these variables with efficacy of anti‐PD1 therapy, we first determined the correlation of each variable with PFS on anti‐PD1 treatment for patients who had progressed or died while on therapy (11 of 19 treated patients). In this subgroup, TMB showed a trend toward a positive but weak correlation (r = 0.377; p = .253) with PFS on anti‐PD1 treatment (Fig. 2A). FSB had a stronger, albeit not statistically significant, positive relationship (r = 0.599; p = .067) with PFS on anti‐PD1 treatment (Fig. 2B). Notably, FSP had a clear positive relationship and exhibited the strongest correlation with PFS on anti‐PD1 therapy (r = 0.746; p = .008) (Fig. 2C). Optimal cutoff analysis with respect to predicting PFS, using both the patients who experienced an event as well as censored patients, identified the optimal FSP threshold to be 0.26. The median PFS on anti‐PD1 therapy for patients with FSP greater than 0.26 was 54.0 weeks (95% CI, 37–not reached), whereas the median PFS for patients with FSP less than 0.26 was only 23.7 weeks (95% CI, 9.9–not reached; p = .040) (Fig. 2D). The concordance index, C, with respect to PFS on anti‐PD1 treatment was 0.69, 0.73, and 0.81 using TMB, FSB, and FSP, respectively, suggesting that FSP may indeed have the greatest discriminating power in predicting PFS on anti‐PD1 therapy among patients with dMMR prostate cancer. Moreover, patients with FSP greater than 0.26 experienced longer OS on anti‐PD1 therapy compared with patients with FSP less than 0.26 (median OS, 30.5 months versus 8.5 months; hazard ratio, 0.24; 95% CI, 0.06–0.96; p = .0008) (Fig. 2E). In contrast, TMB or FSB above vs. below the median did not predict longer OS on anti‐PD1 therapy in this cohort (supplemental online Fig. 4).
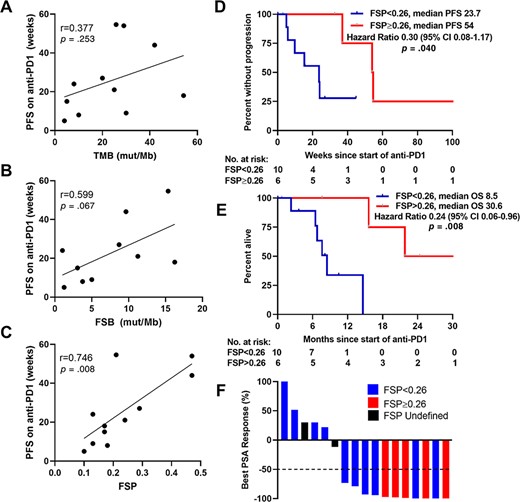
FSP positively correlated with PFS on anti‐PD1 therapy. Correlation of TMB (A), FSB (B), and FSP (C) with PFS on anti‐PD1 therapy among patients with mismatch repair‐deficient prostate cancer who had progressed or died on anti‐PD1. PFS (D) and OS (E) on anti‐PD1 therapy stratified by optimal FSP cutoff are shown as Kaplan‐Meier curves. (F): Waterfall plot of best PSA response to anti‐PD1 therapy color‐coded by FSP. Fifty percent decrease in PSA (PSA50) is shown with a dotted line. Responses greater than 100% are truncated at 100%. Abbreviations: CI, confidence interval; FSB, frameshift mutation burden; FSP, frameshift mutation proportion; mut/Mb, mutations per megabase; OS, overall survival; PFS, progression‐free survival; PSA, prostate‐specific antigen; TMB, tumor mutational burden.
In addition to its correlation with prolonged PFS and OS, FSP greater than 0.26 was also associated with a greater response rate. All evaluable patients with FSP above 0.26 (five of five) exhibited a PSA50 response, whereas only 6 of 10 evaluable patients with FSP below 0.26 exhibited a PSA50 response (Fig. 2F). To assess the possibility that our results were confounded by an association between sequencing of a metastatic site with both higher TMB, FSB, or FSP and greater response to anti‐PD1 treatment, we compared TMB, FSB, and FSP between primary and metastatic tumors and found that these were not statistically different within our cohort (supplemental online Fig. 5).
FSP Positively Correlates with Density of CD8+ TILs in a Separate Cohort of Patients with MSH2 Protein Loss
The density of CD8+ TILs was previously shown to be predictive of response to immune checkpoint blockade in non‐small cell lung cancer [35]. Therefore, we sought to determine whether FSP correlated with CD8+ TIL density in dMMR prostate cancers. Our group previously published a study on a cohort of primary prostate tumors with MSH2 protein loss in which CD8+ TIL density and PD‐L1 expression was determined by quantitative IHC [14]. Therefore, we calculated TMB, FSB, and FSP from DNA sequencing studies performed on these tumors, and we correlated this with CD8+ TIL density. As such, FSP had a positive relationship with CD8+ TIL density (p = .027, r = 0.608) (Fig. 3C). TMB and FSB also showed trends toward positive relationships with CD8+ TIL density, although these were not statistically significant (p = .064 and p = .057, respectively) (Fig. 3A and B). Tumors that expressed PD‐L1 protein had higher FSP estimates than tumors that were PD‐L1 negative (p = .003) (Fig. 3F) and trends toward higher TMB and FSB (p = .098 and p = .051, respectively) (Fig. 3D and E).
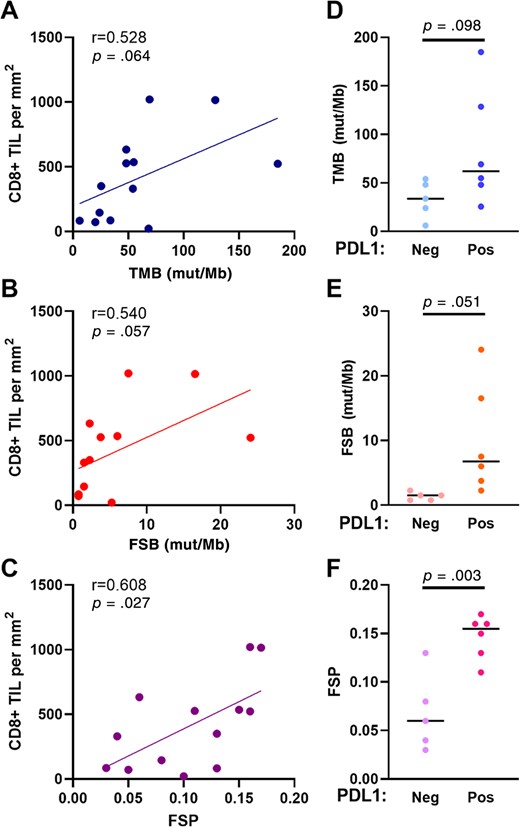
Correlation of genomic markers with CD8+ TIL density and PD‐L1 expression among a separate cohort of prostate cancers with MSH2 protein loss. Correlation of TMB (A), FSB (B), and FSP (C) to CD8+ TIL density. TMB (D), FSB (E), and FSP (F) among tumors with and without PD‐L1 expression determined by immunohistochemistry. Abbreviations: FSB, frameshift mutation burden; FSP, frameshift mutation proportion; mut/Mb, mutations per megabase; TIL, tumor‐infiltrating lymphocyte; TMB, tumor mutational burden.
High FSP Predicts Longer PFS on Anti‐PD1 Therapy in a Separate Cohort of Nonprostatic dMMR Cancers
To determine whether high FSP might broadly predict response to anti‐PD1 therapy in other dMMR cancers, we assessed publicly available data from a clinical trial examining the efficacy of pembrolizumab in dMMR cancers of varying primary histology [10]. Within that cohort of patients with publicly available DNA sequencing data, the median TMB was 34 mut/Mb (interquartile range, 23–55), the median FSB was 8.7 (interquartile range, 3.7–12.3) mut/Mb, and the median FSP was 0.26 (interquartile range, 0.18–0.28). Patients with FSP above the median had numerically longer PFS (p = .079) (Fig. 4A) and statistically significantly longer OS (p = .039) (Fig. 4B) on pembrolizumab compared with patients with FSP below the median. FSP above the median was associated with a hazard ratio for death of 0.22 (95% CI, 0.05–0.9). In contrast, stratification by median TMB and FSB did not distinguish outcomes to pembrolizumab in this population (Fig. 5A and B).
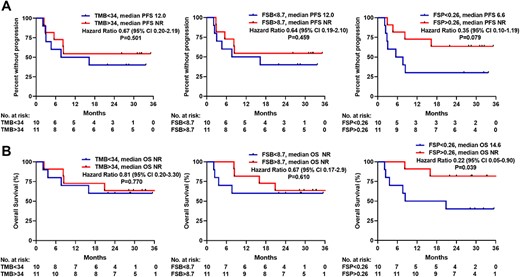
FSP positively correlated with PFS and OS on anti‐PD1 therapy in a separate cohort of mismatch repair‐deficient tumors of varying primary origin. (A): PFS on anti‐PD1 stratified by median TMB, FSB, and FSP are shown as Kaplan‐Meier curves. (B): OS after initiation of anti‐PD1 stratified by median TMB, FSB, and FSP. Abbreviations: CI, confidence interval; FSB, frameshift mutation burden; FSP, frameshift mutation proportion; ND, not determined; OS, overall survival; PFS, progression‐free survival; TMB, tumor mutational burden.
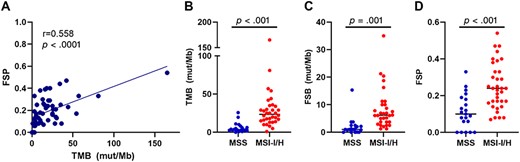
Relationship of FSP with markers of genomic instability. (A): Correlation of FSP with TMB among patients with mismatch repair‐deficient (dMMR) prostate cancer. TMB (B), FSB (C), and FSP (D) stratified by microsatellite instability status among patients with dMMR prostate cancer. Abbreviations: FSB, frameshift mutation burden; FSP, frameshift mutation proportion; MSI‐I/H, microsatellite instability–intermediate/high; MSS, microsatellite stable; mut/Mb, mutations per megabase; TMB, tumor mutational burden.
Characterization of FSP as a Biomarker
Given that FSP appeared to be more predictive of response to anti‐PD1 therapy than TMB, both in our cohort of patients with dMMR prostate cancer and in our validation cohort of patients with nonprostatic dMMR cancers, we sought to characterize this biomarker in terms of correlation to other markers of genomic instability. To this end, FSP positively correlated with TMB (p < .001); however; this correlation was only moderate (r = 0.558) (Fig. 5A). Tumors with MSI‐intermediate or ‐high status had higher TMB, FSB, and FSP (Fig. 5B–D) Thus, FSP is related to, but not equal to, other markers of genomic integrity.
Discussion
We studied the rare subtype of prostate cancer with dMMR to identify features that may predict response to anti‐PD1 therapy in prostate cancer. We found that patients with dMMR prostate cancer had high response rates to anti‐PD1 therapy, with a PSA50 response rate of 65%, yet they did not generally exhibit durable responses, with a median PFS of only 6 months. This response rate is comparable to that reported in a prospective study of anti‐PD1 treatment in dMMR cancers of other histologies; however, the PFS is notably shorter here. Le et al. reported a radiographic response rate of 54% (95% CI, 39%–69%) and a median PFS that was not reached with median follow‐up of 12.5 months in nonprostatic dMMR cancers [10]. The patients presented here may have had shorter PFS because they were not treated on a clinical trial and therefore may have had confounding comorbid conditions or lower functional status or may have been treated with anti‐PD1 agent as later‐line systemic therapy. Alternatively, there may be underlying genomic or immunological differences between dMMR prostate cancers and nonprostatic dMMR cancers. Nonetheless, the discrepancy between response rates and duration of response suggests that dMMR prostate cancer is initially sensitive to anti‐PD1 therapy but is swift to acquire secondary resistance.
To investigate what factors may be required for a sustained response to anti‐PD1 treatment among these patients, we assessed the correlation of genomic features with PFS. Prior studies have suggested an association between tumor genomic features that alter neoantigen production, presentation, and immune evasion and response to ICI [36]. Here we found that a large number of prostate tumors with dMMR had alterations in JAK1; however, these alterations did not associate with diminished efficacy of PD1 blockade. Instead, we suspect that these JAK1 alterations were passenger mutations occurring secondary to dMMR and microsatellite instability. These results suggest that clinicians should not anticipate that dMMR tumors with concurrent JAK1 mutation will necessarily exhibit primary resistance to anti‐PD1 therapy.
In contrast, we found that FSP positively correlated with PFS and OS on anti‐PD1 treatment. This was evident both within the cohort of patients with dMMR prostate cancer and also more broadly in a cohort of patients with dMMR cancers of other histology. Interestingly, the median FSP within our dMMR prostate cancer cohort was 0.17, compared with 0.26 within the cohort of nonprostatic dMMR patients in the Le et al. trial. Thus, perhaps the patients in our cohort with dMMR prostate cancer exhibited shorter PFS on anti‐PD1 treatment because of lower FSP. Future studies should determine how FSP varies among tumor types and whether this variability might account for differential efficacy to anti‐PD1 treatment.
Frameshift mutations can create new open reading frames and generate novel peptides that are predicted to be more antigenic than mutant peptides generated by nonsynonymous single nucleotide variants (i.e., missense mutations). Our results support this notion given that FSB was more predictive of anti‐PD1 response than TMB. However, it is not readily apparent why FSP may be more predictive than FSB. This suggests the question of what determines FSP. In an in vitro model, Mandel et al. found that tumor cell lines with deletion of MSH2 showed preferential expansion of indel mutations over single nucleotide variants over time [29]. Given that indel mutations often generate frameshifts, this suggests that FSP increased as cells transitioned from MSI‐intermediate to MSI‐high status with serial passage and increasing number of cell divisions. In support of this, we found that FSP correlated with MSI‐high status. Additionally, we speculate that FSP could be further modulated by immune‐mediated negative selection (i.e., endogenous immune editing) of cancer clones that produce and present high numbers of neoantigens. Cancers that manage to escape this negative selection might be found to have a higher proportion of frameshift mutations that might make them poised to respond to PD1 blockade. Thus, the proportion of frameshift mutations perhaps equates to quality of frameshift mutations able to generate neoantigens.
Limitations of this study were that it was performed retrospectively with a small number of patients, with DNA sequencing performed on multiple platforms that used different parameters for mutation calling and calculation of TMB. Furthermore, the tissue used for these genomic analyses varied, sometimes coming from the primary tumor and other times coming from a metastatic site. Genomic alterations, particularly in dMMR tumors, change over time during tumor evolution. Thus, prospective studies with larger numbers of patients using a uniform sequencing platform on metastatic tumor samples assessed just prior to anti‐PD1 therapy should be performed to validate the findings presented here and to identify FSP thresholds that could be used clinically. Moreover, future studies should assess whether patients with MMR‐proficient prostate cancer harboring high FSB or FSP may respond to anti‐PD1 therapy despite not having dMMR or microsatellite instability. In addition, FSP may not be a suitable biomarker for all modes of immunotherapy, as the present study only assessed response to anti‐PD1 therapy.
Conclusion
Altogether, this work supports the perspective that the tumor genomic landscape, as the origin of neoantigen production, regulates efficacy of immunotherapy. Specifically, we propose that tumoral FSP is a genomic feature that could be used as a biomarker of sensitivity to anti‐PD1 therapy in dMMR cancers.
Acknowledgments
The authors thank the authors of the article “Mismatch repair deficiency predicts response of solid tumors to PD‐1 blockade” [10] for depositing publicly available genomic data from their prior study that was reanalyzed and presented here. This work was partially supported by National Institutes of Health Cancer Center Support Grant P30 CA006973, NIH Training Grant 2T32CA009071, Department of Defense grants W81XWH‐16‐PCRP‐CCRSA and W81XWH2010079, and the Bloomberg‐Kimmel Institute for Cancer Immunotherapy.
Author Contributions
Conception/design: Laura A. Sena, Emmanuel S. Antonarakis
Provision of study material or patients: Laura A. Sena, Pedro Isaacsson Velho, Emily Nizialek, Nityam Rathi, Roberto Nussenzveig, Miguel Gonzalez Velez, Ryan Ashkar, Nabil Adra, Alan H. Bryce, Neeraj Agarwal, Emmanuel S. Antonarakis
Collection and/or assembly of data: Laura A. Sena, Pedro Isaacsson Velho, Emily Nizialek, Nityam Rathi, Roberto Nussenzveig, Miguel Gonzalez Velez, Ryan Ashkar, Nabil Adra, Alan H. Bryce, Neeraj Agarwal, Emmanuel S. Antonarakis
Data analysis and interpretation: Laura A. Sena, Julia Fountain, Su Jin Lim, Hao Wang, Amanda C. Larson, Colin C. Pritchard, Drew M. Pardoll, James R. Eshleman, Tamara L. Lotan, Emmanuel S. Antonarakis
Manuscript writing: Laura A. Sena, Emmanuel S. Antonarakis
Final approval of manuscript: Laura A. Sena, Julia Fountain, Pedro Isaacsson Velho, Su Jin Lim, Hao Wang, Emily Nizialek, Nityam Rathi, Roberto Nussenzveig, Benjamin L. Maughan, Miguel Gonzalez Velez, Ryan Ashkar, Amanda C. Larson, Colin C. Pritchard, Nabil Adra, Alan H. Bryce, Neeraj Agarwal, Drew M. Pardoll, James R. Eshleman, Tamara L. Lotan, Emmanuel S. Antonarakis
Disclosures
Benjamin L. Maughan: Janssen, Astellas, Bristol‐Myers Squibb, Clovis, Tempus, Merck, Exelixis, Bayer Oncology, Peloton Therapeutics (C/A), Exelixis, Bavarian‐Nordic, Clovis, Bristol‐Myers Squibb (RF—institution); Colin C. Pritchard: Promega, AstraZeneca (C/A); Neeraj Agarwal: Astellas, AstraZeneca, Bayer, Bristol Myers Squibb, Clovis, Eisai, Eli Lilly & Co., EMD Serono, Exelixis, Foundation Medicine, Genentech, Janssen, Merck, Nektar, Novartis, Pfizer, Pharmacyclics, Seattle Genetics (C/A), AstraZeneca, Bavarian Nordic, Bayer, Bristol Myers Squibb, Calithera, Celldex, Clovis, Eisai, Eli Lilly & Co., EMD Serono, Exelixis, Genentech, Glaxo Smith Kline, Immunomedics, Janssen, Medivation, Merck, Nektar, New Link Genetics, Novartis, Pfizer, Prometheus, Rexahn, Roche, Sanofi, Seattle Genetics, Takeda, Tracon (RF—institution); Tamara L. Lotan: Ventana Roche, DeepBio (RF); Emmanuel S. Antonarakis: Janssen, Astellas, Sanofi, Dendreon, Pfizer, Amgen, Eli Lilly & Co., Bayer, AstraZeneca, Bristol Myers Squibb, Clovis, Merck (C/A), Janssen, Johnson & Johnson, Sanofi, Dendreon, Genentech, Novartis, Tokai, Bristol Myers Squibb, AstraZeneca, Clovis, Merck (RF—institution), Qiagen (IP). The other authors indicated no financial relationships.
(C/A) Consulting/advisory relationship; (RF) Research funding; (E) Employment; (ET) Expert testimony; (H) Honoraria received; (OI) Ownership interests; (IP) Intellectual property rights/inventor/patent holder; (SAB) Scientific advisory board
References
Author notes
Disclosures of potential conflicts of interest may be found at the end of this article.
