


Abstract
Several immune checkpoint inhibitors (ICIs) are approved for the treatment of advanced urothelial carcinoma (UC). There are limited biomarkers for ICI-treated patients with UC. We investigated the association between body composition and clinical outcomes in ICI-treated UC patients.
We conducted a retrospective analysis of 70 ICI-treated patients with advanced UC at Winship Cancer Institute from 2015 to 2020. Baseline computed tomography images within 2 months of ICI initiation were collected at mid-L3 and muscle and fat compartments (subcutaneous, intermuscular, and visceral) were segmented using SliceOMatic v5.0 (TomoVision, Magog, Canada). A prognostic body composition risk score (high: 0–1, intermediate: 2–3, or low-risk: 4) was created based on the β coefficient from the multivariate Cox model (MVA) following best-subset variable selection. Our body composition risk score was skeletal muscle index (SMI) + 2 × attenuated skeletal muscle (SM) mean + visceral fat index (VFI). Concordance statistics (C-statistics) were used to quantify the discriminatory magnitude of the predictive model.
Most patients (70%) were men and the majority received ICIs in the second- (46%) or third-line (21%) setting. High-risk patients had significantly shorter overall survival (OS; hazard ratio [HR], 6.72; p < .001), progression-free survival (HR, 5.82; p < .001), and lower chance of clinical benefit (odds ratio [OR], 0.02; p = .003) compared with the low-risk group in MVA. The C-statistics for our body composition risk group and myosteatosis analyses were higher than body mass index for all clinical outcomes.
Body composition variables such as SMI, SM mean, and VFI may be prognostic and predictive of clinical outcomes in ICI-treated patients with UC. Larger, prospective studies are warranted to validate this hypothesis-generating data.
This study developed a prognostic body composition risk scoring system using radiographic biomarkers for patients with bladder cancer treated with immunotherapy. The study found that the high-risk patients had significantly worse clinical outcomes. Notably, the study's model was better at predicting outcomes than body mass index. Importantly, these results suggest that radiographic measures of body composition should be considered for inclusion in updated prognostic models for patients with urothelial carcinoma treated with immunotherapy. These findings are useful for practicing oncologists in the academic or community setting, particularly given that baseline imaging is routine for patients starting on treatment with immunotherapy.
Introduction
Immune checkpoint inhibitors (ICIs) have revolutionized the treatment of advanced urothelial carcinoma (UC). Several ICIs have been approved for advanced UC in recent years including the programmed death-1 (PD-1) inhibitors, pembrolizumab and nivolumab, and the programmed death ligand-1 (PD-L1) inhibitors atezolizumab, avelumab, and durvalumab [1]. Although a recent study suggested a possible role for tumor mutational burden as a predictive biomarker in patients with UC treated with ICIs [2], there are no well-validated biomarkers of clinical outcomes to help identify which patients with UC are most likely to derive clinical benefit from ICIs. Although these agents are appealing options for medical oncologists treating patients with UC given their promise of durable radiographic responses, only a minority of patients experience durable clinical benefit from treatment with ICIs [3–5]. Therefore, there is an unmet need in UC for a well-validated prognostic risk scoring system for patients starting treatment with ICIs.
Measures of body composition have been increasingly studied as prognosticators of clinical outcomes in oncology patients [6]. Body mass index (BMI) is the most commonly used measure of body composition, but it is an imperfect marker that has shown an inconsistent relationship with clinical outcomes in oncology patients [7]. Importantly, BMI does not consider the distribution of adipose tissue or quality and quantity of skeletal muscle. Newer markers of body composition include indices of skeletal muscle (SMI), subcutaneous fat (SFI), visceral fat (VFI) and intermuscular fat (IFI) [8]. These variables have been associated with clinical outcomes in oncology patients, with worse outcomes seen in patients with sarcopenia, which is defined as progressive and generalized loss of skeletal muscle mass and function that is associated with increased adverse outcomes including falls, functional decline, frailty, and mortality [9–12]. It is hypothesized that these markers give a more comprehensive measure of body composition and may more accurately depict the risk associated with body composition in oncology patients treated with ICI. Currently, there have been no studies that have incorporated these markers in patients with advanced UC treated with ICI.
In this study, we investigated the association between body composition and clinical outcomes in patients with advanced UC treated with single agent ICI. We used a comprehensive methodology to capture several variables to quantify skeletal muscle and different fat compartments. This novel study is the first study in any malignancy to create a comprehensive risk scoring system associated with body composition in ICI-treated patients with cancer. This is particularly important in advanced UC because body composition is under-studied in this malignancy and there are limited biomarkers of clinical outcomes. The results from this study may be helpful for practicing medical oncologists in the academic or community settings.
Materials and Methods
Patients and Data
We conducted a retrospective analysis of 70 ICI-treated patients with advanced UC at Winship Cancer Institute of Emory University between 2015 and 2020. This study was approved by the Emory University Institutional Review Board. Inclusion criteria were the following: (a) available computed tomography (CT) scans within 2 months of ICI initiation and (b) confirmed histologic diagnosis of urothelial carcinoma. Baseline CT images were collected at mid-L3. The density of subcutaneous fat, intermuscular fat, visceral fat, and skeletal muscle (SM) were measured by one author (D.J.M.) using Hounsfield unit (HU) references (−190 to −30 HU for subcutaneous and intermuscular fat, −150 to −50 HU for visceral fat, and − 29 to +150 HU for skeletal muscle) using SliceOMatic v5.0 (TomoVision, Magog, Canada) [13, 14]. Intermuscular fat measurement was inclusive of the fat between skeletal muscle and the fascial plane [15, 16]. The densities were converted to indices by dividing by height(m)2 (SFI, IFI, VFI and SMI, respectively). An intra-observer variation of 1.3% was required to confirm adequate training and the author analyzing the images (D.J.M.) was blinded to patient clinical outcomes. Attenuated SM mean density in HU was collected. Myosteatosis percentage was calculated by IFI/SMI × 100%. Demographics, Eastern Cooperative Oncology Group performance status (ECOG PS), sites of metastatic disease, prior systemic therapies, neutrophil-to-lymphocyte ratio (NLR), and baseline BMI were also collected. Radiographic responses to ICIs were determined using RECISTv1.1 [17]. Clinical outcomes were measured by overall survival (OS), progression-free survival (PFS), and clinical benefit (CB). OS and PFS were defined as the number of months from first dose of ICI to date of death or radiographic or clinical progression, respectively. CB was defined as a best radiographic response of a complete response (CR), partial response (PR), or stable disease (SD) for at least 6 months per RECISTv1.1 [18]. This definition of CB has been used in ICI-treated patients in previous studies given that they may have a durable benefit on therapy without meeting the RECISTv1.1 threshold for decrease in summative tumor diameter necessary for qualification of PR [18].
Statistical Analysis
Statistical analysis was conducted using SAS Version 9.4 (SAS Institute, Cary, NC) and SAS macros developed by the Biostatistics Shared Resource at Winship Cancer Institute [19]. The significance level was set at p < .05. Descriptive statistics for each variable were reported. The univariate association of each covariate with PFS or OS was tested by proportional hazard model with hazard ratio (HR) and its 95% confidence interval (CI) being reported. Gender-specific optimal cuts were used to dichotomize patients as high or low for each variable using OS as the primary outcome. The optimal cutoff point was identified that maximizes the separation between the two groups (high versus low) via a bias adjusted log-rank test [20]. We first conducted the variables selection among all body-mass-related measurements to identify a best subset of available body mass variables that provide the smallest Akaike information criterion (AIC) [21]. Following best-subset variable selection with AIC as the selection criteria, prognostic body composition risk score was created based on the β coefficient from the multivariate Cox model (MVA) [22, 23]. Our body composition risk score was SMI + 2 × attenuated SM mean + VFI, and patients were categorized as high (0–1), intermediate (2–3), or low risk (4). A firth correction logistic regression was used to estimate the association between myosteatosis and CB, given that there were zero events in the high myosteatosis group [24]. Comparison of OS and PFS between the risk groups was performed via Kaplan-Meier method and log-rank test. Uno's Concordance statistics (C-statistics) were used to quantify the discriminatory magnitude of the univariable analyses for body composition model and BMI and myosteatosis percentage for OS or PFS [25]. For CB, the area under the curve was reported for the discrimination. The Cox proportional hazard model and logistic regression model were used as MVA to estimate the adjusted association of our risk group with clinical outcomes after controlling for some potential confounders (e.g., age, race, ECOG PS, number of prior lines of therapy, NLR, and liver metastasis). Owing to the small sample size of this study, the MVA was built using backward variable elimination strategy and only variables with p < .20 stayed in the final model.
Results
Demographic and Baseline Disease Characteristics
Demographic information and baseline disease characteristics for this cohort of patients are presented in Table 1. The median age was 69.5 years, and most patients (70%) were male. White patients made up 71% of patients, whereas 21% were Black. More than one quarter (26%) had an ECOG PS ≥2, and 59% of patients had at least two distinct sites of metastatic disease. The distribution of metastatic sites was the following: 71% lymph node, 40% lung, 27% bone, and 23% liver metastases. The majority of patients received ICIs in the second- (46%) or third-line (21%) setting, with pembrolizumab (63%) and atezolizumab (34%) being the most common agents. The median follow-up time was 20.1 months. The total number of events for each outcome was as follows: 42 deaths, 54 progression events, and 21 patients achieving clinical benefit. Of those patients with progression, 42 subsequently died and 12 were alive at last follow-up. Optimal cutoff for NLR was 4.68, with 37 patients (55%) having NLR below or equal to the cutoff and 30 patients (45%) above the cutoff. Gender-specific optimal cutoffs for SMI, attenuated SM mean, SFI, IFI, VFI, and myosteatosis percentage are reported in Table 1.
Demographics and baseline characteristics
| Variable | n (%) |
|---|---|
| Gender | |
| Male | 49 (70) |
| Female | 21 (30) |
| Race | |
| White | 50 (71) |
| Black | 15 (21) |
| Asian | 5 (7) |
| ECOG PS | |
| 0–1 | 51 (73) |
| 2+ | 18 (26) |
| Missing | 1 (1) |
| Urinary tract involvement | |
| Upper | 14 (20) |
| Lower | 56 (80) |
| Prior lines of therapy | |
| 0 | 13 (19) |
| 1 | 32 (46) |
| 2 | 15 (21) |
| 3+ | 10 (14) |
| Number of distant metastatic sites | |
| 0 | 4 (6) |
| 1 | 25 (36) |
| 2 | 22 (31) |
| 3+ | 19 (27) |
| Sites of metastatic disease | |
| Lymph node | 56 (80) |
| Bone | 34 (49) |
| Lung | 28 (40) |
| Liver | 32 (46) |
| Baseline BMI | |
| Median | 25.9 |
| ≤25 | 26 (37) |
| >25 | 44 (63) |
| NLR | |
| Median | 4.33 |
| Optimal cut | 4.68 |
| ≤4.68 | 37 (55) |
| >4.68 | 30 (45) |
| Median (optimal cut-off) muscle and adipose variables | |
| SMI | |
| Male | 43.5 |
| Female | 37.4 |
| Attenuated SM mean | |
| Male | 29.7 |
| Female | 26.4 |
| SFI | |
| Male | 26.2 |
| Female | 53.9 |
| IFI | |
| Male | 7.8 |
| Female | 5.8 |
| VFI | |
| Male | 26.1 |
| Female | 50.9 |
| Myosteatosis percentage | |
| Male | 15.1 |
| Female | 17.0 |
| Median age, yr | 69.5 |
Abbreviations: BMI, body mass index; ECOG PS, Eastern Cooperative Oncology Group performance status; IFI, intermuscular fat index; SFI, subcutaneous fat index; SMI, skeletal muscle index; SM, skeletal muscle; VFI, visceral fat index; yr, years.
Univariate Analysis
The association of baseline body composition variables and clinical outcomes in univariate analysis (UVA) is presented in supplemental online Table 1. Dichotomized (high versus low) SMI, IFI, myosteatosis percentage, and attenuated SM mean were all significantly associated with OS, PFS, and CB (all p ≤ .036). High VFI was significantly associated with improved PFS (HR, 1.76; p = .040) and showed a trend toward longer OS and increased chance of CB. BMI had no association with OS, PFS, or CB (all p ≥ .637). High SFI was significantly associated with prolonged OS (HR, 1.99; p = .043) but had no significant association with PFS (p = .477) or CB (p = .366).
Body Composition Risk Group and Myosteatosis Analysis
MVA for the association between body composition risk groups and myosteatosis and clinical outcomes is presented in Table 2. After controlling for ECOG PS, number of prior lines of therapy, NLR, and liver metastasis, body composition high-risk patients had significantly shorter OS (HR, 6.72; 95% CI, 2.42–16.78; p < .001) compared with the low-risk group. High-risk patients also had significantly shorter PFS (HR, 5.82; 95% CI, 2.00–11.61; p < .001), and lower chance of CB (OR, 0.02; 95% CI, 0.00–0.28; p = .003) compared with the low-risk group. Intermediate-risk patients had significantly shorter OS (HR, 2.99; 95% CI, 1.12–7.98; p = .029), PFS (HR, 3.16; 95% CI, 1.41–7.06; p = .005), and lower chance of CB (OR, 0.11; 95% CI, 0.02–0.53; p = .006) compared with low-risk patients. High- and intermediate-risk body composition patients had significantly shorter OS (2.7 months versus 8.9 months versus Not Reached; p = .0011) and PFS (1.9 months versus 3.4 months versus 10.4 months; p = .0014) compared with low-risk patients per Kaplan-Meier estimation (Figs. 1, 2).
Multivariate analysis of association between risk groups and myosteatosis with clinical outcomes
| Risk Group | OSa | PFSb | CBc | |||
|---|---|---|---|---|---|---|
| HR (CI) | p value | HR (CI) | p value | OR (CI) | p value | |
| Body composition risk group analysis | ||||||
| High risk: risk score = 0–1, n = 20 | 6.72 (2.42–16.78) | <.001 | 5.82 (2.00–11.61) | <.001 | 0.02 (0.00–0.28) | .003 |
| Median, mo | 2.7 | 1.9 | ||||
| 12-month rate, % | 19.7 | 7.5 | ||||
| Intermediate risk: risk score = 2–3, n = 29 | 2.99 (1.12–7.98) | .029 | 3.16 (1.41–7.06) | .005 | 0.11 (0.02–0.53) | .006 |
| Median, mo | 8.9 | 3.4 | ||||
| 12-month rate, % | 45.1 | 20.0 | ||||
| Low risk: risk score = 4, n = 20 | 1 | 1 | 1 | |||
| Median, mo | Not reached | 10.4 | ||||
| 12-month rate | 65.8 | 48.5 | ||||
| Myosteatosis analysisd | ||||||
| High, n = 20 | 2.85 (1.48–5.46) | .002 | 3.09 (1.67–5.72) | <.001 | 0.049 (0.003–0.80) | .034 |
| Low, n = 49 | 1 | 1 | 1 | |||
a OS controlled for Eastern Cooperative Oncology Group performance status (ECOG PS), number of prior lines of therapy, neutrophil-to-lymphocyte ratio (NLR), and liver metastasis. Number of observations in the original data set = 70. Number of observations used = 69 in multivariate analysis.
b PFS controlled for number of prior lines of therapy, NLR, and liver metastasis.
c CB controlled for ECOG PS, and age.
d High versus low myosteatosis determined by optimal cut analysis.
Abbreviations: CB, clinical benefit; CI, confidence interval; HR, hazard ratio; mo, months; OR, odds ratio; OS, overall survival; PFS, progression-free survival.
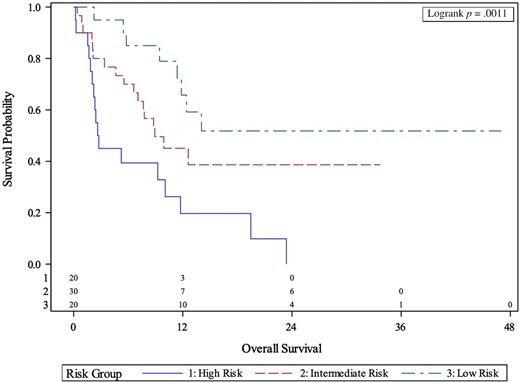
Kaplan-Meier curves of association between body composition risk groups and overall survival.
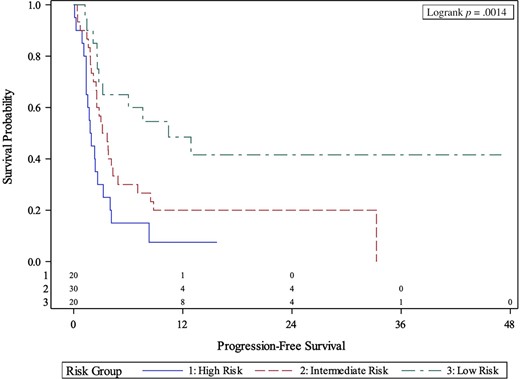
Kaplan-Meier curves of association between body composition risk groups and progression-free survival.
We next performed MVA comparing patients with high versus low myosteatosis percentage dichotomized at a gender-specific optimal cutoff (male: 15.7%, female: 17.0%). Patients with high myosteatosis percentage had significantly shorter OS (HR, 2.85; p = .002), PFS (HR, 3.09; p < .001), and lower chance at CB (OR, 0.049; p = .034) compared with low myosteatosis percentage patients in MVA. Patients with high myosteatosis percentage had shorter median OS (5.2 versus 12.4 months; p = .0015) and PFS (2.1 versus 4.2 months; p = .0004) compared with low myosteatosis percentage patients per Kaplan-Meier estimation (supplemental online Fig. 1).
Prediction Performance Analysis
The C-statistics for body composition risk groups, myosteatosis percentage, BMI, and another model including body composition risk groups plus NLR and liver metastasis are presented in Table 3, and the receiver operating characteristic curve comparison between body composition and myosteatosis percentage, with BMI as the reference group, are presented in supplemental online Figures 2 and 3. The C-statistics for body composition risk groups were significantly higher for predicting OS (0.687 versus 0.504; p = .001) and CB (0.747 versus 0.509; p = .001) compared with BMI. Myosteatosis percentage was also significantly better at predicting CB than BMI (0.691 versus 0.509; p = .018). Both the body composition risk groups and myosteatosis analyses had higher C-statistics for PFS (risk groups, 0.667 versus 0.526; p = .127; myosteatosis, 0.594 versus 0.526; p = .261) than BMI. An additional model with our body composition risk groups plus NLR and liver metastasis had higher C-statistics for OS (0.737 versus 0.678; p = .169), PFS (0.689 versus 0.667; p = .688), and CB (0.768 versus 0.747; p = .276) compared with the risk group alone. However, the change in C-statistics for the risk groups with the addition of NLR and liver metastasis was not significant (Table 3).
Comparison of prediction performance between body composition risk groups, myosteatosis, and BMI
| Risk Scoring System | OS, C-statistic | p value | PFS, C-statistic | p value | CB, AUC | p value |
|---|---|---|---|---|---|---|
| Risk group | 0.687 | .001a | 0.667 | .127 | 0.747 | .001a |
| Myosteatosis | 0.600 | .101 | 0.594 | .261 | 0.691 | .018a |
| BMI | 0.504 | ref | 0.526 | ref | 0.509 | ref |
| Risk group + NLR + liver met | 0.737 | .169 (compared to risk group alone) | 0.689 | .688 (compared to risk group alone) | 0.768 | .276 (compare to risk group alone) |
a Statistically significant at the level of p < .05
Abbreviations: AUC, area under the curve; BMI, body mass index; CB, clinical benefit; C-statistic, Uno's concordance statistic; NLR, neutrophil-to-lymphocyte ratio; OS, overall survival; PFS, progression-free survival.
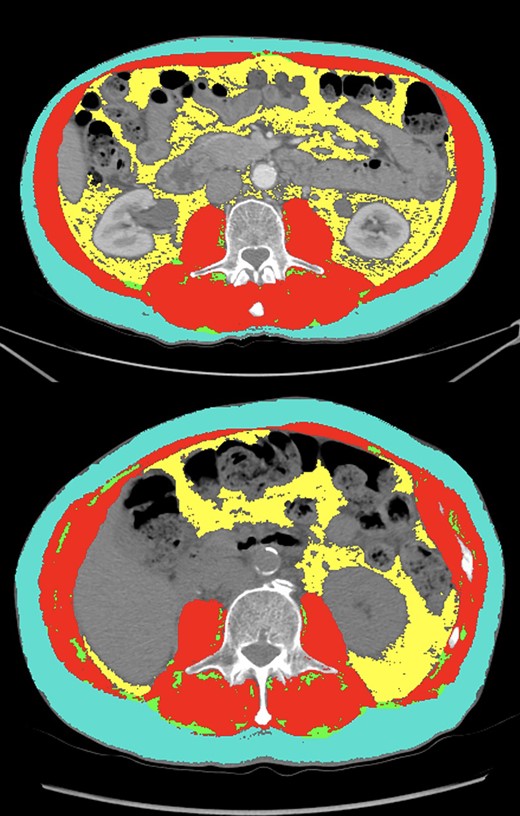
Comparison of segmentation results (teal: subcutaneous fat, red: skeletal muscle, green: intermuscular fat, yellow: visceral fat) between two patients with similar body mass index (BMI). The first patient (top panel) had a BMI of 25.3, skeletal muscle index (SMI) of 53.2 (high), a skeletal muscle (SM) mean of 51.1 (high) and myosteatosis percentage of 2.79% (low). This patient had a best response of complete response and continues to be progression-free 47 months after ICI initiation. The second patient (bottom panel) had a BMI of 23.6, an SMI of 39.6 (low), an SM mean of 29.2 (low), and myosteatosis of 8.89 % (high). This patient had progressive disease as their best radiographic response and passed away within 2 months of ICI initiation.
Discussion
The results from this study represent important contributions to the literature for patients with advanced UC treated with ICIs. We found that high SMI, attenuated SM mean, and VFI were associated with improved clinical outcomes among patients with UC treated with ICIs. Importantly, we created a new way to measure the quality of skeletal muscle: myosteatosis percentage. This variable was significantly associated with OS, PFS, and CB after controlling for several variables that reflect baseline disease activity. The C-statistics for our body composition risk groups and myosteatosis percentage were significantly higher than BMI, suggesting that these may have improved predictive value in this cohort of patients. Taken together, we have created a comprehensive method for measuring risk associated with body composition in patients with advanced UC treated with ICIs. Given the widespread use of ICIs in many malignancies, these findings may have broad clinical implications across the field of oncology.
Sarcopenia is defined as the loss of muscle tissue and is associated with normal aging [26]. This process can be accelerated in patients with proinflammatory conditions such as cancer [27]. Traditionally, sarcopenia is characterized as an SMI below gender-specific cutoffs, both in healthy patients and those with a primary malignancy [28, 29]. Several studies have found an association between sarcopenia, measured by decreased SMI, and outcomes in ICI-treated patients with cancer [30]. We have also previously shown that sarcopenia and inflammation had a combined effect on decreased survival in patients with advanced cancer [10]. In this study, our results show that decreased SMI was associated with worse outcomes in this cohort, which is consistent with previous findings. This study is novel in our findings related to sarcopenia in three ways: (a) we used three different variables (SMI, attenuated SM mean, and myosteatosis percentage) to quantify sarcopenia and myosteatosis, (b) we defined myosteatosis as a percentage of IFI compared with SMI, which is a new method for estimating myosteatosis, and (c) we found, for the first time, an association between sarcopenia and clinical outcomes in patients with UC in any setting. These findings suggest that attenuated SM mean and myosteatosis percentage may have a role as an adjunctive measure of skeletal muscle health in updated prognostic and predictive models for patients with cancer treated with ICIs. Future studies may consider including skeletal muscle gauge, which combines skeletal muscle index and density, as a marker for myosteatosis [31].
The prognostic utility of SMI, attenuated SM mean, and myosteatosis percentage are highlighted by comparing two patients in our study with similar BMI with disparate SMI, attenuated SM mean, and myosteatosis percentage values. A comparison of segmentation results between two patients with similar BMI and the same number and sites of metastatic disease (lymph node, liver, lung) are presented in Figure 3. The first patient (top panel) had a BMI of 25.3, SMI of 53.2 (high at optimal cut), attenuated SM mean of 51.1 (high at optimal cut), and myosteatosis of 2.79% (low at optimal cut). This patient experienced a best radiographic response of CR on atezolizumab and continues to have no evidence of disease 4 years after treatment-initiation. The second patient (bottom panel) had a BMI of 23.6, an SMI of 39.6 (low at optimal cut), an SM mean of 29.2 (low at optimal cut), and myosteatosis of 8.89% (high at optimal cut). In contrast to the first patient, who was categorized as low-risk in our body composition and myosteatosis analyses, this patient had progressive disease as their best radiographic response and passed away within 2 months of ICI initiation. These two patients with comparable baseline disease activity and BMI had significantly different clinical courses after ICI initiation. We hypothesize that their body composition may have played a role in their dissimilar clinical outcomes. This highlights the potential clinical impact of using multiple measures of skeletal muscle health as prognostic markers in patients with advanced UC treated with ICIs.
Adiposity, characterized by indices of each specific abdominal fat compartment, is another measure of body composition that may have utility as a prognosticator in oncology patients [32, 33]. This is a more detailed and comprehensive method of measuring risk associated with obesity compared with BMI. In a previous study, we showed that increased SFI and decreased IFI were associated with improved clinical outcomes in patients with advanced cancer treated with immunotherapy in phase 1 clinical trials [9]. This is the first study to find an association with VFI in patients with cancer treated with immunotherapy. One possible explanation for this is that cytokine expression is higher in visceral fat compared with subcutaneous fat [34]. Therefore, it is possible that oncology patients with elevated visceral fat may be more likely to respond to ICIs. The possible prognostic value of VFI is highlighted by a clinical comparison between two female patients in this study with similar BMI, SMI, SFI, but disparate VFI (Fig. 4). The first patient (top panel) had a BMI of 25.1, SMI of 50.37 (high at optimal cut), SFI of 45.98 (low at optimal cut), and VFI of 50.92 (high at optimal cut). This patient had PR as their best response and remains progression-free 15.8 months after starting ICI. The second patient (bottom panel) had a BMI of 26.5, SMI of 52.2 (high at optimal cut), and SFI of 50.2 (low at optimal cut), but a VFI of 30.16 (low at optimal cut). In contrast to the first patient, this patient experienced radiographic progression on their first restaging scan and passed away within 3 months of ICI initiation. This highlights our findings that VFI may have a role as an adjunctive prognostic biomarker of body composition in patients with advanced UC treated with ICIs.
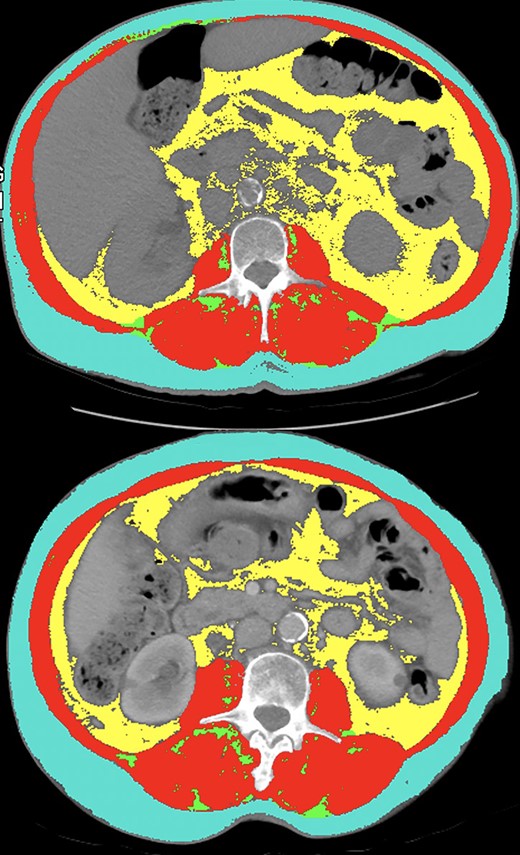
Comparison between two female patients in this study with similar body mass index, (BMI), skeletal muscle index (SMI; red), subcutaneous fat index (SFI; teal), but disparate visceral fat index (VFI; yellow). The first patient (top panel) had a BMI of 25.1, SMI of 50.37 (high), SFI of 45.98 (low), and VFI of 50.92 (high). This patient had partial response as their best response and remains progression-free for 15.8 months. The second patient (bottom panel) had a BMI of 26.5, SMI of 52.2 (high), SFI of 50.2 (low) and VFI of 30.16 (low). This patient experienced radiographic progression on their first restaging scan and passed away within 3 months of ICI initiation.
The results that we presented in this study support the consideration of body composition measures such as SMI, attenuated SM mean, VFI, or myosteatosis percentage in updated prognostic models for patients with advanced UC treated with ICIs. Sonpavde et al. provided a five-factor prognostic model (presence of liver metastases, baseline neutrophil-to-lymphocyte count, platelets, lactate dehydrogenase, and ECOG PS) for survival of patients with metastatic UC receiving PD-L1 inhibitors after progressing on platinum-based chemotherapeutic regimens [35]. In a study of 67 patients with UC treated with ICIs, Shabto et al. found that ECOG PS, presence of liver metastases, baseline platelet-to-lymphocyte ratio, and baseline albumin were prognostic biomarkers of responses [36]. Our risk scoring system had C-statistics of 0.687 for predicting OS and 0.667 for predicting PFS, which was similar to the concordance reported in these previous studies. Importantly, the C-statistic of our model for predicting CB was 0.747, which suggests that body composition may be an effective way to predict which patients with UC may derive CB from ICIs. Taken together, we have created a risk scoring system based on body composition biomarkers derived from baseline CT scans that may be used to help predict clinical outcomes in patients with UC treated with ICIs.
Although these hypothesis-generating results may have clinical utility for medical oncologists considering starting patients with advanced UC on treatment with ICIs, there are limitations that should be mentioned. This is a retrospective study subject to selection bias; however, we did include all patients with advanced UC with available CT scans within 2 months of ICI initiation regardless of their clinical outcomes. It is possible that differences may exist between patients who had CT scans available at baseline and those who were excluded from the study because they had magnetic resonance imaging (MRI) scans at baseline. We aim to validate our findings from this study in patients who had baseline MRI imaging in a future study. There are possibly additional confounding variables that were not measured in this study including nutritional status and other comorbidities. However, we included several possible confounding variables in our MVA including age, race, functional and performance status (ECOG PS), cancer burden (liver metastasis, number of prior lines of therapy), and NLR based on our clinical judgement and prior studies investigating prognostic risk factors in ICI-treated patients with urothelial carcinoma [35, 36]. Given that these scans were manually segmented using SliceOMatic, there is possibly human error in the analysis of the CT images. We attempted to mitigate this by only having one, well-trained author (D.J.M.) analyze every scan included in the analysis. Future studies may also investigate the change in body composition variables while on treatment as a possible prognostic biomarker of response to ICIs in patients with urothelial cancer. These radiological measurements are costly, require training, and are not currently readily available for medical oncologists when starting patients with advanced UC on treatment with ICIs. With these limitations in mind, larger prospective studies are needed to validate the important findings presented in this retrospective analysis.
Conclusion
Body composition variables such as SMI, SM mean, VFI, and myosteatosis percentage may have value in updated prognostic and predictive models of clinical outcomes in ICI-treated patients with advanced UC. Larger prospective studies are warranted to validate this hypothesis-generating data.
Acknowledgments
The data reported in this article were presented as a poster presentation at the 2020 SITC Annual Meeting. Research reported in this publication was supported in part by the Biostatistics Shared Resource of Winship Cancer Institute of Emory University and the National Institutes of Health/National Cancer Institute under award number P30CA138292. The content is solely the responsibility of the authors and does not necessarily represent the official views of the National Institutes of Health. The study was approved by the Emory University Institutional Review Board and was conducted in accordance with Good Clinical Practice Guidelines and the Declaration of Helskinki.
Author Contributions
Conception/design: Dylan J. Martini, Subir Goyal, Yuan Liu, Mehmet Asim Bilen
Provision of study material or patients: Deepak Ravindranathan, Jacqueline T. Brown, Lauren Yantorni, Greta Anne Russler, Sarah Caulfield, Jamie M. Goldman, Bassel Nazha, Shreyas Subhash Joshi, Haydn T. Kissick, Kenneth E. Ogan, Wayne B. Harris, Omer Kucuk, Bradley C. Carthon, Viraj A. Master, Mehmet Asim Bilen
Collection and/or assembly of data: Dylan J Martini, Julie M. Shabto, T. Anders Olsen, Sean T. Evans, Benjamin L. Magod
Data analysis and interpretation: Dylan J. Martini, Subir Goyal, Yuan Liu, Mehmet Asim Bilen
Manuscript writing: Dylan J. Martini, Subir Goyal, Yuan Liu, Mehmet Asim Bilen
Final approval of manuscript: Dylan J. Martini, Julie M. Shabto, Subir Goyal, Yuan Liu, T. Anders Olsen, Sean T. Evans, Benjamin L. Magod, Deepak Ravindranathan, Jacqueline T. Brown, Lauren Yantorni, Greta Anne Russler, Sarah Caulfield, Jamie M. Goldman, Bassel Nazha, Shreyas Subhash Joshi, Haydn T. Kissick, Kenneth E. Ogan, Wayne B. Harris, Omer Kucuk, Bradley C. Carthon, Viraj A. Master, Mehmet Asim Bilen
Disclosures
Bradley C. Carthon: Astellas Medivation, Pfizer, Blue Earth Diagnostics (C/A), Bristol-Myers Squibb (Travel); Mehmet Asim Bilen: Exelixis, Bayer, Bristol-Myers Squibb, Eisai, Pfizer, AstraZeneca, Janssen, Calithera Biosciences, Genomic Health, Nektar, Sanofi (C/A), Xencor, Bayer, Bristol-Myers Squibb, Genentech/Roche, Seattle Genetics, Incyte, Nektar, AstraZeneca, Tricon Pharmaceuticals, Genome & Company, AAA, Peloton Therapeutics, Pfizer (RF [institution]). The other authors indicated no financial relationships.
(C/A) Consulting/advisory relationship; (RF) Research funding; (E) Employment; (ET) Expert testimony; (H) Honoraria received; (OI) Ownership interests; (IP) Intellectual property rights/inventor/patent holder; (SAB) Scientific advisory board
References
Drugs@FDA: FDA-approved drugs. U.S. Food and Drug Administration Web site. Available at http://www.accessdata.fda.gov/scripts/cder/daf. Accessed September 11, 2020.
Author notes
Disclosures of potential conflicts of interest may be found at the end of this article.
