


Abstract
This work examined the association between pregnancy after breast cancer (BC) diagnosis and total mortality in Taiwanese patients with BC.
The Taiwan Cancer Registry, National Health Insurance database, and Taiwan National Death Certificate database were reviewed. Patients who became pregnant after being diagnosed with BC were selected (n = 249). Four nonpregnant patients with BC were selected and matched to every pregnant patient with BC by age at diagnosis, year at diagnosis, and propensity score based on disease stage, tumor size, node involvement, and histological grade. The disease‐free time interval for the selected control needed to have been longer than the time interval between the cancer diagnosis and pregnancy for the index case. Follow‐up was calculated from the pregnancy date of the index case to the date of death or December 31, 2014, whichever came first. Cox proportional hazards models were used to estimate the hazard ratios (HRs) and 95% confidence intervals (CIs).
After adjusting for age, year at BC diagnosis, stage, positive nodes, and hormone therapy, patients with BC who became pregnant after their cancer diagnosis had lower total mortality than did the comparison group (HR = 0.44, 95% CI = 0.23–0.84), including that of estrogen receptor‐positive patients (HR = 0.23, 95% CI = 0.07–0.77). The inverse association was more pronounced for those who became pregnant more than 3 years after diagnosis (HR = 0.19, 95% CI = 0.05–0.78).
Our nationwide retrospective analysis revealed that pregnancy after BC diagnosis was associated with lower mortality than that of nonpregnant patients with BC at a similar age, year at diagnosis, and clinical characteristics.
Implications for Practice
This article provides high‐level evidence based on an Asian population for pregnancy counseling after a breast cancer diagnosis, including for patients with estrogen receptor‐positive cancers. The study also revealed the optimal time for patients who would like to become pregnant after breast cancer.
Introduction
Breast cancer incidence is increasing in East Asia, including Taiwan. Birth cohort exposures, including the rapid assimilation of the Western lifestyle by the more recent birth cohort, delayed childbearing, low parity, and reduced breastfeeding, are thought to be the major determinants of the increased incidence of breast cancer in younger generations in East Asian countries [1–3].
In Taiwan, the breast cancer incidence rate before age 50 was 8.4/100,000 in 1981–1985. The rate has increased to 31.2/100,000 in 2011–2015. In 2015, the median age at breast cancer diagnosis was 54 years, and approximately 36% of women were diagnosed before 50 years of age. Over the past decade, the 5‐year relative survival for breast cancer has increased from 83.9% in 2002–2006 to 88.1% in 2011–2015 [4]. However, the fertility rate decreased from 1.6 in 1999 to 1.1 in 2015, while the average age at first childbirth increased from 27 years in 1999 to 31 years in 2015 [5]. With the increasing incidence and improved prognosis for breast cancer, as well as delayed childbearing, physicians and care providers will likely see patients and families struggling between surviving cancer and building a family.
A prior study has explored the risk–benefit perceptions of pregnancy among breast cancer survivors in Taiwan [6], and “reaching the balance of life” was the core value when patients weighed the risks and gains of pregnancy. On one hand, the patients often became exhausted after chemotherapy and were uncertain about the safety of pregnancy for their health. They also worried about whether chemotherapy might harm the future baby. On the other hand, raising children would bring hope and happiness to their family. In Chinese culture, some women desire children because they expect their children to care for them when they become old, and this concept may be important for East Asian countries that share this culture of filial piety, such as Korea, Japan, Vietnam, and China.
In a subsequent study on fertility [7], 13 patients (70%) hoped to maintain reproductive function and 4 participants acquired relevant information about fertility preservation techniques and its pros and cons to the health of the mother and baby. None of the participants in this study took fertility‐preserving actions before treatment, which the authors suggested might be because of the possible invasive damage to the participants’ physical health and threat to their life if they delayed cancer treatment. Forgoing fertility preservation to have a better chance of survival was the major reason. In both these studies [6, 7], the authors indicated that a high level of evidence is necessary for more effective pregnancy counseling for women who wish to conceive after being diagnosed with breast cancer.
Currently, most epidemiological data confirm that pregnancy after breast cancer is safe for mothers [8–11], even for those with estrogen receptor‐positive (ER+) cancers [12–14]. In general, clinicians recommend that patients wait at least 2 years after their diagnosis before getting pregnant [10, 11]. A recent study suggested that the timing can be shortened to 6 months after the diagnosis [15]. Most of these studies were conducted in the U.S. or Europe; however, to our knowledge, no published studies have reported the safety of pregnancy after breast cancer diagnosis in Asian populations.
Therefore, we conducted this study to examine the association between pregnancy after breast cancer and total mortality in an Asian population. We also explored the relationship between the timing of the pregnancy and breast cancer survival.
Materials and Methods
Study Population
The study population was selected as described previously [16]. Briefly, patients with breast cancer were selected from the Taiwan Cancer Registry (TCR). The inclusion criteria were (a) stage I–III first primary invasive breast cancer; (b) age at diagnosis between 20 and 50 years; and (c) diagnosed between 2002 and 2014. Tumor characteristics (stage, size, positive nodes, histological grade, estrogen receptor [ER] status, progesterone receptor [PR] status, and human epidermal growth receptor 2 [HER2] status), types and dates of the treatments (surgery, radiotherapy, chemotherapy, and hormone therapy), recurrence status, and date of recurrence were recorded (n = 30,479). The pregnancy records, delivery outcomes, and chemotherapy drugs were retrieved from the Taiwan National Health Insurance (NHI) database. A pregnancy event was defined as having prenatal examinations or a history of delivery or abortion. The prenatal examinations were covered by the NHI program, and 98% of mothers underwent at least four examinations [17]. Pregnancy dates were calculated from the prenatal examination dates and the dates of delivery or abortion.
Patients with breast cancer who became pregnant after their cancer diagnosis (BCPPs) were selected (n = 249). Patients who were diagnosed during pregnancy or had a recent pregnancy record of <5 years before their cancer diagnosis were excluded (n = 2,430). A propensity score for pregnancy was created according to disease stage, tumor size, node involvement, and histological grade. Four comparison patients with no pregnancy records for 5 years prior to, during, and after cancer diagnosis were selected from the remaining patients and matched to each BCPP. The comparison patients were matched to the BCPPs on age at diagnosis (±2 years), year at diagnosis (±1 year), and propensity score for pregnancy. To control for the healthy mother effect, comparison patients must have had a longer disease‐free time interval than the time interval between cancer diagnosis and pregnancy of the index BCPPs. Comparison patients were assigned an index date, which was defined as the pregnancy date of the index BCPPs. Disease‐free status was checked using the recurrence status and date in the TCR and the following criteria from the NHI database: (a) those with ER‐negative (ER−) tumors and who began chemotherapy 1 year after diagnosis, or (b) those with ER+ tumors and who had changed chemotherapy drugs. These criteria were discussed with the collaborative doctors (C.‐H.L. and Y.‐S.L.) based on their experience in practice. Selected comparison patients with any of these conditions before the index date were removed from the comparison group. The final data included 249 pregnant and 914 nonpregnant patients.
The study was based on secondary data analysis. The clinical characteristics of the diagnosed cancer and treatment for the selected patients were retrieved from the TCR and NHI databases. The vital status, causes, and date of death were retrieved from the Taiwan National Death Certificate database. The ethical review board of the National Health Research Institutes, Taiwan, approved the study.
Statistical Analysis
The length of follow‐up was calculated from the pregnancy date (or index date for the controls) to the date of death or December 31, 2014, whichever came first. Multivariate Cox proportional hazards models were used to estimate hazard ratios (HRs) and 95% confidence intervals (CIs) for the association between pregnancy and overall survival. The confounding factors under consideration were age at breast cancer diagnosis, year of breast cancer diagnosis, stage, tumor size, lymph node involvement, histological grade, ER status, PR status, surgery types, radiotherapy, chemotherapy, and hormone therapy. Because no HER2 status could be determined for 89% of the selected patients, HER2 status was not assessed as a potential confounder. However, when all variables were included in the model, only age at breast cancer diagnosis, year of breast cancer diagnosis, stage, lymph node involvement, and hormone therapy remained statistically significant at α = 0.1. Thus, only these five variables were used in the final model. Because age at diagnosis can directly affect overall survival, we adjusted for age using stratification.
Analyses were performed using SAS 9.4 (SAS Institute, Cary, NC). All tests were two‐sided, and statistical significance was considered at p < .05.
Results
Table 1 shows the clinical characteristics of the BCPPs and comparison patients. After propensity score matching, the BCPP and comparison group had similar disease stages, tumor size, node involvement, and histological grades. For those with a known ER status, 65.4% in the BCPP group and 68.5% in the comparison group were ER+ (p = .50). The BCPP were more likely than were the comparison patients to have had conservative breast treatments and less likely to have had chemotherapy or hormone therapy. Overall, 12 BCPPs (4.8%) and 69 comparison group patients (7.5%) died during the observation period.
Characteristics of BCPPs and the comparison group
| Characteristics | Comparison group | BCPP group | p value | ||
|---|---|---|---|---|---|
| n | % | n | % | ||
| Total | 914 | 249 | |||
| Age at breast cancer diagnosis, mean (SD), years | 32.26 | (4.2) | 31.04 | (4.2) | <.01 |
| Years of follow‐up, mean (SD) | 3.81 | (2.6) | 4.28 | (2.6) | .01 |
| No. of deaths | 69 | 12 | 4.82 | ||
| Age at death, mean (SD), years | 36.47 | (5.1) | 35.93 | (4.5) | .81 |
| Years between diagnosis and pregnancy, mean (SD) | 3.31 (2.1) | ||||
| Year of breast cancer diagnosis | |||||
| 2002–2004 | 154 | 16.9 | 66 | 26.5 | .01 |
| 2005–2007 | 336 | 36.8 | 78 | 31.3 | |
| 2008–2010 | 322 | 35.2 | 84 | 33.7 | |
| 2011–2014 | 102 | 11.2 | 21 | 8.4 | |
| Stage | |||||
| I | 438 | 47.9 | 126 | 50.6 | .75 |
| II | 439 | 48.0 | 113 | 45.4 | |
| III | 37 | 4.1 | 10 | 4.0 | |
| Tumor size, cm | |||||
| ≤2 | 505 | 55.3 | 150 | 60.2 | .46 |
| 2–5 | 354 | 38.7 | 87 | 34.9 | |
| >5 | 40 | 4.4 | 10 | 4.0 | |
| No information | 15 | 1.6 | 2 | 0.8 | |
| Positive nodes | |||||
| 0 | 657 | 71.9 | 173 | 69.5 | .13 |
| 1‐3 | 146 | 16.0 | 34 | 13.7 | |
| 4‐9 | 40 | 4.4 | 15 | 6.0 | |
| ≥10 | 25 | 2.7 | 5 | 2.0 | |
| No information | 46 | 5.0 | 22 | 8.8 | |
| Histological grade | |||||
| Well differentiated | 146 | 16.0 | 40 | 16.1 | .27 |
| Moderately differentiated | 340 | 37.2 | 97 | 39.0 | |
| Poorly or undifferentiated | 325 | 35.6 | 75 | 30.1 | |
| No information | 103 | 11.3 | 37 | 14.9 | |
| Hormone receptor status | |||||
| ER status | |||||
| ER− | 143 | 31.5 | 46 | 34.6 | .50 |
| ER+ | 311 | 68.5 | 87 | 65.4 | |
| No information | 460 | 116 | |||
| PR status | |||||
| PR− | 181 | 39.9 | 50 | 37.6 | .64 |
| PR+ | 273 | 60.1 | 83 | 62.4 | |
| No information | 460 | 116 | |||
| HER2 status | |||||
| HER2− | 71 | 74.0 | 17 | 81.0 | .50 |
| HER2+ | 25 | 26.0 | 4 | 19.0 | |
| No information | 818 | 228 | |||
| Treatmenta | |||||
| Surgery | |||||
| None | 20 | 2.2 | 19 | 7.6 | <.01 |
| Breast conserving | 512 | 56.0 | 148 | 59.4 | |
| Mastectomy | 379 | 41.5 | 81 | 32.5 | |
| Radiotherapy | 394 | 43.1 | 120 | 48.2 | .43 |
| Chemotherapy | 670 | 73.3 | 148 | 59.4 | <.01 |
| Hormone therapy | 535 | 58.5 | 111 | 44.6 | <.01 |
aTreatment status during the first year of the diagnosis.
Abbreviations: BCPP, patients with breast cancer with a pregnancy after cancer diagnosis; ER, estrogen receptor; HER2, human epidermal growth receptor 2; PR, progesterone receptor.
Overall survival was similar among the BCPPs and the comparison group patients (log‐rank p = .06; Fig. 1). However, the differences were more evident in ER+ patients (log‐rank p = .03; Fig. 2) but not statistically significant for ER− patients (log‐rank p = .26; Fig. 3). After adjusting for age, year at breast cancer diagnosis, stage, positive nodes, and hormone therapy, BCPP had lower total mortality than did the comparison group (HR = 0.44, 95% CI = 0.23–0.84; Table 2). The inverse association was particularly evident for those who had waited to become pregnant for 3 years or more after the breast cancer diagnosis (HR = 0.19, 95% CI = 0.05–0.78). In addition, those who completed their pregnancy had lower mortality (HR = 0.40, 95% CI = 0.20–0.82), whereas patients who had spontaneous or induced abortions had similar mortality rates to those of the comparison group (HR = 0.73, 95% CI = 0.17–3.03).
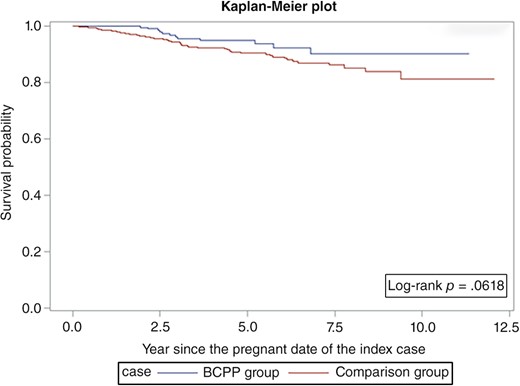
Survival curves for BCPPs and the comparison group.
Abbreviation: BCPP, patients with breast cancer who became pregnant after their cancer diagnosis.
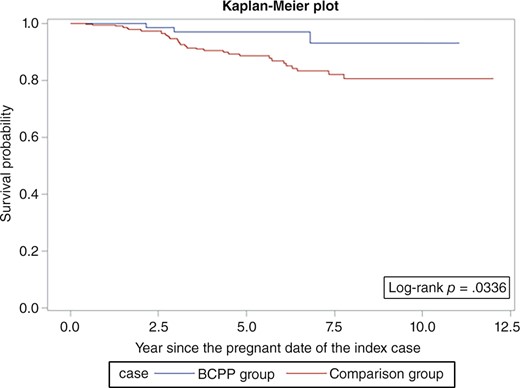
Survival curves for patients with estrogen receptor‐positive breast cancer who became pregnant after cancer diagnosis and the comparison group.
Abbreviation: BCPP, patients with breast cancer who became pregnant after their cancer diagnosis.
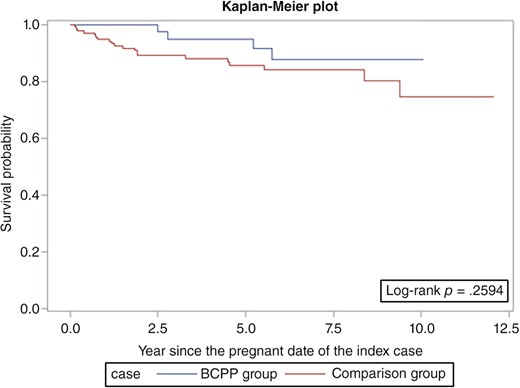
Survival curves for patients with estrogen receptor‐negative breast cancer who became pregnant after cancer diagnosis and the comparison group.
Abbreviation: BCPP, patients with breast cancer who became pregnant after their cancer diagnosis.
Association between pregnancy after breast cancer diagnosis and total mortality
| BCPP status | Total no. | Death no. | HRa | 95% CI |
|---|---|---|---|---|
| Comparison group | 914 | 69 | 1.00 | |
| BCPP group | 249 | 12 | 0.44 | (0.23, 0.84) |
| By year between diagnosis and pregnancy | ||||
| Control group | 914 | 69 | 1.00 | |
| <1 year | 28 | 4 | 0.84 | (0.25, 2.81) |
| ≥1 to <2 years | 40 | 4 | 0.70 | (0.24, 2.02) |
| ≥2 to <3 years | 63 | 2 | 0.40 | (0.10, 1.63) |
| ≥3 years | 118 | 2 | 0.19 | (0.05, 0.78) |
| p for trend | 0.01 | |||
| By pregnancy outcomes | ||||
| Control group | 914 | 69 | 1.00 | |
| Completed pregnancy | 219 | 9 | 0.40 | (0.20, 0.82) |
| Spontaneous or induced abortion | 30 | 3 | 0.73 | (0.17, 3.03) |
aHazard ratios were adjusted for age and year of diagnosis, stage, nodal status, and hormone therapy.
Abbreviations: BCPP, patients with breast cancer with a pregnancy after cancer diagnosis; CI, confidence interval; HR, hazard ratio.
Pregnancy was generally associated with lower total mortality in all subgroup analyses (Table 3), but the evidence was more pronounced in patients who were younger than 30 years (HR = 0.29, 95% CI = 0.10–0.88), were at stage II or III (HR = 0.37, 95% CI = 0.16–0.82), had ER+ disease (HR = 0.23, 95% CI = 0.07–0.77), had received chemotherapy (HR = 0.40, 95% CI = 0.18–0.90), or did not receive hormone therapy (HR = 0.40, 95% CI = 0.17–0.91).
Subgroup analysis of the association between pregnancy after breast cancer diagnosis and total mortality
| Comparison group | BCPP group | |||||
|---|---|---|---|---|---|---|
| Subgroups | Total no. | Death no. | Total no. | Death no. | HRa | 95% CI |
| By ER status | ||||||
| ER− | 143 | 20 | 46 | 4 | 0.38 | (0.12, 1.24) |
| ER+ | 311 | 32 | 87 | 3 | 0.23 | (0.07, 0.77) |
| No information | 460 | 17 | 116 | 5 | 0.94 | (0.31, 2.89) |
| By hormone therapy | ||||||
| No | 379 | 40 | 138 | 9 | 0.40 | (0.17, 0.91) |
| Yes | 535 | 29 | 111 | 3 | 0.46 | (0.15, 1.38) |
| By chemotherapy | ||||||
| No | 244 | 16 | 101 | 5 | 0.48 | (0.15, 1.56) |
| Yes | 670 | 53 | 148 | 7 | 0.40 | (0.18, 0.90) |
| By age at diagnosis, years | ||||||
| <30 | 241 | 25 | 96 | 4 | 0.29 | (0.10, 0.88) |
| ≥30 to <35 | 417 | 31 | 105 | 5 | 0.49 | (0.18, 1.31) |
| ≥35 | 256 | 13 | 48 | 3 | 0.44 | (0.09, 2.31) |
| By stage at diagnosis | ||||||
| I | 438 | 16 | 126 | 4 | 0.39 | (0.11, 1.41) |
| II and III | 476 | 53 | 123 | 8 | 0.37 | (0.16, 0.82) |
| By positive nodes | ||||||
| 0 | 657 | 32 | 173 | 6 | 0.62 | (0.25, 1.52) |
| 1–3 | 146 | 14 | 34 | 3 | 0.68 | (0.17, 2.66) |
| ≥4 | 65 | 20 | 20 | 2 | 0.31 | (0.07, 1.47) |
aHazard ratios were adjusted for age and year of diagnosis, stage, nodal status, and hormone therapy, where appropriate.
Abbreviations: BCPP, patients with breast cancer with a pregnancy after cancer diagnosis; CI, confidence interval; ER, estrogen receptor; HR, hazard ratio.
Discussion
Among the 30,479 female patients with breast cancer in Taiwan, 249 became pregnant after their cancer diagnosis, representing a < 1% prevalence in patients aged 20–50 years diagnosed between 2002 and 2014. The BCPP had lower mortality than did their matched controls (HR = 0.44, 95% CI = 0.23–0.84), and the ER+ patients (HR = 0.23, 95% CI = 0.07–0.77). The inverse association was more pronounced for those who waited more than 3 years after their breast cancer diagnosis (HR = 0.19, 95% CI = 0.05–0.78).
The safety of pregnancy for patients with breast cancer has been confirmed in several epidemiological observational studies and meta‐analyses [8–11], 18]. A meta‐analysis of 14 studies demonstrated a 41% reduced risk of death for pregnant women with a history of breast cancer [11]. Another meta‐analysis that pooled results from nine studies that used matching to control for “healthy mother effects” suggested a hazard ratio for death of 0.51 (95% CI = 0.42–0.62) [18]. Nevertheless, another small‐scale observational study suggested that mental health, rather than physical health, may play a role in the healthy mother effects [19]. However, safety remains a concern for ER+ patients. A U.S. study on patients with ER+ breast cancer found no difference in the 5‐year disease‐free survival rate between pregnant and nonpregnant cohorts (p = .34) [12]. Another international multicenter study [13, 14] further demonstrated no disease‐free survival differences between pregnant and nonpregnant cohorts in both ER+ (HR = 0.94, 95% CI = 0.70–1.26) and ER− patients (HR = 0.75, 95% CI = 0.53–1.06). The latter study [14] also suggested statistically significant better overall survival in the pregnant cohort for ER− patients (HR = 0.57, 95% CI = 0.36–0.90).
In our study, we observed a better overall survival in the pregnant cohort for ER+ patients and no difference for ER− patients (Figs. 2, 3; Table 3). Although we attempted to control for the healthy mother effect by matching the propensity score and time to pregnancy in the control selection, the healthy mother effect may remain a concern if a prepregnancy evaluation was performed [20]. The healthy mother effect may be stronger in ER+ patients, because the detrimental effects of hormone simulation during pregnancy are of particular concern for ER+ patients. Nevertheless, studies on breast cancer during pregnancy have also suggested that maternal immunity is stimulated against cancer cells during pregnancy, which is known as the “fetal antigen hypothesis” [21]. Furthermore, the high levels of estrogen, progesterone, and human gonadotropin during pregnancy may induce apoptosis in endocrine‐responsive breast cancer cells [22–24]. These hypotheses suggest that pregnancy might not be detrimental for patients with a history of breast cancer.
For a patient with breast cancer who wishes to conceive, the current recommendation is to wait for at least 2 years from the time of breast cancer diagnosis [10, 11]. This recommendation was based on positive results from observational studies of patients who became pregnant after breast cancer, the high incidence of tumor recurrence during the first 2 years [25], and the time window that allows patients to recover from chemotherapy‐induced ovarian toxicity [26]. Our study suggested that the risk of death decreased as patients waited longer between diagnosis and pregnancy (p = .01), particularly for those who waited more than 3 years (Table 2). The abortion rate in our cohort was approximately 12% (30/249), which was lower than that in studies from Western countries [12, 13], [17, 28]. This may be because of the cultural stigma concerning infertility and the traditional value of family in Taiwan. Patients who strongly wanted a child would attempt to conceive after cancer treatment regardless, whereas those who were hesitant or believed pregnancy to be harmful for survival may have decided against becoming pregnant [7]. Nevertheless, no evidence suggested that spontaneous or induced abortion was associated with increased or decreased mortality in our study.
Our study had some limitations. First, although we ensured the disease‐free status for the selected comparison group, we could not completely rule out the possibility of the healthy mother effect. Second, the recurrence status might not have been completed in the cancer registry; however, we tried to amend this limitation using additional data from the drug database of the NHI. Third, half of our patients lacked an ER status in their record. However, the data still revealed an inverse association between a subsequent pregnancy and total mortality in ER+ patients. Finally, although we included a nationwide database, events remained limited over the 13‐year observation period. However, this may reassure patients that pregnancy is safe after breast cancer.
Currently, no guideline exists against pregnancy after breast cancer in Western countries. The American Society of Clinical Oncology indicates that pregnancy after cancer treatment is safe for both mothers and babies, and pregnancy does not increase the risk of recurrence. However, the wait time depends on the cancer type and stage, the treatment type, the need for ongoing treatment, age, and personal preferences [29]. The National Comprehensive Cancer Network clinical practice guidelines in oncology suggest that all premenopausal patients should be counseled regarding their desire for future pregnancy. Patients who desire future pregnancy should be referred to fertility specialists before cancer treatment [30]. The European Society for Medical Oncology does not discourage pregnancy after breast cancer irrespective of ER status. Inducing abortion does not affect breast cancer prognosis; thus, it is discouraged for purposes of attempting to change the cancer prognosis [31].
Conclusion
In general, our conclusions are consistent with the aforementioned guidelines. We observed that subsequent pregnancy and total mortality were inversely associated in patients with breast cancer, even ER+ patients. Patients who completed pregnancy also had lower total mortality. The evidence was more pronounced for those who waited more than 3 years after their cancer diagnosis to become pregnant. Our nationwide retrospective analysis indicated that pregnancy after a breast cancer diagnosis was associated with lower mortality compared with that in a group of matched patients with similar ages, years at diagnosis, and clinical characteristics in Taiwan.
Acknowledgments
This study was supported by the National Health Research Institutes (PH‐105‐PP‐15) and by the Ministry of Science and Technology (MOST‐105‐2314‐B‐400‐013). The funders had no role in study design, data collection and analysis, decision to publish, or preparation of the manuscript.
Author Contributions
Conception/design: Ching‐Hung Lin, Yen‐Shen Lu
Provision of study material or patients: Shu‐Chun Chuang, Chao Agnes Hsiung
Collection and/or assembly of data: Shu‐Chun Chuang, Chao Agnes Hsiung
Data analysis and interpretation: Shu‐Chun Chuang, Ching‐Hung Lin, Yen‐Shen Lu, Chao Agnes Hsiung
Manuscript writing: Shu‐Chun Chuang, Ching‐Hung Lin, Yen‐Shen Lu, Chao Agnes Hsiung
Final approval of manuscript: Shu‐Chun Chuang, Ching‐Hung Lin, Yen‐Shen Lu, Chao Agnes Hsiung
Disclosures
The authors indicated no financial relationships.
References
NCCN Clinical Practice Guidelines in Oncology ‐ Breast Cancer. National Comprehensive Cancer Network
Author notes
Disclosures of potential conflicts of interest may be found at the end of this article.
