


Abstract
Canada has an established publicly funded health care system with a complex drug approval and funding process. After proof of efficacy (POE; key publication/presentation) and before becoming publicly accessible, each drug undergoes a Health Canada approval process, a health technology assessment (HTA), a pricing negotiation, and finally individual provincial funding agreements. We quantified potential life‐years lost during this process.
We analyzed drugs for advanced lung, breast, and colorectal cancer that underwent the HTA process between 2011 and 2016. Life‐years lost were calculated by multiplying documented improvement in progression‐free and overall survival, number of eligible patients, and time from POE to first public funding. For conservative calculation, we assumed all eligible patients in Canada had access at the time of first public funding, whereas in reality provinces fund at different time points.
We analyzed 21 drugs. Of these, 15 have been funded publicly. The time from POE to first public funding ranged from 14.0 to 99.2 months (median 26.6 months). Total overall life‐years lost from POE to first public funding were 39,067 (lung 32,367; breast 6,691). Progression‐free life‐years lost from POE to first public funding were 48,037 (lung 9,139, breast 15,827, colorectal 23,071).
The number of potential life‐years lost during the drug regulatory and funding process in Canada is substantial, largely driven by delays to funding of colorectal cancer drugs. Recognizing that interprovincial differences exist and that eligible patients may not all receive a given drug, if even a fraction does so, the impact of delays remains substantive. Collaborative national initiatives are required to address this major barrier to treatment access.
Implications for Practice
Patients may spend lengthy periods of time awaiting access to new and effective cancer drugs. Patients with private drug insurance or personal funds or who reside in certain Canadian provinces may obtain some drugs sooner than others, potentially creating a two‐tiered access system. The cancer drug access and public funding system must be expedited to improve equity.
Introduction
It is estimated that one in two Canadians will receive a diagnosis of cancer in their lifetime and that one in four Canadians will die of cancer [1]. Frequently, cancer is diagnosed as advanced disease [1]. Substantial advances in our understanding of cancer biology and treatment have improved survival rates for patients with advanced malignancy [2]. However, stringent regulations may limit or delay access to new, effective cancer therapies [3]. Previous literature demonstrates that for 21 drugs effective in advanced malignancies, 1 life‐year is lost worldwide for every 12‐second delay from the time of drug discovery to approval by the U.S. Food and Drug Administration [4].
Canada has a publicly funded health care system with a unique and complex cancer drug regulatory and funding process. After a cancer drug is shown to be effective in a clinical trial, it must receive Health Canada approval to be marketed in Canada. The Patented Medicines Prices Review Board ensures that the prices of patented drugs in Canada are not excessive [5]. With Health Canada approval, the drug can be sold in Canada but is not publicly reimbursed by the provincial or territorial payers. Before the provinces and territories of Canada make a decision on whether or not they will publicly fund a cancer drug, the drug undergoes a health technology assessment (HTA) by the pan‐Canadian Oncology Drug Review (pCODR) [6]. The goal of the pCODR HTA is to make a nonbinding, evidence‐based funding recommendation to the provinces and territories of Canada (except Quebec, whose Institut National d'Excellence en Sante et en Services Sociaux undertakes a different process). Ultimately, pCODR makes a final funding recommendation, which can be a recommendation to fund the drug, to fund conditionally, or to not fund the drug. Subsequently, the pan‐Canadian Pharmaceutical Alliance negotiates pricing with the manufacturer. Finally, each province or territory makes an independent decision as to whether or not it will publicly reimburse the drug by considering the pCODR recommendation and also its own priorities, mandates, and budget.
Recognizing that the cancer drug approval and funding process in Canada takes time during which patients with advanced cancer may not have public access to new life‐prolonging drugs, we calculated the potential life‐years lost during this process in Canada.
Materials and Methods
We calculated potential life‐years lost during the cancer drug approval and funding process in Canada from the time each drug was shown to be effective in a positive clinical trial to the first provincial public reimbursement.
The local research ethics board was consulted and determined that its approval was not needed for this study because all data points collected and analyzed were publicly available.
Endpoints
The primary endpoints were the total number of overall survival (OS) and progression‐free survival (PFS) life‐years lost from proof of efficacy to first public reimbursement.
Secondary endpoints included (a) the total number of OS and PFS life‐years lost from proof of efficacy to completion of the HTA and (b) time intervals from proof of efficacy to HTA submission, HTA submission to HTA completion, HTA completion to first public reimbursement, and from first to last provincial funding.
Eligibility Criteria
Drugs that were eligible for inclusion were all drugs used in the treatment of advanced lung, breast, and colorectal cancer submitted to the pCODR HTA from January 2011 to December 2016. All drugs required a documented statistically significant improvement in OS and/or PFS in comparison to the control arm in a randomized trial. Although drugs submitted to the pCODR HTA after December 2016 were not included in the analysis, data points for all included drugs were updated and current as of July 2018.
Calculating Life‐Years Lost
To calculate the number of potential life‐years lost during the cancer drug regulatory and funding process, we took the time interval from proof of drug efficacy to first public funding multiplied by the survival advantage of the drug in years multiplied by the number of potentially eligible patients annually.
The date of proof of drug efficacy was defined as the date of publication or presentation (whichever came first) of the registration trial [7-26] used by pCODR in its analysis [27]. When pCODR used multiple trials in its analysis, the date of the earliest trial was considered the date of proof of drug efficacy.
When calculating the time interval for the HTA [27], if an interruption or resubmission took place, the whole time interval, including the break, was calculated.
We defined the time point of first public funding as the date on which the first province agreed to publicly reimburse the drug [27]. In this way, we considered the date of first provincial reimbursement as a surrogate for national public reimbursement, recognizing that all provinces may fund drugs at different timepoints or not at all.
When calculating time intervals to first public funding, we included only drugs with public funding in at least one province. For calculations of all other time intervals (i.e., to pCODR submission and pCODR HTA completion) we included all drugs in the data set regardless of funding status.
When determining the number of patients potentially eligible to receive each drug annually, we defined this as the number of patients dying annually of the particular cancer type in Canada [28]. Where subgroups of patients typically receive a given drug (e.g., epidermal growth factor receptor–positive non‐small cell lung cancer or Kirsten rat sarcoma [KRAS] wild‐type colorectal cancer), the size of the subgroup was taken into account. This was done by multiplying the total number of patients dying of each main cancer type in 2017 (lung, breast, colorectal) [29-31] by the estimated proportion of each relevant subgroup (extrapolated from the published literature) [14,32,33-40]. For example, 9,400 patients died of colorectal cancer in 2017 [29]. Because approximately 58% of patients with colorectal cancer are characterized as having KRAS wild‐type cancer [40,41], we determined that 9,400 × 0.58 results in 5,424 patients dying of KRAS wild‐type colorectal cancer per year.
Results
We assessed 21 drugs. At the time of database lock, 15 drugs had received public funding in at least one province. The median OS benefit of the drugs analyzed was undefined for ten drugs and ranged from 1.5 to 15.8 months (median 3.2 months) for 11 drugs with available randomized comparisons. The median PFS benefit for the drugs analyzed was undefined for three drugs and ranged from 0.7 to 10.0 months (median 3.9 months) for 18 drugs with available randomized comparisons. The number of patients potentially eligible to receive each drug annually ranged from 515 to 12,555 (median 5,000). Table 1 shows the list of drugs analyzed, their median survival advantages, and the number of patients potentially eligible to receive each drug annually in Canada.
Drug efficacy and eligibility characteristics
| Tumor site | Drug name | Indication | Median OS gain in monthsa | Median PFS gain in monthsa | Number of eligible patients per year |
|---|---|---|---|---|---|
| Lung | Afatinib [7] | First line, EGFR+ | — | 4.2 | 1,703 |
| Lung | Ceritinib [42] | ALK+ | — | 3.8 | 538 |
| Lung | Crizotinib [43] | Second line, ALK+ | — | 3.9 | 538 |
| Lung | Crizotinib [44] | First line, ALK+ | — | 4.7 | 538 |
| Lung | Nivolumab [10] | Second line, nonsquamous | 2.8 | — | 12,555 |
| Lung | Nivolumab [11] | Second line, squamous | 3.2 | 0.7 | 5,380 |
| Lung | Osimertinib [12] | Second line, EGFR T790M+ | — | 5.7 | 1,158 |
| Lung | Pembrolizumab [15] | First line, expressing PD‐L1 > 50% | 15.8 | 4.3 | 5,380 |
| Lung | Pembrolizumab [14] | Second line, expressing PD‐L1 | 4.2 | — | 11,837 |
| Lung | Pemetrexed [13] | Maintenance after first‐line platinum doublet | 2.9 | 1.3 | 12,555 |
| Breast | Eribulin [17] | Third line | 2.5 | — | 5,000 |
| Breast | Everolimus [16] | HR+, Her2/neu− | — | 4.1 | 3,635 |
| Breast | Lapatinib [21] | HR+, Her2/neu+ | — | 5.2 | 515 |
| Breast | Palbociclib [18] | HR+ | — | 10.0 | 3,635 |
| Breast | Pertuzumab [20] | Her2/neu+, in combination with a taxane/trastuzumab | 15.7 | 6.3 | 1,000 |
| Breast | Trastuzumab Emtansine [19] | Her2/neu+, following trastuzumab | 5.8 | 3.2 | 1,000 |
| Colorectal | Aflibercept [26] | Second+ line | 1.5 | 2.2 | 9,400 |
| Colorectal | Bevacizumab [22] | First line, with capecitabine, when oxaliplatin and irinotecan are unsuitable | — | 2.8 | 9,400 |
| Colorectal | Cetuximab [23] | First line, KRAS WT | 3.5 | 1.5 | 5,424 |
| Colorectal | Panitumumab [25] | First line, KRAS WT | — | 1.6 | 5,424 |
| Colorectal | Regorafenib [45] | Second+ line | 2.5 | 1.5 | 9,400 |
aSurvival gain in comparison to the study control arm.
Abbreviations: —, not applicable; ALK, anaplastic lymphoma kinase; EGFR, epidermal growth factor receptor; Her2/neu, human epidermal growth factor receptor 2; HR, hormone receptor; KRAS, Kirsten rat sarcoma; OS, overall survival; PFS, progression‐free survival; PD‐L1, programmed death‐ligand 1; WT, wild type.
The majority of drugs analyzed (76%) received a positive pCODR recommendation. All drugs with a negative pCODR recommendation remain unfunded in all provinces to date.
The median time from proof of efficacy to first public funding was 26.6 months (range 14.0–99.2 months). Analyzing each component of the process, the median time from efficacy to the HTA submission was 12.2 months (range 0–68.8 months); median time for the HTA process itself was 8.7 months (range 5.6–33.5 months); median time from HTA completion to first public funding was 6.9 months (range 2.1–24.9 months). Figure 1 details the component time delays for each drug.
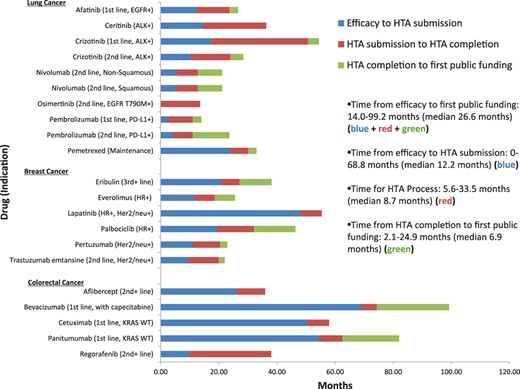
Delay from proof of efficacy to HTA process to first public funding.
Abbreviations: ALK, anaplastic lymphoma kinase; EGFR, epidermal growth factor receptor; Her2/neu, human epidermal growth factor receptor 2; HR, hormone receptor; HTA, health technology assessment; KRAS, Kirsten rat sarcoma; PD‐L1, programmed death‐ligand 1; WT, wild type.
For all drugs with a PFS advantage (n = 18), total PFS life‐years lost from proof of efficacy to HTA completion were 50,481 (lung cancer 8,596, breast cancer 12,393, colorectal cancer 29,492). Delineating PFS life‐years lost for each component of the process, from proof of efficacy to start of HTA, 35,443 life‐years were lost, and an additional 15,038 life‐years were lost during the HTA process itself. Figure 2A shows a breakdown of progression‐free survival life‐years lost for efficacy to HTA completion for all drugs.

Potential life‐years lost from efficacy to completion of the health technology assessment (HTA) and first public funding. (A): Progression‐free survival (PFS) life‐years lost rom efficacy to HTA. (B): PFS life‐years lost from efficacy to funding. (C): Overall survival (OS) life‐years lost from efficacy to HTA. (D): OS life‐years lost from efficacy to funding.
Abbreviations: ALK, anaplastic lymphoma kinase; EGFR, epidermal growth factor receptor; Her2/neu, human epidermal growth factor receptor 2; HR, hormone receptor; KRAS, Kirsten rat sarcoma; PD‐L1, programmed death‐ligand 1; WT, wild type.
Considering only drugs with a PFS advantage that were funded in at least one province (n = 12), total PFS life‐years lost from efficacy to first public funding were 48,037 (lung cancer 9,139, breast cancer 15,827, colorectal cancer 23,071). Figure 2B shows a breakdown of progression‐free life‐years lost from efficacy to public funding for each drug.
For all drugs with an OS advantage (n = 11), total OS life‐years lost from proof of efficacy to HTA completion were 45,218 (lung cancer 22,494, breast cancer 5,379, colorectal cancer 17,345). Delineating OS life‐years lost for each component of the process, from proof of efficacy to start of HTA, 24,756 life‐years were lost, and an additional 20,461 life‐years were lost for the HTA process itself. Figure 2C shows a breakdown of overall survival life‐years lost from efficacy to HTA completion for all drugs.
Considering only drugs with an OS advantage that were funded in at least one province (n = 8), total overall survival life‐years lost were 39,067 (lung cancer 32,376, breast cancer 6,691). Figure 2D shows a breakdown of overall survival life‐years lost from efficacy to first public funding for each drug.
For drugs that were funded in more than one province (n = 15), time intervals from first to last provincial funding ranged from 2.8 to 23.8 months (median 6.2 months). Table 2 shows time intervals from first to last provincial funding for all drugs funded in at least two provinces.
Time intervals from first to last provincial funding
| Drug (indication) | Months from first to last provincial funding |
|---|---|
| Lung cancer | |
| Afatinib (first line, EGFR+) | 9.4 |
| Crizotinib (first line, ALK+) | 4.4 |
| Crizotinib (second line, ALK+) | 6.2 |
| Nivolumab (second line, nonsquamous) | 5.1 |
| Nivolumab (second line, squamous) | 5.1 |
| Pembrolizumab (first line, PD‐L1+) | 5.7 |
| Pembrolizumab (second line, PD‐L1+) | 5.7 |
| Pemetrexed (maintenance) | 20.7 |
| Breast cancer | |
| Eribulin (third+ line) | 23.8 |
| Everolimus (HR+) | 10.8 |
| Palbociclib (HR+) | 2.8 |
| Pertuzumab (Her2/neu+) | 17.8 |
| Trastuzumab emtansine (second line, Her2/neu+) | 7.7 |
| Colorectal cancer | |
| Bevacizumab (first line, with capecitabine) | 4.3 |
| Panitumumab (first line, KRAS WT) | 15.0 |
Abbreviations: ALK, anaplastic lymphoma kinase; EGFR, epidermal growth factor receptor; Her2/neu, human epidermal growth factor receptor 2; HR, hormone receptor; KRAS, Kirsten rat sarcoma; D‐L1, programmed death‐ligand 1; WT, wild type.
Discussion
An improved understanding of cancer biology and the advent of molecularly targeted therapies and other novel drug classes are helping patients with advanced malignancy live longer without the toxicities of conventional chemotherapy [2]; however, the prices for cancer drugs are increasing [46] because of the enormous costs of drug development and market factors [5,47-49]. It is clear that careful consideration is required when selecting drugs for public reimbursement in the context of a publicly funded health care system.
Notwithstanding the importance of insightful decision making and a process to do so, the number of potential life‐years lost during the cancer drug regulatory and funding process in Canada is substantial. We calculated a total of 39,076 overall survival life‐years lost and 48,037 progression‐free life‐years lost from the time of proof of drug efficacy to first public reimbursement for 21 drugs used in advanced lung, breast, and colorectal cancer. Although we attempted to make the most conservative calculations possible, we recognize that these calculations represent estimates. However, even if the true value is only a fraction of our calculations, the loss remains substantial.
Considering the time from proof of efficacy to first public reimbursement, we found that the longest time interval occurred while awaiting drug submission to pCODR by the drug manufacturer. The median time delay while awaiting submission to pCODR was approximately 1 year. Determining reasons for delayed submission to pCODR was beyond the scope of this analysis, but we can hypothesize that Canada is a smaller market than other countries and therefore may not be a priority for drug marketing by pharmaceutical companies; in fact, it is known that drug applications are submitted to Health Canada a median of about 1 year later than they are submitted to the U.S. Food and Drug Administration and the European Medicines Agency [50].
The pCODR process was implemented in 2011 by the Ministries of Health (except Quebec), replacing the interim Joint Oncology Drug Review [5], with the goal of informing provincial reimbursement decisions based on clinical efficacy and cost‐effectiveness [51]. Although previous research suggests that pCODR improved the median time from Health Canada approval to public funding from 522 to 393 days [52], the median time required for the HTA was 141 days (range 112–282) and only 50% met the target of 140 days [53]. In our present analysis, the median time for the pCODR HTA was longer, at close to 9 months. This discrepency likely results from different methodologies used to calculate time intervals for the pCODR HTA and the selection of included drugs.
Although we considered time to first provincial reimbursement as a surrogate for public access nationwide in order to make the most conservative possible estimates of potential life‐years lost, in reality, provinces and territories all fund drugs at different time points (if at all). This lends itself to the potential for great variability among provinces and territories, and we see in the present study that the time delay from first to last provincial funding may be as long as nearly 2 years. Substantial variability in provincial funding decisions is supported by previous research [5,53]. In a survey evaluating provincial discordance in drug funding decisions, over 90% of policymakers stated that the most common reason to not fund a drug recommended by pCODR was budget constraints [54]. The Canadian Federal Government is currently investigating the possibility of a national pharmacare system, which may have the potential to eradicate these interprovincial discrepancies [55].
In some ways, our calculations are underestimates of the true number of life‐years lost. We did not take into account additional life‐years lost after the first provincial funding while awaiting all subsequent provinces to fund. We were also unable to calculate overall survival life‐years lost for drugs without a documented OS advantage in a clinical trial because of crossover. To compensate for this, we calculated progression‐free life‐years lost. Although PFS is not a reliable surrogate for OS [56], progression‐free years may be meaningful from a patient perspective because longer PFS may improve health‐related quality of life [57-59], although this may be considered controversial. Progression‐free life‐years lost are not as meaningful as overall survival life‐years lost, as they do not describe actual years of life lost, but we believe they nonetheless help us to describe the cost of the drug funding process in patient‐centered terms.
Although our calculations are underestimates in some ways, in other ways our calculations are overestimates of the true number of life‐years lost. While awaiting approval by Health Canada for marketing in the country, Health Canada may allow limited release of a drug under its Special Access Program. Some patients may access these drugs through other clinical trials. However, most public drug plans do not cover the cost of such drugs prior to approval [5], so we did not take into account the availability of special access programs in our calculations. Similarly, we did not consider available means of funding aside from public reimbursement such as compassionate use programs, private insurers, or use of personal funds. Although some patients may access drugs sooner than others through such avenues, this may create a two‐tiered access system and does not represent equitable public availability of drugs. In addition to investigating two‐tiered access within Canada, future study should also assess variations in drug access among peer nations. This would require a thorough understanding of the important trials considered during the regulatory and approval process in the United States, Europe, and Japan, to name a few.
We recognize that calculating the time from proof of efficacy to public funding ignores the fact that regulatory approval by Health Canada is an important step in the process and may occur long after the publication or presentation of the registration trial. Using the date of registration trial publication or presentation may have therefore inflated our calculations of life‐years lost. Although the date of first market access guarantees revenue from sale of a given drug, this date is not as meaningful from a patient perspective, as patients yearn to access drugs the moment clinical trials prove their efficacy.
Although we calculated the life‐years lost for all potentially eligible patients, we recognize that not all eligible patients may receive a given drug because of factors such as performance status and patient choice. There is patient attrition with each line of systemic therapy [60], and some patients may not receive a referral to a medical oncologist at all [61]. As such, the number of patients who would actually receive a given drug is likely a smaller group than the number potentially eligible to receive it.
Finally, some of the drugs we investigated could be considered “me too” drugs, so although there was a delay in approval, patients may have had access to an alternative and comparable option. We did not consider “life‐years saved” by the availability of similar alternative (publicly funded) agents.
Conclusion
Although a cancer drug regulatory and funding process is necessary in the context of any publicly funded health care system, we highlight the need to refine our processes by developing national initiatives to minimize this barrier to treatment access. This study highlights the many moving parts in the process. Initiatives are needed, including more rapid applications into the process, a nimble HTA that consistently meets its own time targets and can adapt to the evolving clinical trial environment, and a post‐HTA process that allows transparency in cost negotiation and equality between provinces. Many initiatives are currently being explored, and we hope that they will help expedite the cancer drug funding process and improve equity across the provinces and territories of Canada.
Acknowledgments
The authors thank Louiselle Godbout and Chris Booth.
Author Contributions
Conception/design: Joanna Gotfrit, David J. Stewart, Paul Wheatley‐Price
Collection and/or assembly of data: Joanna Gotfrit, John J.W. Shin
Data analysis and interpretation: Joanna Gotfrit, Ranjeeta Mallick
Manuscript writing: Joanna Gotfrit, John J.W. Shin, Ranjeeta Mallick, David J. Stewart, Paul Wheatley‐Price
Final approval of manuscript: Joanna Gotfrit, John J.W. Shin, Ranjeeta Mallick, David J. Stewart, Paul Wheatley‐Price
Disclosures
David J. Stewart: Roche Canada, Boehringer‐Ingelheim Canada, Merck Canada, AstraZeneca Canada, Bristol‐Myers Squibb Canada (H, C/A), Celgene (RF); Paul Wheatley‐Price: Takeda, Roche, AstraZeneca, Merck, Abbvie, Bristol‐Myers Squibb (SAB). The other authors indicated no financial relationships.
(C/A) Consulting/advisory relationship; (RF) Research funding; (E) Employment; (ET) Expert testimony; (H) Honoraria received; (OI) Ownership interests; (IP) Intellectual property rights/inventor/patent holder; (SAB) Scientific advisory board
References
CADTH pan‐Canadian Oncology Drug Review. Canadian Association of Drugs and Technologies in Health (CADTH) Web site. Available at https://cadth.ca/pcodr. Updated 2016. Accessed 2016.
Find a review (pCODR). Canadian Agency for Drugs and Technologies in Health (CADTH) Web site. Available at https://www.cadth.ca/pcodr/find-a-review. Updated 2018. Accessed 2018.
Colorectal cancer statistics: Incidence and mortality 2017. Canadian Cancer Society Web site. Available at http://www.cancer.ca/en/cancer‐information/cancer‐type/colorectal/statistics/?region=on. Accessed 2018.
Breast cancer statistics: Incidence and mortality 2017. Canadian Cancer Society Web site. Available at http://www.cancer.ca/en/cancer‐information/cancer‐type/breast/statistics/?region=on. Accessed 2018.
Canadian Cancer Society. Lung cancer statistics: Incidence and mortality 2017. Canadian Cancer Society Web site. Available at http://www.cancer.ca/en/cancer‐information/cancer‐type/lung/statistics/?region=on. Accessed 2018.
What is non‐small cell lung cancer? American Cancer Society Web site. Available at https://www.cancer.org/cancer/non‐small‐cell‐lung‐cancer/about/what‐is‐non‐small‐cell‐lung‐cancer.html. Accessed 2018.
Author notes
Disclosures of potential conflicts of interest may be found at the end of this article.
