


Abstract
Metastatic castrate‐resistant prostate cancer (mCRPC) patients with liver metastases have a poor prognosis. No large studies have investigated the clinical and biochemical parameters associated with liver metastases in this population.
Patient data made available via Project Data Sphere were collected from 1,281 men with mCRPC who were enrolled on to three phase III clinical trials for the treatment of their disease. Multiple logistic regression was performed on eight clinical and biochemical baseline variables to test their association with the presence of liver metastases on baseline radiographic imaging. Variables of interest included prior docetaxel exposure, Eastern Cooperative Oncology Group performance status, albumin, alkaline phosphatase, alanine transaminase, aspartate transaminase (AST), hemoglobin (HGB), lactate dehydrogenase (LDH), prostate‐specific antigen, and total bilirubin. Final models were compared when treating the variables as either continuous or categorized.
Multiple variable analysis demonstrated that an increasing serum AST or LDH or a decreasing HGB was associated with an increased probability of having documented radiographic liver metastases (p < .0001). The area under the curve for the continuous model was 0.6842 and 0.6890 for the categorical one, with the latter model containing a dichotomized AST and LDH based on the upper limit of normal and tertile ranges of HGB based on the distribution of the outcome.
Our analysis demonstrated a significant association between the presence of liver metastases and laboratory levels of AST, LDH, and HGB. These have implications for patient management. More research is needed to validate these biomarkers and prospectively determine their application in the clinical setting.
The purpose of this study was to evaluate biochemical and clinical biomarkers associated with the presence of liver metastases in men diagnosed with metastatic castrate‐resistant prostate cancer. The results indicate that quantitative assessments of aspartate transaminase, lactate dehydrogenase, and hemoglobin are significantly associated with an increased probability of having documented radiographic liver metastases. Analysis of these simple variables can alert clinicians to those at high risk for prostate cancer that has spread to the liver, a finding of clear importance for clinical management.
Introduction
Sites of metastatic disease provide insights into the prognosis of men with metastatic castration‐resistant prostate cancer (mCRPC). Liver metastases in particular have an overall poor prognosis in this patient population [1–7]. Halabi et al. (2016) demonstrated that men with liver metastases had an overall survival of 13.5 months compared with 21.3 months for men with nonvisceral bone disease [4]. Although the development of liver metastases of prostatic origin is relatively rare per radiographs (8.6%) [4], a large study examining autopsies revealed a substantially higher prevalence of liver involvement (25.0%) [8]. Earlier detection of liver metastasis may play an important role in treatment decisions and could potentially improve therapeutic outcomes should more effective therapies be developed. Although there are large studies examining the prognosis of liver metastases in men with mCRPC [4–6], there are no studies and no guidelines regarding the clinical and laboratory factors associated with this particular and important subset of disease. Herein, we present the results of our study investigating the association of baseline clinical and biochemical variables with the presence of liver metastases in patients with mCRPC. These studies may provide clinicians with better guidance on imaging for those patients with suspected liver metastases.
Materials and Methods
Trial Inclusion
We performed a search of Project Data Sphere, a free and open database sponsored by the CEO Roundtable on Cancer's Life Sciences Consortium, for phase III clinical trials with available data investigating the treatment of mCRPC. Eight clinical trials were screened to be included in the analysis based on the following inclusion criteria: prior institutional review board approval; prior written informed consent from all subjects; a study population indicated for or receiving prior docetaxel; and the baseline data included collection of all the variables to be investigated in the present study.
Three trials were performed in patients with previous docetaxel: TROPIC [9], COU‐AA‐301 [10], and SUN 1120 [11]; and five with docetaxel‐naïve patients: ASCENT‐2 [12], ENTHUSE M1C [13], MAINSAIL [14], TAX‐327 [15], and VENICE [16]. Five of the eight studies did not collect variables of interest and were excluded. The ENTHUSE M1C, MAINSAIL, and SUN 1120 studies were eligible to enter the analysis, although the total sample size was reduced due to missing values (Fig. 1).
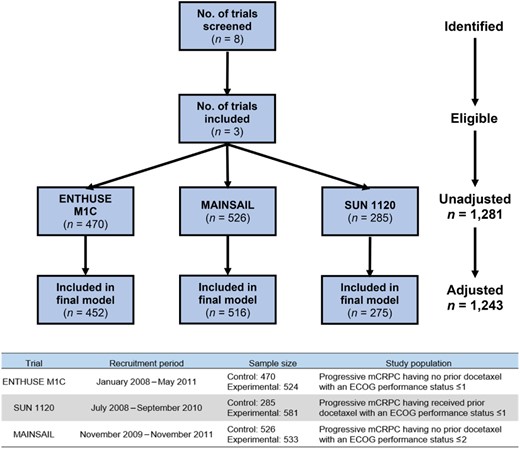
Clinical trials screened and included in the analysis with adjusted sample size.
Abbreviations: ECOG, Eastern Cooperative Oncology Group; mCRPC, metastatic castration‐resistant prostate cancer.
Patient Population
The subject population included patients diagnosed with mCRPC with recent disease progression who were either indicated for or had received prior docetaxel therapy. The trials included in this analysis were conducted when docetaxel was the typical first line of treatment in this patient population. Accessible subject data were restricted to those that were randomized to the comparator arms. Of the 1,281 subjects included in the dataset, 148 (11.6%) had documented liver metastases at baseline. Of these 1,281 patients, 1,243 were analyzable. The remainder had missing values in hemoglobin, lactate dehydrogenase (LDH), or aspartate transaminase (AST) and thus were excluded from the statistical analysis. The presence of liver metastases was determined by the identification of target and/or nontarget liver lesions per RECIST [17, 18] guidelines assessed by standard imaging (i.e., computed tomography [CT] or magnetic resonance imaging). The actual volume of liver metastases was not ascertainable in this data set, thus presenting a limitation of this study. Raw trial datasets included in the investigation were curated by being formatted, combined, and standardized to optimize data analysis.
Statistical Analysis
The primary outcome was the presence of liver metastases detected during the baseline radiological imaging assessments (yes/no). The primary goal of the analysis was to identify the laboratory and clinical variables associated with this outcome. We selected predictors based on their relationship with prostate cancer prognosis and/or liver function; therefore, we hypothesized that at least one variable of interest would be significantly associated with the presence of liver metastases. No analysis of serum markers was done to predict the future presence of liver metastases, and data prior to the initial CT images were not available in this dataset. Multiple logistic regression was performed via SAS/STAT® software, and purposeful selection was utilized to determine the most appropriate models for final consideration. Covariates were considered for elimination if the result did not meet significance, defined as a p value less than .05. The final model was determined when treating the laboratory variables as continuous, and categorical versions were subsequently assessed for comparison. The reduced models included variables that were both significant per the Likelihood Ratio test statistic and met the Hosmer‐Lemeshow Goodness‐of‐Fit criteria. Assumptions of linearity and multicollinearity were tested and predictors adjusted as appropriate. Continuous predictors for the categorized model were based on the distribution of the outcome, significance, clinical application, and model fit. The predictive power and goodness‐of‐fit of the final models were optimized based upon the area under the receiver operating characteristic curve, the Hosmer‐Lemeshow test statistic (H‐L), concordance, and discordance. The beta coefficients of the final models were utilized to calculate predicted probabilities.
Results
Multiple variable analysis demonstrated that a model including AST, LDH, and hemoglobin (HGB) were significant (p < .0001) regardless of variable type (continuous vs. categorical). Log transformation of LDH was required to meet the assumption of linearity. No adjustments for demographics or clinical trial allocation were necessary, as these variables did not significantly influence the model. Those with increasing AST or LDH and a decreasing HGB demonstrated an increased probability of having liver metastases in the continuous model. The categorized model showed that an abnormally elevated AST or LDH and a lower tertile range of HGB also resulted in an increased likelihood of the outcome (Table 1). A comparative analysis resulted in no significant difference (p = .9179) in the predictive power of the models, with the continuous and categorical versions having areas under the curve of 0.6842 (p < .0001, 95% confidence interval [CI] 0.6364–0.7319, H‐L = 0.8863) and 0.6869 (p < .0001, 95% CI 0.6400–0.7337, H‐L = 0.7039), respectively (Fig. 2). The optimal model included all three variables plus an interaction between LDH and HGB, which demonstrated that HGB becomes less influential with increasing LDH levels (Fig. 3A).
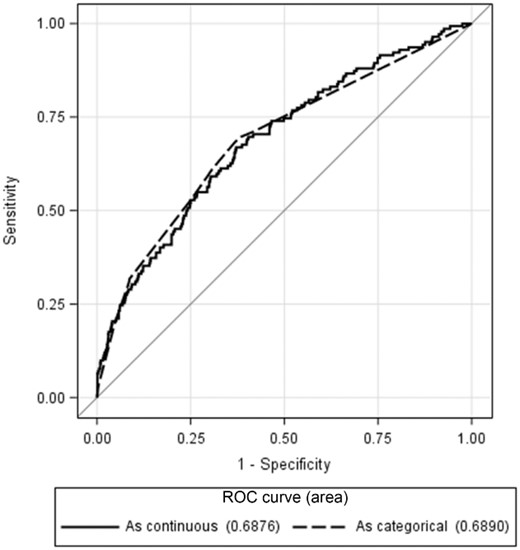
Comparison of the ROC curves for the final model (aspartate aminotransferase + lactate dehydrogenase + hemoglobin) predicting the presence of liver metastases. Results indicate no significant difference when treating the predictors as either continuous or dichotomous (p = .9179).
Abbreviation: ROC, receiver operating characteristic.
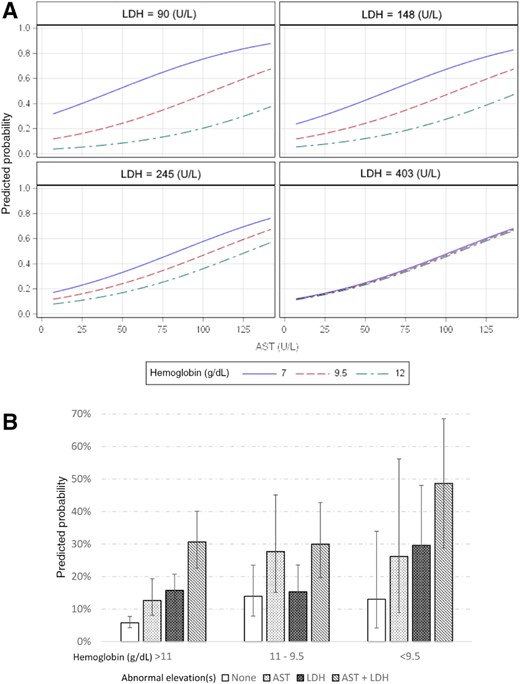
Predicted probabilities. (A): Predicted probabilities of the continuous model (p < .0001). An increasing AST or LDH and a decreasing hemoglobin demonstrated an increased probability of having liver metastases. As LDH levels increase, hemoglobin values become less influential. (B): Predicted probabilities with 95% confidence intervals of the categorical model (p < .0001) containing tertile ranges for hemoglobin and abnormal elevation(s) for AST and LDH.
Abbreviations: AST, aspartate aminotransferase; LDH, lactate dehydrogenase.
Results of a multiple variable regression model predicting the presence of liver metastases
| Variable | No liver metastases, n = 1,133 | Liver metastases, n = 148 | p value, continuous | p value, categorical |
|---|---|---|---|---|
| Age in years, n (%) | .5531 | .6176 | ||
| 18–64 | 33.5 | 32.4 | ||
| 65–74 | 46.3 | 47.3 | ||
| ≥75 | 20.2 | 20.3 | ||
| Race, n (%) | . | . | ||
| White | 861 (76.0) | 117 (79.1) | ||
| Black | 56 (4.9) | 3 (2.0) | ||
| Asian | 89 (7.9) | 13 (8.8) | ||
| Other | 127 (11.2) | 15 (10.1) | ||
| Prior docetaxel, n (%) | .1108 | .1213 | ||
| No | 877 (77.4) | 119 (80.4) | ||
| Yes | 256 (22.6) | 29 (19.6) | ||
| ECOG performance status score, n (%) | .9294 | .9699 | ||
| 0 | 590 (52.2) | 64 (43.5) | ||
| 1 | 524 (46.3) | 80 (54.4) | ||
| 2 | 17 (1.5) | 3 (2.1) | ||
| Albumin, n (%) | .2688 | .6853 | ||
| Median (range) | 43 (26–52) | 42 (29–54) | ||
| Normal | 1,085 (97.1) | 137 (93.8) | ||
| Abnormal | 32 (2.9) | 9 (6.2) | ||
| ALP, n (%) | .2823 | .9766 | ||
| Median (range) | 126.5 (34–4,291) | 179 (46–1,503) | ||
| Normal | 606 (54.3) | 59 (40.4) | ||
| Abnormal | 510 (45.7) | 87 (59.6) | ||
| ALT, n (%) | .1062 | .1124 | ||
| Median (range) | 19 (4–141) | 21 (5–158) | ||
| Normal | 1,050 (94.4) | 128 (87.7) | ||
| Abnormal | 62 (5.6) | 18 (12.3) | ||
| AST, n (%) | .0003 | .0001 | ||
| Median (range) | 24 (7–114) | 28.5 (12–142) | ||
| Normal | 990 (89.5) | 105 (71.9) | ||
| Abnormal | 116 (10.5) | 41 (28.1) | ||
| Hemoglobin, g/dL | .0048 | .0201 | ||
| Median (range) | 12.6 (7.1–17.3) | 12.1 (8.3–15.8) | ||
| Hemoglobin tertile, n (%) | . | . | ||
| >11 | 899 (79.4) | 99 (66.9) | ||
| 11–9.5 | 149 (13.1) | 32 (21.6) | ||
| <9.5 | 85 (7.5) | 17 (11.5) | ||
| LDH, n (%) | .0324 | .0116 | ||
| Median (range) | 207 (80–3,014) | 271 (132–2,665) | ||
| Normal | 764 (69.5) | 58 (40.0) | ||
| Abnormal | 336 (30.5) | 87 (60.0) | ||
| PSA, ng/mL | .9549 | .9711 | ||
| Median (range) | 92.0 (0.01–5,927.0) | 111.0 (0.37–9,546.0) | ||
| Total bilirubin, mg/dL | .2655 | .7922 | ||
| Median (range) | 0.12 (0.02–2.10) | 0.14 (0.03–1.00) |
Bolded p values are statistically significant.
Abbreviations: ALP, alkaline phosphatase; ALT, alanine transaminase; AST, aspartate transaminase; ECOG, Eastern Cooperative Oncology Group; LDH, lactate dehydrogenase; PSA, prostate‐specific antigen.
Of the 148 patients with these metastases, 61.5% had an abnormally elevated AST or LDH, compared with only 33.4% of the patients without liver metastases. An elevated AST and LDH occurred in 25.0% of patients with liver metastases and only 6.5% for those without. In addition, 31.25% of patients with liver metastases demonstrated a HGB of ≤11 g/dL, compared with 17.14% for those without. In the entire dataset, only 1.43% had an elevated total protein; thus, this parameter was not analyzable with regard to liver metastases given the paucity of data.
The predicted probability of having liver metastases within the categorical model ranged from 5.78% to 49.85% (Table 2). Patients with an abnormally elevated AST and LDH had a >25% probability of having liver metastases regardless of HGB level. In addition, patients with an HGB level <9.5 g/dL and an abnormally elevated AST or LDH also demonstrated a >25% probability of having liver metastases (Fig. 3B).
Predicted probabilities with 95% confidence intervals of having liver metastases in the categorical model. Hemoglobin levels were separated by tertile ranges, whereas AST and LDH were dichotomized based on their upper limit of normal
| Hemoglobin, g/dL | Abnormal(s) | Predicted probability, % | 95% CI, % |
|---|---|---|---|
| >11 | None | 5.78 | 4.29–7.74 |
| AST | 12.66 | 8.06–19.34 | |
| LDH | 15.75 | 11.78–20.75 | |
| LDH + AST | 30.65 | 22.60–40.10 | |
| 11–9.5 | None | 13.93 | 7.85–23.51 |
| AST | 27.68 | 15.13–45.09 | |
| LDH | 15.32 | 9.60–23.56 | |
| LDH + AST | 29.95 | 19.67–42.75 | |
| <9.5 | None | 13.04 | 4.19–33.93 |
| AST | 26.17 | 8.92–56.18 | |
| LDH | 29.60 | 16.04–48.04 | |
| LDH + AST | 49.85 | 30.00–69.76 |
Abbreviations: AST, aspartate transaminase; CI, confidence interval; LDH, lactate dehydrogenase.
Discussion
To our knowledge, this is the first multiple variable analysis investigating markers associated with the presence of liver metastases in men with mCRPC. It is also of note that there are no current guidelines that address the use of serum markers to trigger imaging for liver metastases. The availability of large clinical trial datasets through Project Data Sphere allowed us to test the association between clinically relevant variables and a rare outcome. Our analysis indicates that AST, LDH, and HGB are significant predictors of patients having radiographic evidence of liver metastases. The identification of liver metastases is important, as this subset of patients has a poor prognosis and poses challenges for clinicians regarding treatment options [4].
Although this study informs us about some of the routine biomarkers that may be useful in determining the risk of having liver metastases, more indicators and potentially better imaging is needed to identify patients at risk earlier in the development of liver involvement. Further investigation into the overall disease burden within the liver may prove insightful but will require the volume of metastatic liver disease to be directly measured. Thus, more comprehensive datasets than the ones available for the current study are needed. Although the literature is sparse, small studies have indicated an association between chromogranin A and neuron‐specific enolase and the existence of liver metastases [19, 20]—larger studies with more laboratory variables are needed to investigate these lab parameters further. Data from these markers were not available in the data sets used herein. New promising imaging techniques under study, such as prostate‐specific membrane antigen‐targeting imaging agents [21–24], may be able to identify liver involvement earlier in its development as compared with current imaging modalities. This in turn may also help us identify the true prevalence of liver metastases in mCRPC and thus provide a better foundation to better characterize and study this population.
As genetic testing becomes less invasive and more realistic in the routine clinic setting, genomic studies may create new opportunities to identify patients at additional risk of developing liver metastases. In particular, the analysis of circulating tumor DNA and/or circulating tumor cells may be of additional benefit. Such studies have a strong rationale and are currently being explored.
Finally, more research is needed to understand the best treatment options for this patient population; however, this will prove difficult considering the relatively low prevalence of liver metastases, which poses a substantial challenge for prospective studies. Advancements in biochemical markers, imaging, and genomics may pave the way to better detection and treatment decisions. We also note that this study is limited by the lack of additional patient datasets that could be used for verification. The Project Datasphere is the largest publicly available dataset of this type, and no equivalent exists.
More studies are needed to verify our findings, especially considering the sample size of the population of interest. Other limitations include the lack of tumor burden assessments in the liver, the lack of genomics, and changes to the available treatment options since our study's datasets were collected. The data presented herein represent a population with less advanced mCRPC, and further research is needed for patients with more advanced or more neuroendocrine‐like disease, which are known to have a greater prevalence of visceral metastases [25].
Conclusion
Our analysis demonstrated that there is a significant association between the presence of liver metastases, serum elevations of AST or LDH, and decreased levels of HGB. These findings have implications for clinicians in that they can stratify patients readily into low and higher risk categories for liver metastases. Such information can trigger scans that may change therapy. More research is needed to validate these biomarkers and to prospectively determine their application in the clinical setting. Liver‐targeted therapies such as radioembolization with yttrium‐90 glass beads may provide a therapeutic approach for the treatment of selected patients with liver metastases.
Acknowledgments
This publication is based on research using information obtained from www.projectdatasphere.org, which is maintained by Project Data Sphere, LLC. Neither Project Data Sphere, LLC nor the owner(s) of any information from the web site have contributed to, approved, or are in any way responsible for the contents of this publication.
SAS and all other SAS Institute Inc. product or service names are registered trademarks or trademarks of SAS Institute Inc. in the USA and other countries. ® indicates USA registration.
Author Contributions
Conception/design: Patrick M. Cotogno, Oliver Sartor
Collection and/or assembly of data: Patrick M. Cotogno, Lahiru K. Ranasinghe, Elisa M. Ledet, Brian E. Lewis, Oliver Sartor
Data analysis and interpretation: Patrick M. Cotogno, Lahiru K. Ranasinghe, Elisa M. Ledet, Brian E. Lewis, Oliver Sartor
Manuscript writing: Patrick M. Cotogno, Oliver Sartor
Final approval of manuscript: Patrick M. Cotogno, Lahiru K. Ranasinghe, Elisa M. Ledet, Brian E. Lewis, Oliver Sartor
Disclosures
The authors indicated no financial relationships.
For Further Reading: Emmanuel S. Antonarakis, Chandtip Chandhasin, Erica Osbourne et al. Targeting the N‐Terminal Domain of the Androgen Receptor: A New Approach for the Treatment of Advanced Prostate Cancer. The Oncologist 2016;21:1427–1435.
Implications for Practice: Because of emerging resistance mechanisms that involve the ligand‐binding domain of the androgen receptor (AR), there is currently no effective treatment addressing tumor escape mechanisms related to current AR‐targeted therapies. Many patients still demonstrate limited clinical response to current hormonal agents, and castration‐resistant prostate cancer remains a lethal disease. Intense research efforts are under way to develop therapies to target resistance mechanisms, including those directed at other parts of the AR molecule. A novel small‐molecule agent, EPI‐506, represents a new pharmaceutical class, AR N‐terminal domain inhibitors, and shows preclinical promise to overcome many known resistance mechanisms related to novel hormonal therapies.
References
Author notes
Disclosures of potential conflicts of interest may be found at the end of this article.
