


Abstract
Pneumocystis jirovecii is a symbiotic respiratory fungus that presents in 2 clinical forms: pneumonia in immunocompromised patients or colonization, defined by the presence of the organism without associated clinical symptoms. Currently, diagnosis requires invasive bronchoscopy, which may not be available in some settings and is inappropriate for detecting colonization in healthy individuals. Noninvasive diagnostic techniques and molecular strain typing tools that can be used on these samples are critical for conducting studies to better understand transmission. We evaluated 2 real-time polymerase chain reaction (PCR) assays targeting dihydropteroate synthase and the major surface glycoprotein for detection in 77 oropharyngeal washes (OPWs) from 43 symptomatic human immunodeficiency virus-infected patients who underwent bronchoscopy. We also evaluated the ability of a new microsatellite (MS) genotyping panel to strain type infections from these samples. Each PCR used individually provided a high sensitivity (>80%) for detection of pneumonia but a modest specificity (<70%). When used in combination, specificity was increased to 100% with a drop in sensitivity (74%). Concentration of organisms by PCR in the OPW tended to be lower in colonized individuals compared with those with pneumonia, but differences in concentration could not clearly define colonization in symptomatic individuals. Oropharyngeal wash samples were genotyped using 6 MSs with ≥4 alleles successfully genotyped in the majority of colonized patients and ≥5 alleles in patients with pneumonia. The MS profile was consistent over time within patients with serial OPWs analyzed. Microsatellite genotyping on noninvasive samples may aid in studying the molecular epidemiology of this pathogen without requiring invasive diagnostic techniques.
Pneumocystis jirovecii is a symbiotic respiratory fungus that may cause pneumonia (Pneumocystis pneumonia [PcP]) in immunocompromised patients [1–5]. Despite significant reductions in cases of pneumonia due to the use of P jirovecii prophylaxis in high-risk individuals, PcP remains a significant opportunistic pneumonia [3, 5]. Among human immunodeficiency virus (HIV)-infected patients who do not receive combination antiretroviral therapy, PcP remains a leading cause of death [6, 7]. Mortality rates range from 10% to nearly 40% in those with severe pneumonia and respiratory failure [8–10]. In addition, outbreaks among other immunocompromised groups, such as hematopoietic stem cell and solid organ transplant patients, can cause significant morbidity and mortality [11–14].
Because P jirovecii cannot be cultured, PcP is usually diagnosed by direct examination of specimens collected by induced sputum (IS) or bronchoscopy with bronchoalveolar lavage (BAL). Induced sputum has been quite variable in its sensitivity leaving invasive bronchoscopy as the gold standard diagnostic procedure. However, bronchoscopy is generally unavailable in resource-limited settings such as in sub-Saharan Africa where the majority of HIV-infected persons reside. Noninvasive methods with the potential for widespread applicability and accessibility have been sought to aid in the detection of P jirovecii and diagnosis of PcP. Examination of oropharyngeal wash (OPW) specimens paired with molecular techniques has been studied using many different approaches [15–20]. The sensitivity of OPW for the diagnosis of PcP has exceeded 90% in some cases [15]. However, no standardized protocol has been developed. One of the limitations of molecular techniques has been that the specificity for PcP is less than 100% because colonized individuals, defined as the molecular detection of fungal DNA in respiratory specimens from asymptomatic humans, have relatively low but detectable amounts of P jirovecii DNA [21].
The impact of colonized individuals on transmission of P jirovecii is incompletely understood [22]. Pneumocystis can be transmitted from a colonized animal to an immunocompromised animal, which then becomes fatally ill with PcP. To broadly study the role of colonization in the transmission of P jirovecii in humans, we must be able to ide.jpegy colonized and infected individuals by collection of specimens in a noninvasive fashion and apply molecular typing tools to these specimens. In a recent study, we described a multilocus microsatellite (MS) genotyping array to investigate the genetic epidemiology of P jirovecii [1]. We ide.jpegied 6 MSs that captured the majority of global diversity. These neutrally evolving markers had a high discriminatory index and significant heterogeneity. In addition, we saw that many of the samples contained multiple genotypes represented as multiple alleles seen at a given MS.
The goal of this study was 3-fold. First, we investigated the use of real-time polymerase chain reaction (PCR) to diagnose PcP and/or detect colonization in symptomatic individuals. We did this by testing OPW samples from 43 HIV-infected individuals presenting with respiratory symptoms and radiographs consistent with PcP who underwent IS and/or BAL for diagnosis. For this study, the microscopy from the BAL or IS acted as the gold standard reference test to which real-time PCR was compared. Colonization was defined as PCR positivity with negative microscopy by IS or BAL. We investigated the use of 2 assays in combination and looked at the differences in P jirovecii concentration between individuals to try to increase specificity of diagnosis of pneumonia. Second, we determined whether the MS genotyping tool we had previously studied in IS and BAL samples was capable of determining genotypes from noninvasive OPW samples. Last, we describe the dynamics of genotypes ide.jpegied in longitudinally collected OPWs from the same individual, because variation in detected genotypes may impact our understanding of transmission.
METHODS
Study Samples
We analyzed 77 OPW samples from 43 HIV-infected patients admitted to San Francisco General Hospital with respiratory symptoms and a chest radiograph consistent with PcP and who underwent sputum induction and/or bronchoscopy. Patient characteristics are described in Supplementary Table 1. Oropharyngeal wash specimens were collected at the time of the initial PcP evaluation and continued throughout the hospitalization in a subset. Thus, each individual could contribute more than 1 OPW collected serially. The range of the number of samples per individual patient was 1–13 (median, 1; mean, 1.9). Oropharyngeal wash specimens were collected by having the patient cough 5 times against a semiclosed mouth, followed by gargling 10 mL of sterile 0.9% NaCl for 60 seconds, and then spitting the OPW specimen in a sterile specimen cup. An equal volume of dithiothreitol was then added, and the specimen was mixed, stored at −80°C, and shipped to University of North Carolina for PCR and MS analysis. Ethical approval for the collection of OPW samples and accompanying clinical information was granted by the University of California San Francisco Committee on Human Research. Approval for molecular analysis of deide.jpegied patient samples was provided by the Institutional Review Board at University of North Carolina.
DNA Extraction
The two 15 mL conical tubes containing OPW samples were spun at 2900 g for 5 minutes at 12°C in a Sorvall T 16R (Thermo Scie.jpegic, Waltham, MA). The supernatant was removed with a sterile pipette. Two hundred microliters of TE buffer (pH 8.0) was added to one of the pellets and was mixed by pipetting. The buffer was then moved to the second pellet and mixed again to resuspend all the recovered cells. DNA was extracted using QIAGEN DNA Mini kits (QIAGEN, Valencia, CA).
Real-Time Polymerase Chain Reaction
Each sample was tested with 2 real-time PCR assays. A real-time PCR assay targeting the gene encoding dihydropteroate synthase (dhps) was conducted as previously described [23]. As a positive control, we generated a plasmid by PCR amplification of the dhps fragment using the real-time PCR primers and cloning of the fragment into the pCR4-Topo plasmid using a TOPO TA cloning kit (Life Technologies, Grand Island, NY). This plasmid was used to generate a standard curve (ranging from 10 to 10 000 copies per microliter) that was run on all PCR plates to allow qua.jpegication of the amount of P jirovecii in the sample, because dhps is a single-copy gene. A real-time PCR assay targeting the gene encoding the major surface glycoprotein (MSG) was done using a previously published primer set [24, 25]. For this assay, samples were amplified using Roche FastStart Universal SYBR master mix, 800 nM of each primer (JKK14/15), and 2 µL of extract DNA. Amplification was completed as follows: 50°C for 2 minutes, 95°C for 10 minutes, followed by 40 cycles of 95°C for 15 seconds and 60°C for 1 minute. Specificity of amplification was confirmed using a melt curve analysis (60°C–95°C at 0.05°C/second). A positive control from a BAL sample was used. All PCRs contained an NTC and were done on an ABI Viia7 (Life Technologies).
Microsatellite Analysis
Microsatellite analysis was carried out on all samples that were positive by both real-time PCR assays and that also contained ≥2 copies of P jirovecii per microliter of extracted DNA presuming that these would represent PcP infections. In addition, samples that tested positive by a single real-time PCR assay were also genotyped presuming these would represent colonized individuals because we were blinded to IS and BAL results. Genotyping of 6 MSs (MS1, MS3, MS5, MS6, MS7, MS8) was carried out as previously described [1]. All samples were sized by capillary electrophoresis at Eton Bioscience (Durham, NC) using an ABI 3730XL Genetic Analyzer. Peak calling was done using Peak Scanner 2 (Life Technologies); for loci with multiple peaks in a single specimen, additional peaks were only considered if they reached at least 33% of the largest peak in the sample, based on our previous work [1].
Statistical Analysis
All statistical analysis and figures were done with GraphPad Prism, version 6.05 (GraphPad Software, La Jolla, CA).
RESULTS
Description of Patient Characteristics
We enrolled 43 HIV-infected patients who were admitted to San Francisco General Hospital with a case of suspected PcP. Twenty-eight subjects were diagnosed with PcP based upon microscopic evaluation of IS or BAL specimens; 15 subjects were judged to not have PcP owing to a negative microscopic evaluation of BAL specimen and the absence of empiric PcP therapy before testing. These 15 subjects also did not have a subsequent PcP diagnosis within 6 weeks of enrollment.
Detection of Pneumocystis jirovecii in Oropharyngeal Wash From Confirmed Cases of Pneumocystis Pneumonia
We evaluated the ability of the 2 real-time PCR assays to detect P jirovecii in OPW from the 28 microscopically confirmed cases of PcP. We evaluated the test characteristics of these assays both individually as well as in combination. In addition, we evaluated the performance of the assays on a per-sample basis because some patients provided more than 1 OPW sample. The test characteristics of the assays are summarized in Table 1. The combination of 2 assays increased the specificity of a diagnosis of active PcP (100%), but sensitivity was only 74%, leading to a high positive-predictive value and low negative-predictive value. Individually, both the dhps and MSG real-time PCR assays detected over 80% of infections among confirmed cases of PcP, each with a positive-predictive value of >90%. In total, 45 OPW samples (of 61 total samples) from confirmed PcP cases were detected by both assays and 12 samples were only detected by 1 of the assays. Four samples from confirmed cases were negative by both PCR assays.
Test Characteristics for OPW PCR Assays Compared With BAL/IS for Diagnosis of Pneumonia
| Both PCR Positive | Any PCR Positive | dhps PCR Positive | MSG PCR Positive | |
|---|---|---|---|---|
| Per sample analysis (n = 77) | ||||
| Percent Positive by PCR of microscopy Positive (n = 61) | 74% (45) | 93% (57) | 85% (52) | 82% (50) |
| Percent Positive by PCR of microscopy Negative (n = 16) | 0% (0) | 44% (7) | 31% (5) | 13% (2) |
| Sensitivity | 74% | 93% | 85% | 82% |
| Specificity | 100% | 56% | 68% | 88% |
| Positive Predictive Value | 100% | 89% | 91% | 96% |
| Negative Predictive Value | 50% | 69% | 55% | 56% |
| Per individual analysis (n = 43)a | ||||
| Percent Positive by PCR of microscopy Positive (n = 28) | 79% (22) | 89% (25) | 82% (23) | 86% (24) |
| Percent Positive by PCR of microscopy Negative (n = 15) | 0% (0) | 40% (6) | 27% (4) | 13% (2) |
| Sensitivity | 79% | 89% | 82% | 86% |
| Specificity | 100% | 60% | 73% | 87% |
| Positive Predictive Value | 100% | 81% | 85% | 92% |
| Negative Predictive Value | 71% | 75% | 69% | 76% |
Abbreviations: BAL, bronchoalveolar lavage; IS, induced sputum; MSG, major surface glycoprotein; OPW, oropharyngeal wash; PCR, polymerase chain reaction.
a PCR test was considered positive if it occurred in any OPW sample from the patient.
Detection of Pneumocystis jirovecii in Oropharyngeal Wash From Pneumocystis Pneumonia-Negative Cases
In total, 16 OPW samples were collected from PcP-negative cases. Both PCR assays detected P jirovecii DNA in OPW washes from these patients with 33% of samples positive by the dhps PCR assay and 17% of samples positive by the MSG PCR assay (Table 1). No samples from PcP-negative patients tested positive in both assays. The overall concentration of P jirovecii DNA found in these samples (PCR positive/PCP negative) by dhps real-time PCR tended to be lower than the concentration in samples from infected individuals (PCR positive/BAL or IS positive) (Figure 1).
![Concentration of Pneumocystis jirovecii in the extracted DNA from oropharyngeal washes (OPWs) of colonized (polymerase chain reaction [PCR] positive/bronchoalveolar lavage [BAL] or induced sputum [IS] negative) versus infected (PCR positive/BAL or IS positive) samples. The figure shows a box and whiskers plot of the concentration of P jirovecii in the extracted DNA from colonized and infected individuals as determined by the dhps real-time PCR. The box represents the 25th to 75th percentile, and the whiskers represent the minimum and maximum values (t test; P > .05). The major surface glycoprotein PCR data were not analyzed in a similar fashion because there were insufficient numbers of PCR-positive samples in colonized patients, and no standard curve was included in the PCR to allow for accurate qua.jpegication.](https://oup.silverchair-cdn.com/oup/backfile/Content_public/Journal/ofid/2/3/10.1093_ofid_ofv080/5/m_ofv08001.jpeg?Expires=1747920498&Signature=ubEb6mHhVdhcWDwXvO1ZE7OiYf5eWthYzHBZanEZG1cpaLaBhPKHTwZTr1br~UQyPMyRLxVPeA5vy1tRNZVhsAqhLdvsBtrKac3U7q5Yak8a6lZnF1M6JB5kWi7tbpRMHBxTgUtCaRAv7TB7X~Y3VtLrWUE9L0C4TL6rFcwQtzGjmJQZ70A0VAmBFwxzcHmSKCnPV3-ExTy3AUq5t1jc45Dyl8-urGwzqyVwc0vyTmy0-VLfG44soRn9bF7PVCdbdi36Ei-AvbdsqrIPvNKd0EdWLJl6eQLctH57Otr5AJfUH4xGI9gozVpRSLThrQohxunVyzCDoMuycnlZP~QKlQ__&Key-Pair-Id=APKAIE5G5CRDK6RD3PGA)
Concentration of Pneumocystis jirovecii in the extracted DNA from oropharyngeal washes (OPWs) of colonized (polymerase chain reaction [PCR] positive/bronchoalveolar lavage [BAL] or induced sputum [IS] negative) versus infected (PCR positive/BAL or IS positive) samples. The figure shows a box and whiskers plot of the concentration of P jirovecii in the extracted DNA from colonized and infected individuals as determined by the dhps real-time PCR. The box represents the 25th to 75th percentile, and the whiskers represent the minimum and maximum values (t test; P > .05). The major surface glycoprotein PCR data were not analyzed in a similar fashion because there were insufficient numbers of PCR-positive samples in colonized patients, and no standard curve was included in the PCR to allow for accurate qua.jpegication.
Impact of Antibiotic Use of Detection of Pneumocystis jirovecii by Polymerase Chain Reaction
The complete antibiotic history was available for 36 of the 43 (84%) patients in the study. We assessed the impact of the interval since starting an anti-Pneumocystis medication (trimethoprim-sulfamethoxazole, atovaquone, or clindamycin plus primaquine) on the likelihood of testing positive by both PCR tests. Among patients with microscopy-confirmed PcP, OPW samples that were collected closer to the initiation of therapy were more likely to be positive by both assays; the average time of collection for both assays being positive was 4.5 days compared with a single test being positive of 8.3 days (P = .03; 2-sided t test). This supports previous work showing that previous treatment affects the likelihood of testing P jirovecii positive in OPWs [26]. We also assessed the correlation of P jirovecii concentration in these samples to the time therapy and found little correlation (R2 = 0.094; data not shown). This is likely partly due to the large variation in P jirovecii concentrations among samples early in the course of testing and potential variation in shedding of organisms into the oropharynx.
Performance of Microsatellite Genotyping in Oropharyngeal Wash
In total, 45 of 77 samples met our predefined definition for genotyping for presumed cases (ie, both real-time PCR assays were positive and contained ≥2 copies of P jirovecii per microliter of extracted DNA). This concentration cutoff was decided based upon the decreasing ability to generate a full complement of MS alleles at lower concentrations (data not shown). This approach allowed for generation of complete or nearly complete multilocus MS genotypes for the majority of samples, with 94% of samples having at least 5 informative MSs (Supplementary Table 2). There was some variation in the success rate for the 6 different MS targets, with MS6 and MS8 having the lowest success rates.
In addition to these samples, we genotyped the 19 OPW samples that tested positive for P jirovecii by only 1 real-time PCR assay (7 samples that were MSG positive and 12 samples that were dhps positive). After unblinding, these samples represented 12 samples from individuals who were BAL positive and 7 samples from individuals who were BAL negative and likely colonized. We were able to generate allele sizes for 4 or more MS in 10 of 12 (83%) and 7 of 7 (100%) of those samples, respectively.
Microsatellite Genotyping of Longitudinal Oropharyngeal Wash Samples
Among the 45 samples that met our predefined genotyping criteria and were able to be genotyped, we had 10 individuals who had multiple samples that all had ≥5 MS successfully genotyped. The range of samples genotyped from a single individual was from 2 to 8 samples. All 10 of these infections were polyclonal, with at least 1 MS generating 2 alleles. Figure 2 shows genotyping results from 2 of these individuals. In Figure 2A, the genotyping results from a patient with 2 samples are shown. There is a striking consistency in the allele sizes detected between the serial samples, similar to our previous findings when we compared 2 samples taken from a single BAL [1]. In this sample, the dominant peak in each MS stays stable over the course of sampling (circles in each plot), suggesting the dominant clone remains stable over the sampling period. In Figure 2B, the genotypes from longitudinal samples over a 16-day period are seen. Although there is an overall consistency of the alleles detected through the period, the dominant peak often changes over time (see MS1). In addition, new alleles appear in the sample at different time points. In most cases, that allele is found in more than 1 sample. However, in MS7 and MS8, novel alleles appear at certain time points. Overall, 9 of the 10 samples showed patterns similar to Figure 2A with 4 or 5 MSs having complete data showing a high level of reproducibility.
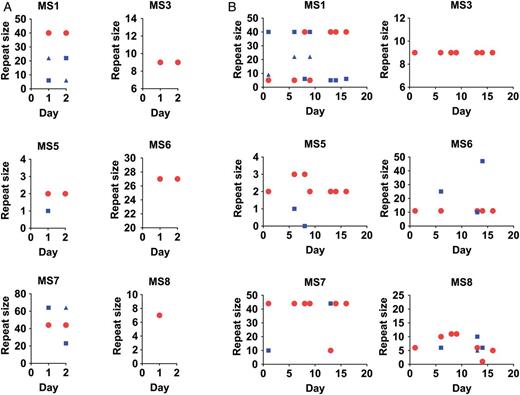
Longitudinal analysis of microsatellites (MSs) from oropharyngeal washes (OPWs) from individual patients. The MS genotypes from longitudinal OPW samples collected from individuals are shown. Within A and B, each subpanel represents data about allele sizes detected from 1 MS. The x-axis shows the day of collection during the illness. The y-axis shows the repeat size of the detected alleles. On a given day, each MS can have more than 1 allele detected, representing polyclonal samples. The MS repeat size of the majority allele (largest peak detected) is shown by the red circle. The MS repeat size of minor alleles are shown with blue squares or triangles. A, A relatively simple pattern over a 2-day period in which genotypes are regularly repeated between samples. B, Genotypes from 7 samples collected over a 16-day period. Both infections are polyclonal with at least 3 clones in the infections. However, B shows the dynamic nature of allele genotyping based on timing of sampling.
We used a predefined set of analysis parameters, in particular related to fluorescence intensity thresholds for calling alleles and methods for rounding alleles into repeat sizes. The assumptions used in these parameters can impact the genotyping results. First, the sensitivity of the MS method for lower frequency variants is dependent on the fluorescence intensity threshold used for calling alleles. Because the MS genotyping method used an a priori-determined cutoff that discounted peaks less than 33% the height of the largest peak, variants could have been lost due to this definition. Re-evaluation of discordant MS results in the longitudinal samples showed peaks ranging between 10% and 33% the height of the dominant peak that would improve the repeatability of the measured genotype (Figure 3). Second, rounding differences can cause small variation in the detected allele sizes. For example, in MS1 of Figure 2B, the samples contained genotypes that were classified as either 5 or 6 repeats. Upon hand curation of the data, these alleles differed by less than a repeat size and likely represent the same allele. Hand curation of allele size is laborious, but it may be necessary for refining genotyping results for transmission analysis.
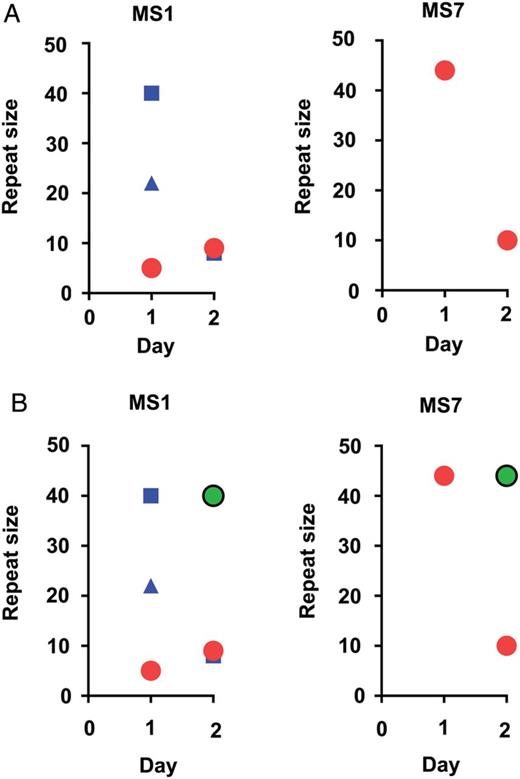
Impact of changing peak calling threshold. A, The microsatellite (MS) genotyping profile for a MS longitudinally in 1 patient using 33% height of the dominant allele as the cutoff for allele calling (the color scheme is the same as in Figure 2). B, The same information with additional minor peaks being called (green circles) using a 10% height cutoff.
DISCUSSION
We show that the specificity of diagnosis of PcP increases when OPW samples test positive by 2 PCRs. This is likely because concentrations of organisms were higher in samples from patients with pneumonia, as has been seen previously [26]. However, requiring 2 assays to be positive to define a positive test decreased the sensitivity of detecting pneumonia. Among the 19 samples that were positive by 1 real-time PCR assay, 12 (63%) were from patients with confirmed PcP. Another limitation is that in resource limited-settings, the costs associated with multiple nucleic acid tests for diagnosis of PCP may be prohibitive.
The detection of colonization in symptomatic patients remains problematic. We used samples from symptomatic individuals in this study that had undergone more invasive testing to allow us a gold standard with which to compare OPW PCR results. We did not assess asymptomatic individuals. Although the mean concentration of P jirovecii was statistically different between groups (Figure 1), the range clearly overlapped. The average concentration from the 5 colonized patients detected by the dhps assay (3.5 copies/µL of extract) was similar to the concentration of the 7 samples from BAL-positive patients detected with only the dhps assay (3.2 copies/µL). Due to the incomplete nature of treatment data, we cannot be certain whether this result is due to therapy, because treatment data are available for only 2 of 5 of the colonized individuals. However, 5 of 7 of the BAL samples were collected more than 10 days after therapy. Across all samples in the study, the samples from BAL-positive patients that were collected later in therapy were less likely to be positive by both assays. This finding supports previous results suggesting that time on therapy is critical when interpreting OPW molecular results [26]. Amongst all samples in the study known to be collected during the first 3 days of therapy, the average concentration of P jirovecii was 180 copies/µL. Thus, it appears that OPW samples taken at initial presentation of respiratory disease, prior to any antimicrobial therapy, are critical for adequate diagnosis of PcP and may have confounded our ability to diagnose colonization using organism concentration in these symptomatic individuals.
Because OPW samples can be used to detect the vast majority of people with Pjirovecii infection or colonization, this specimen type might be appropriate for conducting molecular epidemiology studies. In particular, molecular epidemiology studies are critical for understanding the transmission dynamics of P jirovecii infections, for understanding the biology of the organism, and for designing prevention and control strategies. It is clear that colonized infants and adults are reservoirs for P jirovecii in the environment [27]. However, at this time, there is no molecular evidence that these reservoirs are an important source of P jirovecii transmission. Future studies of P jirovecii transmission between immunocompetent hosts and immunocompromised patients may ide.jpegy strategies to prevent PcP in high-risk groups [1]. The MS genotyping array was able to generate a complete or nearly complete complement (≥4) of alleles successfully genotyped for both infected and colonized individuals in the study. These complete multilocus genotypes are critical for robust molecular epidemiology studies.
Individuals may harbor more than 1 strain of P jirovecii in the lungs, and this polyclonality may compromise molecular epidemiologic studies. The assessment of genotypes from serial samples from 1 individual can provide a sense of any dynamic changes in prevalent strains in an infection that may confound epidemiologic studies. Overall, the MS genotypes were reproducible across serial OPW samples with 9 of 10 individuals having patterns similar to Figure 2A, where dominant genotypes persist through follow-up. However, in 1 patient, we saw significant variation in alleles over time (Figure 2B). In a case in which variations in the relative frequencies of genotypes at each MS are observed, several factors could potentially impact the genotyping results. Variation occurs in the relative abundance of each strain due to individual strains being controlled differently over time in the host (by immunity or drug therapy), thus allowing for 1 strain to vary in relative frequency in the lung over time. Potentially, there are differences in the proportion of each strain that could be coughed up into the oropharynx, introducing sampling bias. In addition, technical limitations can introduce variation. At low concentrations of input DNA, variation in the proportion of each strain placed into each PCR reaction to generate fragments may introduce variation or over-amplification of specific templates, often called “jackpotting,” which can impact alleles detected. Amplification efficiency may impact the number of alleles detected in a sample: lower efficiency PCRs, such as MS6 and MS8, often have lower dominant peaks in the sample, making it more difficult to detect minority peaks. Lastly, the mutational rate of MS in P jirovecii is unknown. The instability of these MSs may complicate transmission studies if evolution occurs within an individual over time. We describe stability over relatively short periods in 9 patients (average, 1.4 days; range, 1–3). Beyond this, we see some variation that may represent either technical issues noted above or within host changes. However, MSs have a strong track record for use in molecular epidemiology studies for multiple organisms and have been used to look at longitudinal changes within mocked infections [28].
Overall, the MS array provided reproducible genotypes among longitudinal OPW samples in the short term, but it has several limitations. Some of these limitations, such as rounding issues and peak fluorescence cutoffs, can easily be modified to improve genotyping reliability. However, some of these limitations, such as low input amounts of organisms from OPW samples, are more difficult. The MS array provides an initial tool for studying transmission networks. However, alternate techniques, such as amplicon deep sequencing of hypervariable genes or enrichment of P jirovecii DNA in samples by hybrid selection, should also be investigated. In addition, this study does not address how genotype results from OPW samples correlate with genotypes from lower respiratory samples.
CONCLUSIONS
Pneumocystis jirovecii remains an important pathogen that still causes significant morbidity and mortality in immunocompromised patients. Molecular epidemiology studies could provide critical insight concerning the transmission of the organism, providing insight that could impact control and treatment efforts. The role of P jirovecii colonization of immunocompetent individuals in this transmission network remains unclear. This project represents the first steps in developing the molecular tools to try to define these transmission networks.
Acknowledgments
We thank Nick Matinyan and Oksana Kharabora for assistance in the laboratory.
Financial support. This project was supported by National Center for Advancing Translational Science CTSA NIH/NCATS UNC ULTR000083, National Institute of Allergy and Infectious Diseases (NIAID) grant R01 AI089819, and the University of North Carolina at Chapel Hill Center for AIDS Research, a National Institutes of Health-funded program (grant P30 AI50410). Subject enrollment and specimen collection in San Francisco was funded by National Heart, Lung, and Blood Institute (NHLBI) grant R01 HL090335 and HL090335-02S109 (to L. H.). C. M. P. was supported by National Institute of General Medicine Sciences T32 GM008719, T32 GM007092, and a grant from the IDSA Medical Scholars Program. L. H. was supported by NHLBI grant K24 HL087713, R01 HL090335, and U01 HL098964. S. M. T. is supported by NIAID grant K08 AI100924.
Potential conflicts of interest. All authors have submitted the ICMJE Form for Disclosure of Potential Conflicts of Interest. Conflicts that the editors consider relevant to the content of the manuscript have been disclosed.
References


Comments