


Abstract
Human immunodeficiency virus (HIV) remains a global challenge and novel measures for transmission disruption are needed. Contact tracing is limited by reluctance or inability of newly diagnosed individuals to name at-risk contacts. Molecular cluster analysis is mostly used for outbreak investigations, and its role in routine public health activities remains uncertain.
We conducted a 2-year prospective statewide study in Rhode Island to evaluate integration of HIV cluster analyses into routine contact tracing, by attempting to reinterview all new diagnoses who clustered, notifying them of clustering, and evaluating benefits of this strategy. Clustering was compared between a phylogenetic ensemble versus distance-based HIV-TRACE.
Of 100 new diagnoses during 2021–2022, 52 individuals clustered, of whom only 31% were reinterviewed. Reinterviewing did not improve contact tracing beyond initial interviews, and the study was stopped early for futility. Clustering concordance within the phylogenetic ensemble was high (88%–89%), but lower (74%) for HIV-TRACE. Despite hypothesis rejection, we established a public health–academic partnership, developed a bioinformatics pipeline enabling near real-time cluster analysis, and identified gaps and unique opportunities for intervention.
Attempting to reinterview all statewide new HIV diagnoses in molecular clusters showed no evidence of improving contact tracing. However, a strong academic–public health partnership enabled near real-time, longitudinal integration of molecular cluster analysis into routine public health activities, and identified barriers and opportunities tailoring data-driven approaches to unique individual and community characteristics, guiding future work on optimal use of molecular epidemiology to disrupt HIV transmission.
In 2021, when 36 136 people were newly diagnosed with human immunodeficiency virus (HIV) in the United States (US), the Centers for Disease Control and Prevention (CDC) estimated that 1.2 million people were living with HIV, of whom 13% were unaware of it [1]. To confront the persistent challenge of this epidemic and attempt to end it, the US Department of Health and Human Services proposed a new initiative to reduce incident infections by 90% in 10 years [2]. Achieving this goal required implementation of innovative public health measures.
Contact tracing and partner services, hereafter referred to as contact tracing, is a key tool used by US public health agencies to disrupt transmission of HIV and other infectious diseases [3]. In this process, newly HIV-diagnosed individuals (ie, index cases [ICs]) may be interviewed to identify information on their social networks (eg, sexual or needle-sharing partners) and linked to care. Named and identifiable partners are then contacted and offered HIV testing. If contacts test positive for HIV, they become ICs, and if negative and apparently at high risk, referred for prevention services. However, this process can be limited by refusal or inability of ICs to provide partner information, or by resource shortages, leading to limited contact tracing [4].
Phylogenetics, a molecular epidemiology tool to study genomic evolutionary relationships [5], can assess similarity of HIV sequences and identify clusters [4]. Such clustering, which can provide information about the underlying HIV transmission network without asserting specific transmission pathways [6], was recommended by the CDC for HIV prevention as 1 of the 4 pillars to end the epidemic to disrupt transmission, by rapid detection of emerging clusters [7]. To support such efforts, the CDC maintains HIV-TRACE [8], a secure tool it recommends US public health jurisdictions use for outbreak investigations [7].
Currently, molecular epidemiology data are used mainly to detect and investigate clusters and outbreaks of rapid HIV transmission [7]. No guidance exists on whether and how to use a broader definition of clustering in routine day-to-day public health workflow. Recent reports, mostly retrospective [9–11], focus on predicting future transmission (eg, in Florida [12]); developing pipelines, estimating risk networks, and characterizing clusters and acute infections (eg, in North Carolina [13]); developing growth models for IC prioritization (eg, in Illinois [14]); predicting intervention strategies (eg, in San Diego [15]); comparing clustering and time-space analysis (eg, in Los Angeles [16]); or estimating associations between molecular and social clustering (eg, in Houston [17]). Prospective incorporation of statewide molecular clustering into the daily contact tracing workflow of a public health department can greatly inform and enhance the effectiveness of interventions.
Through a statewide public health–academic partnership we established, we examined the Rhode Island HIV epidemic, to better understand HIV clusters and enhance prevention efforts [18–23]. In this article, we present results from a 2-year prospective study, where we leveraged our partnership; developed data pipelines [21], ethical guidelines [22, 24], and protocols [24]; routinely integrated statewide molecular cluster analyses with contact tracing conducted by the Rhode Island Department of Health (RIDOH); and evaluated the impact of this integration, while using various clustering methods. We hypothesized that providing the additional information to the ICs would further motivate them and increase identification of partners, new HIV cases, and people at high risk for acquiring HIV, beyond routine interventions.
METHODS
This prospective study included all ICs ≥18 years old diagnosed with HIV between 1 January 2021 and 31 December 2022, receiving care at a Rhode Island healthcare facility and with an available HIV sequence. The study was approved by, and consent waiver was obtained from, the Lifespan and RIDOH institutional review boards.
All available HIV type 1 (HIV-1) sequences, accessible 3–4 weeks after diagnosis, were obtained from drug resistance testing from persons engaged in clinic care since 2004 (if multiple sequences per person, the earliest was used). This statewide sequence database combines data from the Immunology Center in Providence, serving >80% of Rhode Island's HIV population [22], and nonimmunology clinics (through RIDOH) [18, 19]. Sanger or next-generation pol consensus sequencing was performed by commercial laboratories. Sequence quality control was done with SQUAT principles [25], and subtyping was done using REGA [26] and COMET [27]. Stanford HIV Drug Resistance database [28] code was used to interpret resistance.
Molecular cluster analyses were done using an ensemble of common phylogenetic methods and clustering criteria, based on our prior work [20], with further details in [21]. A cluster-associated IC was defined as an IC who clustered by ≥1 ensemble method or HIV-TRACE. For both the phylogenetic methods and HIV-TRACE, we used relaxed clustering thresholds to allow comparison of the yield of basing decision to reinterview on both relaxed or more strict thresholds (everyone who clusters using a strict threshold also clusters with a more relaxed threshold). Presented bootstrap supports are from RAxML. The pipeline also identified clusters of concern, defined by the CDC as HIV-TRACE clusters using a more strict ≤0.5% distance threshold, with >2 new diagnoses in the last 3 months [29].
We developed an automated real-time pipeline that links sequence and clinical, sociodemographic, and laboratory data extracted from medical records, performs sequence quality control and analysis, determines clustering using the phylogenetic ensemble, and generates an integrated report on each newly diagnosed individual in the state [21]. Each IC is then discussed at monthly meetings by the interdisciplinary team, including clinicians, epidemiologists, bioinformaticians, database managers, biostatisticians, evolutionary biologists, and public health experts.
RIDOH attempts to contact all newly identified ICs by phone and interview them in person or by phone. Following this initial contact tracing, similar efforts are made to locate named partners and offer HIV testing and linkage to care. In this study, we designed a cluster analysis triggered intervention where, following monthly academic–public health multidisciplinary discussions, a disease intervention specialist (DIS) attempted to contact and invite each cluster-associated IC to a reinterview, in person or by phone. In the reinterview, the DIS made the IC aware of their clustering (“… the strain of HIV that you have has been increasingly common in Rhode Island”) and asked about additional partners. If clustering information was available before the initial interview, cluster analysis information was not included, and we refer to such interviews as “combined” interviews (see pipeline [21] and study protocol details [24]). One CDC-trained DIS conducted all initial and reinterviews.
To evaluate the added value of the cluster analysis triggered intervention, we intended to quantify in the reinterview (1) ICs naming ≥1 new sexual/needle-sharing partner; (2) number of new notifiable partners, defined as provided with a name and contact information (eg, phone number or email address); (3) number of notifiable newly HIV-diagnosed partners; and (4) number of partners newly tested for HIV.
The study's primary objectives were to compare (1) adding HIV-TRACE–only triggered intervention to standard of care (SOC; ie, only initial interview with no cluster analysis input); (2) adding cluster analysis triggered intervention triggered by the phylogenetic ensemble to SOC; and (3) SOC only in terms of the quantified measures. For a given evaluation measure and cluster analysis method(s), the yield of the cluster analysis triggered intervention is the yield of the outcomes listed above from the cluster analysis triggered reinterview. A key secondary objective was to evaluate concordance between different clustering methods.
Statistical Methods
The primary objectives were to be tested using a generalized linear mixed-effects model with the evaluation measure as the outcome, indicator of cluster analysis triggered intervention as a fixed effect, and IC as a random effect. Two-sided hypothesis tests were to be used when comparing phylogenetic methods versus HIV-TRACE. As by design, HIV-TRACE and phylogenetic methods cannot yield lower evaluation measures than SOC, all SOC comparisons were 1-sided. As cluster analysis triggered intervention was triggered by clustering in ≥1 method, we could evaluate the impact of each method by associating the cluster analysis triggered intervention yield only to methods where the corresponding IC clustered. As further detailed in the Supplementary material, all comparisons can be done without randomizing ICs to clustering methods enhancing feasibility. As a secondary analysis to characterize the study cohort, χ2 tests and t tests were used to determine associations between clustering status and demographic and contact tracing information. To estimate concordance between each pair of clustering methods, we define concordance as the average of (1) percentage of sequences that cluster by method 1 that also cluster by method 2, and (2) percentage of sequences that cluster by method 2 that also cluster by method 1. For power analysis and further information on study design, see the Supplementary material.
RESULTS
Study Participants
As of 31 December 2022, the Rhode Island statewide epidemic was represented by sequences from 2513 persons with HIV-1 (73% male; median age at diagnosis, 33 years; 43% men who have sex with men [MSM]; 26% Hispanic, 63% White, 31% Black or African American; 64% US-born; and 50% reporting substance use history). Between 1 January 2021 and 31 December 2022, 100 ICs were HIV-diagnosed in Rhode Island (48 in 2021; 52 in 2022), with similar characteristics to the statewide epidemic described above (Table 1).
Characteristics of Newly Human Immunodeficiency Virus–Diagnosed Rhode Island Individuals During the Study Period, Stratified by Molecular Clustering
| Characteristic | All (n = 100) | In Cluster (n = 52) | Not in a Cluster (n = 48) |
|---|---|---|---|
| Gender | |||
| Female | 18 (18) | 8 (15) | 10 (21) |
| Male | 80 (80) | 43 (83) | 37 (77) |
| Transgender | 2 (2) | 1 (2) | 1 (2) |
| Age at diagnosis, y | |||
| Mean (SD) | 39 (14) | 39 (13) | 39 (15) |
| MSM | |||
| Not MSM | 43 (43) | 18 (35) | 25 (52) |
| MSM | 57 (57) | 34 (65) | 23 (48) |
| Ethnicity | |||
| Missing | 1 (1) | 0 (0) | 1 (2) |
| Non-Hispanic | 75 (75) | 40 (77) | 35 (73) |
| Hispanic | 24 (24) | 12 (23) | 12 (25) |
| Race | |||
| Missing | 12 (12) | 4 (8) | 8 (17) |
| Asian | 1 (1) | 0 (0) | 1 (2) |
| Black | 26 (26) | 14 (27) | 12 (25) |
| Other | 5 (5) | 3 (6) | 2 (4) |
| White | 56 (56) | 31 (60) | 25 (52) |
| Country of birth | |||
| Missing | 12 (12) | 4 (8) | 8 (17) |
| Not United States | 37 (37) | 16 (31) | 21 (44) |
| United States | 51 (51) | 32 (62) | 19 (40) |
| Injection drug user | |||
| Not injection drug user | 97 (97) | 50 (96) | 47 (98) |
| Injection drug user | 3 (3) | 2 (4) | 1 (2) |
| Substance use | |||
| Missing | 11 (11) | 4 (8) | 7 (15) |
| No substance use | 44 (44) | 26 (50) | 18 (38) |
| Substance use | 45 (45) | 22 (42) | 23 (48) |
| HIV-1 subtype | |||
| Subtype B | 83 (83) | 45 (87) | 38 (79) |
| Not subtype B | 17 (17) | 7 (13) | 10 (21) |
| CD4 count at diagnosis (cells/microliter) | |||
| Mean (SD) | 352 (278) | 401 (288) | 294 (259) |
| Log viral load at diagnosis (copies/mililiter) | |||
| Mean (SD) | 4.80 (1.0) | 4.96 (0.7) | 4.62 (1.3) |
| Transmitted drug resistance | |||
| PR | 3 (3) | 0 (0) | 3 (6) |
| RT | 24 (24) | 12 (23) | 3 (25) |
| RT and/or PR | 25 (25) | 12 (23) | 13 (27) |
| Days between diagnosis and first interview, mean (SD) | 41.2 (26) | 46.5 (32) | 35.7 (16) |
| Days between first and second interviews, mean (SD) | 68.3 (56) | 68.3 (56) | Not applicable |
Data are presented as No. (%) of participants unless otherwise indicated.
Abbreviations: HIV, human immunodeficiency virus; MSM, men who have sex with men; PR, protease; RT, reverse transcriptase; SD, standard deviation.
From initial interviews conducted with 83 of 100 ICs (79 by telephone; 4 in person), 46 ICs (44 by telephone; 2 in person) named 71 partners (0.86 partners per interviewed IC), of whom 51 were notifiable (0.61 per interviewed IC).
Cluster Analyses
Within the 2513 statewide sequences, 52% of the 100 ICs clustered by the phylogenetic ensemble, in clusters ranging in size from 2 to 28 members (median, 4), with RAxML bootstrap support ranging from 81 to 100 (median, 100) (Figure 1). The most notable differences between characteristics of ICs who did and did not cluster were for MSM (65% vs 48%) and being born in the US (62% vs 40%) (Table 1 and Table 2), but none of them were statistically significant. By the end of 2022, the clusters that the 52 ICs were part of included 26, 45, and 64 cluster members who were diagnosed in the prior 6, 12, and 18 months, respectively, representing accumulation of clustered ICs over time within the prospective study.
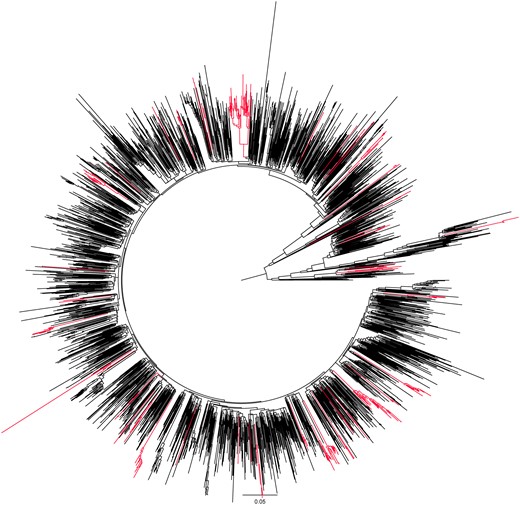
Phylogenetic relationships between human immunodeficiency virus type 1 (HIV-1) sequences in Rhode Island. The circular phylogenetic tree generated with RAxML includes 2513 HIV-1 pol sequences available in Rhode Island by the end of December 2022. Highlighted branches demonstrate clusters with at least 1 of the 100 index cases diagnosed during the 2-year study period in 2021–2022. The branch lengths are drawn to the scale at the bottom of the tree, representing evolutionary distances between the taxa (substitutions per site).
Initial Contact Tracing Interview Outcomes of Cluster-Associated Index Cases Stratified by Molecular Clustering
| Outcome | All (n = 100) | In a Cluster (n = 52) | Not in a Cluster (n = 48) |
|---|---|---|---|
| No. of ICs who named at least 1 partner | 46 | 29 | 17 |
| Total No. of named partners | 71 | 41 | 30 |
| Mean (SD) No. of named partners per IC | 0.71 (1.25) | 0.79 (0.95) | 0.63 (1.54) |
| Named at least 1 notifiable partner, No. (%) of participants | 34 (34.0) | 23 (44.2) | 11 (22.9) |
| Mean (SD) No. of notifiable partners per IC | 0.51 (1.05) | 0.62 (0.87) | 0.40 (1.22) |
| Mean (SD) No. of partners newly tested for HIV per IC | 0.16 (0.44) | 0.25 (0.56) | 0.063 (0.24) |
Abbreviations: HIV, human immunodeficiency virus; IC, index case; SD, standard deviation.
Among the different phylogenetic methods, most ICs clustered by RAxML (51/100) and the fewest by FastTree aLRT (42/100), whereas only 22 of 100 clustered by HIV-TRACE (Table 3). The clustering concordance within the ensemble methods was high (eg, 0.88 for RAxML, FastTree, and FastTree aLRT, and 0.89 for IQ-TREE and MEGA) and lower between the phylogenetic methods and HIV-TRACE (0.74) (Table 3). All participants that clustered with HIV-TRACE also clustered by all the phylogenetic methods.
Clustering Results by Phylogenetic Ensemble Methods and HIV-TRACE With the Statewide Sequence Database
| Clustering Method | HIV-TRACE 1.5% | RAxML | IQ-TREE | FastTree | FastTree aLRT | MEGA | Any Phylogenetic Method |
|---|---|---|---|---|---|---|---|
| HIV-TRACE 1.5% | 22 | 22 | 22 | 22 | 22 | 22 | 22 |
| RAxML | … | 51 | 43 | 45 | 41 | 47 | 51 |
| IQ-TREE | … | … | 44 | 41 | 42 | 42 | 44 |
| FastTree | … | … | … | 46 | 39 | 43 | 46 |
| FastTree aLRT | … | … | … | … | 42 | 40 | 42 |
| MEGA | … | … | … | … | … | 47 | 47 |
| Any phylogenetic method | … | … | … | … | … | … | 52 |
Each number shows how many index cases clustered by both the method listed in the column and the method listed in the row. As outlined further in [20], methods included phylogenetic programs FastTree (GTR + G model; 80% bootstrap support; 4.5% genetic distance), FastTree with the alternative likelihood ratio test (GTR + G model; 90% aLRT support; 3.0% genetic distance), IQ-TREE in ultrafast bootstrap mode (GTR + F + G model; 95% bootstrap support; 3.0% genetic distance), MEGA (GTR + G + I model; 80% bootstrap support; 4.5% genetic distance), and RAxML (GTRCAT model; 80% bootstrap support; 4.5% genetic distance); and the distance-only based HIV-TRACE with 1.5% distance. These parameters represent relaxed criteria to enable comparison of the yield of basing reinterview decisions on both relaxed and strict thresholds.
All ICs who had HIV-TRACE cluster analysis triggered intervention also had it triggered by the phylogenetic ensemble, and 30 ICs had an intervention triggered by the phylogenetic ensemble but not by HIV-TRACE (for those 30, the reinterview yield would only be attributed to the ensemble).
During the 2-year study period, 1 CDC cluster of concern was identified (HIV-TRACE average genetic distance 0.03%), with 3 members, all MSM, and 1 with noninjection substance use, all diagnosed within 5 months in 2021. This cluster was reported to CDC, and per guidance, monitored closely by RIDOH, including interviewing, contact tracing, partner services, testing, education, and linkage to care. Using RAxML, this cluster increased to 6 members (bootstrap support 100%; genetic distance 3.3%), with 3 additional males, 1 MSM, and none with substance use; 1 was diagnosed in 2004 and 2 in 2019 (Figure 2A).
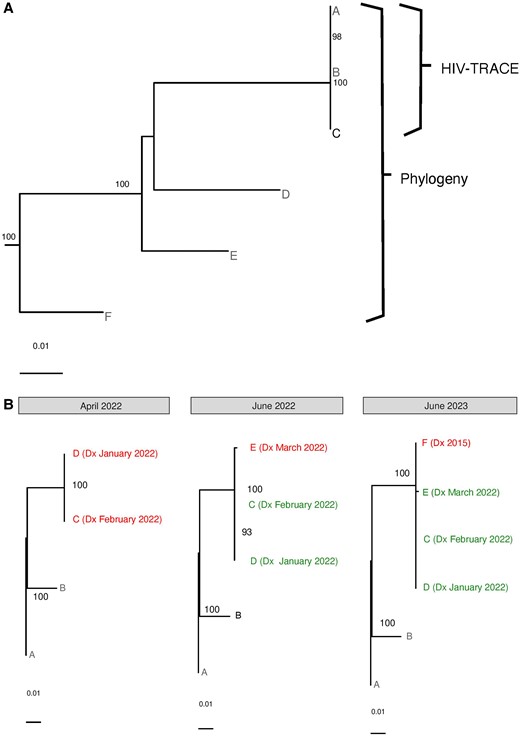
Examples of selected molecular clusters in Rhode Island. The figure demonstrates 2 examples of selected phylogenetic clusters identified during the 2-year study period in Rhode Island. A, A Centers for Disease Control and Prevention cluster of concern (A, B, C) identified by HIV-TRACE, with additional members (D, E, F) identified by phylogeny. B, The longitudinal evolution of a cluster of people who inject drugs, demonstrating those newly diagnosed (in red) and recently diagnosed (in green). “Dx” next to sequence names indicates diagnosis dates and the months in which clusters were identified are indicated by gray bars above the trees (June 2023 is beyond the 2-year study time period, but enabled by continued monthly statewide cluster analyses). Trees were created with RAxML; bootstrap support >80% is shown, with the scale shown at the bottom of the trees. See text in Results, Cluster Analyses for more details.
Another notable cluster was detected after 2 new HIV diagnoses were simultaneously reported from the state laboratory and a methadone program, with concern about needle sharing. This triggered urgent, same-day partner services, resulting in confirmation of needle sharing, with reporting of possible exposure of approximately 35 additional people. Despite challenging communications with the affected population, RIDOH immediately linked patients to HIV care, and worked with community-based organizations to increase activity at the location, including regular check-ins, daily incentivized testing and retesting and their tracking, and distribution of safe injection kits, condoms, and naloxone. The specific location this occurred in was eventually closed. Overall, 23 HIV tests were administered with no further new diagnoses. Cluster analysis in the monthly multidisciplinary meetings identified a cluster with the original 2 ICs (100% bootstrap support; genetic distance 0.081%) (Figure 2B). Two months later, a third IC from the same needle-sharing incident was noted in the monthly meeting as added to this cluster (100% bootstrap support; genetic distance 0.14%). Despite extensive efforts, this IC could not be located (the sequence was obtained from a 1-time emergency room visit). Finally, a year later, a sequence from a fourth individual, diagnosed in 2015, became available and was added to the same cluster (100% bootstrap support; genetic distance 1.4%) (Figure 2B).
Cluster Analysis Triggered Intervention
In their initial interviews, 29 (56%) of the 52 cluster-associated ICs named 41 partners, 32 of whom were notifiable (Table 2). The remaining 23 either did not have an initial interview (n = 10) or named no partners during the initial interview (n = 13). Of 52 cluster-associated ICs, only 16 (31%) were reinterviewed, and 15 (94%) provided no additional information beyond the initial interview. This “additional” partner was likely also named in the initial interview, but as that could not be fully validated, we considered them different.
Of the remaining cluster-associated ICs, 20 of 52 (38%) were not reinterviewed for various reasons (Table 4), and 16 of 52 (31%) had “combined” interviews, since molecular results were available before the initial interview. During these combined interviews, ICs named 9 partners (average 0.56/person), 8 of whom were notifiable (average 0.5/person), comparable to initial interviews (0.71 and 0.51, respectively).
Reinterview Outcomes for Cluster-Associated Index Cases
| Outcome | 2021 | 2022 | Total |
|---|---|---|---|
| Reinterview yield | |||
| Potentially new information | 1 (2%) | 0 (0%) | 1 (2%) |
| No other information | 8 (15%) | 7 (13%) | 15 (29%) |
| Total cluster-associated ICs | 9 (17%) | 7 (13%) | 16 (31%) |
| Reason reinterview not conducted | |||
| Combined interview | 10 (19%) | 6 (12%) | 16 (31%) |
| Unable to locate for only reinterview | 2 (2%) | 6 (12%) | 8 (15%) |
| Unable to locate for both interviews | 0 (0%) | 1 (2%) | 1 (2%) |
| Refused | 2 (4%) | 4 (8%) | 6 (12%) |
| Out of jurisdiction | 1 (2%) | 1 (2%) | 2 (4%) |
| Sensitivea | 0 (0%) | 3 (6%) | 3 (6%) |
| Total cluster-associated ICs | 15 (29%) | 21 (40%) | 36 (69%) |
| Grand total cluster-associated ICs | 24 (46%) | 28 (54%) | 52 |
Abbreviation: IC, index case.
aFor example, reasons related to mental health or domestic violence.
For all evaluation measures except number of new notifiable partners elicited from cluster-associated ICs, the yield from reinterviews was zero and hence the combined yield from the initial and reinterviews was identical for all methods and all participants. Thus, for the hypothesis with no between-method variability in yield, the generalized linear mixed-effects model could not be fit. We therefore do not present estimators, P values, or confidence intervals (CIs) for these comparisons. When comparing number of named notifiable partners to SOC, the estimate from the mixed-effects model was 0.01 (standard error, 0.12 [95% CI, −.22 to .24]; P = .47) for both the ensemble and HIV-TRACE as the cluster-associated IC that provided the (potentially) new notifiable partner clustered by both ensemble and HIV-TRACE. The study was designed to conduct cluster analysis triggered intervention for 3 years, but its low yield in the first 2 years led to its discontinuation for futility and the effect sizes seen in the first 2 years of the study were substantially smaller than the effect sizes used in the power calculations.
DISCUSSION
In a 2-year prospective study, leveraging an interdisciplinary academic–public health collaboration, we incorporated statewide molecular cluster analyses into routine public health contact tracing efforts. We assessed the effectiveness of using this information to attempt reinterviewing all new cluster-associated ICs, hypothesizing that this cluster analysis triggered intervention will improve contact tracing. We did not find evidence of a difference, and the study was stopped early for futility. However, we posit that this does not imply lack of benefit for alternative ways to incorporate clustering information into routine contact tracing, and that findings offer valuable insights and opportunities to guide us and other public health jurisdictions, while identifying key challenges and potential hurdles as we continue to identify the optimal use of molecular epidemiology as an important tool to end the HIV epidemic.
Our main finding, that attempting to reinterview all cluster-associated ICs beyond initial interviews is not beneficial, raises several informative considerations. First, only 31% of cluster-associated ICs in our cohort were reinterviewed, and the rest had either 1 combined interview, just an initial interview, or no interview, suggesting public health gaps in reaching out to or difficulties in establishing contact with newly diagnosed individuals [30]. Second, partner naming was limited to only 55% of interviewed ICs, and related services were therefore also restricted, reducing yield in initial, but more profoundly in reinterviews. Third, conveying cluster analysis information to and ensuring its understanding by ICs to increase engagement is challenging, and would likely be optimized if individualized, better facilitating assessment of benefit. Fourth, as outlined in more detail elsewhere [31], the DIS indicated that the reinterviews seemed at times to be confusing to the ICs and viewed as intrusion to their privacy, perhaps underscoring the necessity for clearer communication regarding their importance. Further evaluations of these speculations are ongoing. Fifth, partner anonymity and/or the desire to keep it as such present substantial challenges to contact tracing in initial or reinterviews. Last, conducting reinterviews in sensitive cases (eg, mental health or domestic violence) is likely to be avoided. Similar results have been partly reported, emphasizing the challenges of anonymity, discomfort with sharing partner information, and perception of interviews as being long and intrusive [30, 32].
We perceived that additional information could be obtained through reinterviews. However, considerations outlined above also suggest the need to balance efforts to integrate molecular information and contact tracing, on the one hand, with efforts to maintain rapport between public health and newly diagnosed persons, on the other [33]. Additionally, reinterviewing individuals closer to their diagnosis or to initial interviews, when they may be more engaged and inclined to cooperate, could be effective. This approach could yield better results compared to reinterviewing them later (eg, ∼10 weeks after first interviews, as occurred here), when their clinical care is already established and they may be less interested in revisiting past partners. Whether incorporating clustering information into a “combined interview” is beneficial should be determined. While partner anonymity remains a challenge, and larger cohorts are needed to measure small effects, we speculate that benefit may be interviewer-dependent, and more targeted reinterviews might benefit some, rather than all, newly diagnosed individuals, perhaps those facing barriers to care, who may benefit from increased public health services, or focusing efforts on rapidly growing clusters.
While recognizing our hypothesis rejection, several insights emerged offering future guidance. First, a strong academic–public health partnership and routine multidisciplinary meetings are important to exchange ideas and support innovation to minimize HIV transmission. Second, a bioinformatics pipeline that combines databases from different, traditionally siloed systems, enables beneficial routine data integration, longitudinal cluster visualization, and comprehensive epidemic characterization [18–21, 23]. Third, when considering molecular cluster analysis for public health efforts, expanding beyond solely examining cluster-associated ICs, may be beneficial. Including unclustered individuals or other cluster members, for whom sequences are typically available but not routinely included in analyses and interventions, can provide valuable insights into transmission networks (eg, reinterviewing members of clusters with more cluster members recently diagnosed, as identified here). This broader approach may aid in identifying undiagnosed, unlinked to care or high-risk individuals. Fourth, inability to explore interstate clusters likely poses a major challenge to transmission disruption. Last, though not explored here, initiatives to enhance molecular cluster analyses, like obtaining missing sequences, and using longer (rather than single gene sequences) for phylogenetic analysis, may improve statewide inference. Taken together, despite our “negative” finding, these observations support the need to continue to implement and evaluate routine integration of molecular and public health data.
Additional benefits to our approach were evident by the 2 selected clusters described. The academic support of public health enabled near-real-time identification of 1 CDC cluster of concern by HIV-TRACE, and its expansion by phylogeny. Cluster investigations continued to reflect difficulties, including 7 claimed sex/needle-sharing partners, 1 of whom was previously known to have HIV, 1 of whom resided out of jurisdiction, and 5 of whom were unlocatable. Similarly, monthly meetings and routine cluster analyses enabled identification of the injection-use cluster, its longitudinal tracking, expansion, and eventual limit. Again, investigation challenges included multiple failed engaging attempts and inconsistent engagement in care, despite intense efforts. Such challenges represent life situations not conducive to traditional partner services (eg, unstable housing, substance use, unpredictable communication capacity, limited partner contact information, transportation), justifying the need for innovative methods like cluster analysis.
Noteworthy differences were observed when comparing clustering within phylogenetic methods (good concordance), and between them and HIV-TRACE, even with the more permissive 1.5% threshold (lower concordance). These results align with our prior work [20] and are not surprising, since the distance-based HIV-TRACE is mostly recommended for outbreak prevention and its lower cluster identification may be expected. We intentionally used relaxed criteria to define clustering, which diverges from methods that focus only on identifying rapidly evolving clusters. One additional notable observation relates to the high range (42%–51%) of clustering in the state as compared to our prior work from 2004 to 2018 (range 38%–45%) [20]. Whether this 2-year Rhode Island epidemic snapshot, enabled by a comprehensive longitudinal statewide sequence database, denotes a real trend, suggesting better representation of the statewide epidemic and perhaps more instate transmissions, remains to be determined and will inform public health activities.
The study had some limitations. First, Rhode Island is small and, unlike most states, conducts contact tracing among all ICs, potentially limiting generalizability. However, common CDC protocols implemented across states enhance generalizability, and methods can be implemented in larger settings. Second, the study coincided with coronavirus disease 2019 restrictions, likely impacting contact tracing workflow and growing distrust in public health, altering interactions and possibly affecting their number and nature and hesitancy to provide partner information. Third, transmission networks do not respect state borders and the lack of between-state data sharing prevented identification of multistate networks. Fourth, the study design prevented the ability to disentangle whether results were due to reinterviewing versus cluster-based information. Last, efficiency of contact tracing efforts, particularly if including cluster analysis data, can be influenced by factors like staff turnover and building relationships [30].
In conclusion, attempting to reinterview all cluster-associated ICs in a statewide HIV epidemic was futile and did not improve contact tracing. Nevertheless, a strong academic–public health partnership enables near real-time routine integration of molecular cluster analysis into daily public health operations, and holds potential for making a substantial impact on disrupting HIV transmission. The precise means by which this goal will be achieved remain a subject of future research and will likely involve tailoring data-driven approaches to unique individual and community characteristics. Nevertheless, we postulate that this important tool with a strong academic–public health partnership can and will assist in disrupting HIV transmission and innovative pipelines, expanding of sequence data use, and enhancing cluster analyses methods, and guide efforts to identify optimal strategies to integrate molecular epidemiology information into public health practices, as we continue to work toward ending the HIV epidemic in Rhode Island and beyond.
Supplementary Data
Supplementary materials are available at Open Forum Infectious Diseases online. Consisting of data provided by the authors to benefit the reader, the posted materials are not copyedited and are the sole responsibility of the authors, so questions or comments should be addressed to the corresponding author.
Notes
Author contributions. R. K. conceived the study. R. K., J. S., and J. F. designed the study. R. K. and J. S. drafted the initial manuscript. All authors critically reviewed the manuscript for important intellectual content and were involved in acquisition, analysis, and/or interpretation of data. Statistical analysis was conducted by J. S., R. K., and J. H. Funding for the work was obtained by R. K.
Data sharing. Due to their sensitivity, the data used in this article cannot be shared.
Financial support. This research was funded by the US National Institutes of Health (grant numbers R01AI136058, K24AI134359, and P30AI42853 to R. K.).
References
Author notes
Presented in part: This work was presented at the Conference on Retroviruses and Opportunistic Infections, Abstract 1063, Denver, Colorado, 3–6 March 2024.
R. K. and J. S. contributed equally to this work.
Potential conflicts of interest. All authors: No reported conflicts.


Comments