


Abstract
Background. Elimination of tuberculosis (TB) in the United States requires treating not only persons with active disease but also those infected with TB. Achieving this goal requires understanding local TB infection prevalence and identifying subgroups at increased risk for infection and disease.
Methods. The study population included all patients tested with an interferon-gamma release assay (IGRA) test at New York City (NYC) public TB clinics from October 1, 2006 to December 31, 2011. Patients who were not a case or contact at testing (general clinic patients) and who had a positive QuantiFERON-Gold In-Tube (QFT-GIT) test result were compared with those with indeterminate or negative results to identify characteristics associated with positive results. New York City TB surveillance data were used to identify clinic patients later diagnosed with active TB disease.
Results. A total of 69 273 IGRA tests were conducted. Among 20 066 patients tested with QFT-GIT, 16% tested positive, 83% tested negative, and <1% were indeterminate. Of 18 481 general clinic patients, 14% had a positive QFT-GIT result. Nine percent of United States-born patients compared with 19% of foreign-born patients had a positive result. Increasing age and birth in a high-incidence country were associated with a higher likelihood of having a positive result. One patient with a negative QFT-GIT result was identified as a TB case 2 years later.
Conclusions. Using QFT-GIT data, the background prevalence of TB infection in NYC was estimated. Patient characteristics associated with a positive QFT-GIT result were consistent with known TB risk factors. Results suggest that IGRAs are reliable tests for TB infection.
To continue moving towards elimination of tuberculosis (TB) in the United States requires not only treating current cases of active disease but also addressing the much larger population of persons with TB infection that serves as a reservoir for future TB cases. National guidelines recommend targeted testing and treatment of high-risk populations for TB infection as one part of a comprehensive approach to controlling TB [1]. Implementing this strategy requires knowing the background prevalence of TB infection and identifying the populations at greatest risk. The 1999–2000 National Health and Nutrition Examination Survey (NHANES) measured the prevalence of TB infection in the general population using the tuberculin skin test (TST) [2]. The NHANES data were collected to be representative on a national level and are not necessarily reflective of local epidemiology; this is especially true for urban and metropolitan areas, such as New York City (NYC), which have large and diverse populations that cannot be characterized by extrapolating national data [3].
A study of patients tested with the TST in NYC Department of Health and Mental Hygiene (DOHMH) TB clinics from 2002 to 2004 found a TB infection prevalence of 24% [4]. Since this study, new blood-based tests for TB infection have become widely available. These interferon-gamma release assays (IGRAs) are thought to be an improvement over the TST because they are more specific to Mycobacterium tuberculosis complex, do not yield false-positive results due to prior bacillus Calmette-Guérin (BCG) vaccination, and do not cross-react with most nontuberculous mycobacteria [5–7]. In addition, they require only a single medical visit and produce instrument-derived quantitative results, which are not subject to reader bias [8–10].
New York City is the city in the United States with the highest TB burden, with 651 cases reported in 2012 [11, 12]. The NYC DOHMH operates 4 TB clinics that provide TB evaluation and treatment services free of charge to the patient. These clinics handle over 50 000 patient visits and conduct over 5000 TB infection tests annually [12]. New York City began using the QuantiFERON-Gold IGRA (Cellestis Limited, Carnegie Victoria, Australia) as the standard diagnostic test for TB infection in DOHMH TB clinics in 2006; in November 2009, the clinics began using the next generation QuantiFERON-Gold In-Tube test (Cellestis Limited). Data from this setting offer a unique opportunity to establish estimates of TB prevalence and identify higher-risk groups within this patient population [4]. We present an analysis of IGRA tests conducted in NYC TB clinics, including the characteristics associated with having a positive test result.
METHODS
The study included all IGRA tests conducted at NYC DOHMH TB clinics from October 1, 2006 to December 31, 2011. Before 2009, the population eligible for testing included individuals tested for work, school, or contact investigation, as well as others at risk for TB infection. In 2009, testing protocols were amended in response to decreasing resources and testing was limited to only those individuals believed to be at highest risk for TB infection or those mandated to be tested by the NYC Health Code: contacts to TB cases, entrants to public housing, homeless shelters and drug treatment facilities, and patients referred by outside providers. Patients were seen both by appointment and on a walk-in basis. Blood draws were performed by trained phlebotomists at the clinics. Specimens were picked up by courier at scheduled times each weekday and transported to the Quest Diagnostics regional laboratory in Teterboro, New Jersey where they were incubated, processed, and tested. Blood draws were not performed after the last daily pick-up time to ensure that specimens were incubated within recommended time limits (≤12 h from collection for QuantiFERON-Gold [QFT-G]; ≤16 h for QuantiFERON-Gold In-Tube [QFT-GIT]) [13, 14].
Data were extracted from the chest clinic electronic medical record (EMR) system (DigitalClinic, eVero Corporation, Melville, NY) and the TB surveillance and case management system (“TB registry”) (Maven, Consilience Software, Boston, MA). Interferon-gamma release assay test results are reported with both a qualitative result (positive, negative, or indeterminate) and quantitative values representing the interferon-gamma response to TB antigen, mitogen control, and nil control. Tests with missing or incomplete quantitative results were excluded. Electronic reporting of test results began at all clinics in November 2010. To evaluate data accuracy, qualitative results were calculated as specified by the test manufacturer and compared with the EMR data as entered; all discrepancies were investigated [13, 14]. For unresolved discrepancies in which the results were electronically reported, the recalculated qualitative result was retained because some ongoing manual entry of qualitative results was observed; otherwise, the original, manually entered qualitative result was used on the assumption that qualitative results were more likely to be entered accurately than quantitative results.
To better estimate the prevalence of TB infection in the general population, patients identified as active TB cases or as contacts to a TB case were excluded. The reasons for conducting IGRA tests were not consistently recorded in the EMR. To identify patients who were evaluated as cases or contacts, the EMR data were deterministically matched to the TB registry as of September 30, 2013 using patient identifiers and demographic characteristics. Active TB cases were identified as patients who had a QFT-GIT test conducted within 6 months before or after their date of diagnosis; these periods were selected to reflect standard treatment length and time to diagnosis. Contacts were those exposed to an active TB case with a QFT-GIT test conducted 3 months before to 9 months after the date of last exposure; the 3-month period was selected to account for the infectious period of the index case, and the 9-month period allowed for ample time to complete contact investigation [15, 16]. The general clinic sample population included patients who were neither cases nor contacts. The registry match was additionally used to identify patients later diagnosed with active TB disease.
The total number and proportion of positive, negative, and indeterminate test results were calculated for all tests conducted during the study period. The remainder of the analyses focused on general clinic population patients tested with QFT-GIT; this population was selected because adoption of QFT-GIT followed changes in clinic testing policy, and this test remains the standard of care in the clinics. For patients with multiple QFT-GIT tests performed, the most recent QFT-GIT test result for each patient, representing the patient's final infection status during the study period, was retained and earlier results were excluded to create a sample of unique patients. To identify risk factors for having a positive QFT-GIT test result, the demographic, social, and clinical characteristics of patients whose most recent test result was positive were compared with those with indeterminate or negative results using Pearson's χ2 test. Wilcoxon 2-sample tests were used to compare medians for continuous variables. Patient characteristics significantly associated with having a positive result in the unadjusted analysis (P < .05) and not correlated with other significant characteristics based on Pearson's correlation coefficient (P < .05) were included in an adjusted multivariate logistic regression model.
The proportion of positive QFT-GIT test results was calculated for all countries of birth with more than 100 patients tested. Although US-born was defined as birth in the United States, Puerto Rico, or other United States territories and outlying areas in all other analyses, Puerto Rico was considered separately here because it represents a large, higher-risk portion of the US-born group. The QFT-GIT-positive proportion was compared using linear regression to each country's estimated TB incidence, which was calculated using the average of World Health Organization (WHO) national estimated TB incidence rates from 1990 to 2011 [17]. The earlier WHO data were used to account for varying time in the United States among foreign-born individuals. Studentized deleted residuals were used to identify countries of birth with a higher or lower than expected proportion of positive test results. World Health Organization data were also used to classify countries as low-, medium-, or high-incidence based on tertiles as follows: low-incidence, 0–29 TB cases per 100 000 persons; medium-incidence, 30–139 cases per 100 000 persons; and high-incidence, ≥140 cases per 100 000 persons. This study was approved by the NYC DOHMH Institutional Review Board.
RESULTS
Study Population
From October 1, 2006 to December 31, 2011, 70 386 IGRA tests were conducted; 1113 (2%) tests with missing or incomplete quantitative results were excluded, leaving a total of 69 273 tests (Figure 1). Of these, 48 495 (70%) were conducted with QFT-G and 20 778 (30%) were conducted with QFT-GIT. Figure 2 shows the total number of IGRA tests performed over the full study period and the percentage positive by quarter. The number of tests performed dropped in 2009 concurrent with the change in clinic testing policy and shortly before the switch to QFT-GIT. The percentage of test results that were positive also began to increase from this point. Overall, 9% of all test results were positive (7% QFT-G, 16% QFT-GIT); 89% were negative (91% QFT-G, 83% QFT-GIT); and 2% were indeterminate (2% QFT-G, 1% QFT-GIT).
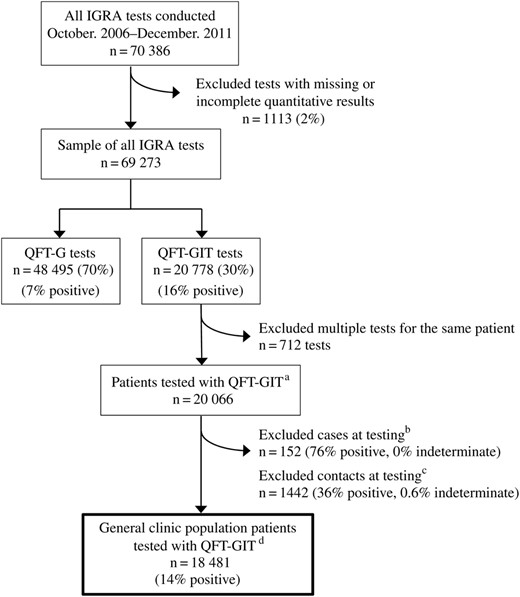
Interferon-gamma release assay (IGRA) tests using QuantiFERON-Gold (QFT-G) and QuantiFERON-Gold In-Tube (QFT-GIT) conducted in New York City (NYC) health department clinics, October 2006–December 2011. (a) To create a sample of unique patients, the most recent QFT-GIT test result was retained for each patient. Six hundred eighty-eight patients had multiple QFT-GIT tests conducted; 664 patients had a total of 2 tests during the study period (664 tests removed), and 24 patients had 3 tests conducted (48 tests removed) for a total of 712 tests removed from the analysis. (b) Cases were patients who were active tuberculosis (TB) cases and had an IGRA test conducted 6 months before to 6 months after the patient's date of diagnosis; these time periods were selected to reflect standard treatment length and time to diagnosis. (c) Contacts were patients who were exposed to an active TB case and had an IGRA test conducted 3 months before to 9 months after the date of last exposure; the 3-month period was selected to account for the infectious period of the index case, and the 9-month period reflects the time required for contact investigation to be completed in NYC. (d) General clinic population patients were those who were neither a case nor a contact at the time of testing.
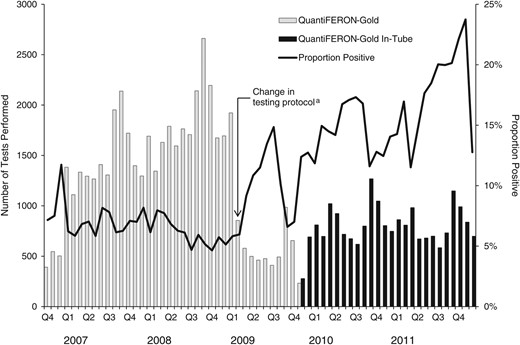
Interferon-gamma release assay tests performed and percentage of positive test results, New York City (NYC), October 2006–December 2011 (N = 69 273 tests). (a) Testing protocols were amended in 2009, limiting testing to only those individuals at highest risk for TB infection or those mandated to be tested by the NYC Health Code: contacts to TB cases; entrants to public housing, homeless shelters, and drug treatment facilities; and patients referred by outside providers.
QuantiFERON-Gold In-Tube Results for General Clinic Population
Restricting the sample to only the most recent QFT-GIT result for each patient and excluding patients determined to be cases or contacts at testing resulted in a final general clinic sample population of 18 481 patients (Figure 1). Overall, 14% had a positive test result, 85% had a negative result, and <1% had an indeterminate result (Table 1). The proportion of positive test results increased with age, ranging from 3% of 0–4 year olds testing positive to 42% of patients aged ≥65 years. Females were slightly less likely to have a positive result than males (13% vs 15%). By self-reported race and ethnicity, Asians had the highest proportion of positive results, with 21% having a positive result.
Characteristics of General Clinic Populationa Patients by Most Recent QuantiFERON-Gold In-Tube Result, New York City, November 2009–December 2011 (n = 18 481 Patients)
| Characteristic | Total n (%) | Positive n (%) | Negative n (%) | Indeterminate n (%) | Unadjusted ORb (95% CI) | Adjusted ORb,c (95% CI) |
|---|---|---|---|---|---|---|
| Total persons | 18 481 | 2644 (14) | 15 749 (85) | 88 (<1) | – | – |
| Age group | ||||||
| 0–4 years | 66 (0) | 2 (3) | 64 (97) | 0 (0) | .23 (.60, .92)* | .16 (.04, .67)* |
| 5–18 years | 7052 (38) | 788 (11) | 6250 (89) | 14 (0) | .91 (.82, 1.00) | .49 (.44, .55)* |
| 19–44 years | 7245 (39) | 883 (12) | 6320 (87) | 42 (1) | Ref | Ref |
| 45–64 years | 3627 (20) | 764 (21) | 2834 (78) | 29 (1) | 1.92 (1.73, 2.14)* | 1.92 (1.71, 2.16)* |
| ≥65 years | 491 (3) | 207 (42) | 281 (57) | 3 (1) | 5.24 (4.33, 6.37)* | 3.84 (3.12, 4.72)* |
| Sex | ||||||
| Male | 10 998 (60) | 1660 (15) | 9280 (84) | 58 (1) | Ref | Ref |
| Female | 7483 (40) | 984 (13) | 6469 (86) | 30 (1) | .85 (.78, .93)* | .87 (.80, .95)* |
| Race/Ethnicity | ||||||
| Non-Hispanic white | 2023 (11) | 209 (10) | 1809 (90) | 5 (0) | Ref | Ref |
| Non-Hispanic black | 6602 (36) | 839 (13) | 5719 (86) | 44 (1) | 1.26 (1.08, 1.48)* | 1.43 (1.20, 1.69)* |
| Hispanic | 6660 (36) | 994 (15) | 5641 (85) | 25 (0) | 1.52 (1.30, 1.78)* | 1.45 (1.22, 1.72)* |
| Asian | 2242 (12) | 464 (21) | 1767 (79) | 11 (0) | 2.27 (1.90, 2.70)* | 1.42 (1.16, 1.73)* |
| Other/Unknown | 954 (5) | 138 (15) | 813 (85) | 3 (0) | 1.47 (1.17, 1.85)* | 1.35 (1.06, 1.73)* |
| United States-bornd | 8689 (47) | 751 (9) | 7884 (91) | 54 (1) | .39 (.36, .43)* | .57 (.47, .69)* |
| Foreign-born | 9792 (53) | 1893 (19) | 7865 (80) | 34 (1) | Ref | Ref |
| Top 5 countries of birth | ||||||
| Dominican Republic | 2287 (23) | 386 (17) | 1896 (83) | 5 (0) | – | – |
| China | 665 (7) | 148 (22) | 515 (78) | 2 (0) | – | – |
| Haiti | 612 (6) | 136 (22) | 475 (78) | 1 (0) | – | – |
| Ecuador | 545 (6) | 115 (21) | 429 (79) | 1 (0) | – | – |
| Jamaica | 514 (5) | 54 (11) | 459 (89) | 1 (0) | – | – |
| Years in the United States | ||||||
| <2 | 6435 (66) | 1135 (18) | 5282 (83) | 18 (0) | Ref | – |
| 2–5 | 521 (5) | 126 (24) | 392 (75) | 3 (1) | 1.49 (1.21, 1.84)* | – |
| ≥5 | 2836 (29) | 632 (22) | 2191 (77) | 13 (1) | 1.34 (1.20, 1.49)* | – |
| Median (IQR) | 1 (0, 10) | 0 (0, 7) | 1 (0, 15) | <.0001 | – | |
| TB incidence in country of birthe | ||||||
| High (≥140 cases per 100 000) | 2612 (14) | 629 (24) | 1968 (75) | 15 (1) | 3.17 (2.83, 3.55)* | 3.10 (2.52, 3.81)* |
| Medium (30–139) | 5915 (32) | 1110 (19) | 4787 (81) | 18 (0) | 2.31 (2.10, 2.54)* | 1.96 (1.61, 2.40)* |
| Low (0–29) | 9913 (54) | 895 (9) | 8963 (90) | 55 (1) | Ref | Ref |
| HIV status | ||||||
| Uninfected | 3207 (17) | 789 (25) | 2408 (75) | 10 (0) | Ref | – |
| Infected | 17 (0) | 2 (12) | 14 (82) | 1 (6) | .41 (.09, 1.79) | – |
| Unknown | 15 257 (83) | 1853 (12) | 13 327 (87) | 77 (1) | .42 (.39, .47)* | – |
| TB risk factors | ||||||
| History of injection drug use | 354 (2) | 64 (18) | 286 (81) | 4 (1) | 1.33 (1.01, 1.75)* | 1.56 (1.17, 2.09)* |
| Spent time in high-risk settingf | 5741 (31) | 786 (14) | 4910 (85) | 45 (1) | .93 (.85, 1.02) | – |
| Homeless at testing | 2742 (15) | 414 (15) | 2315 (84) | 13 (1) | 1.06 (.95, 1.19) | – |
| Spent >1 month outside the United States | 1854 (10) | 295 (16) | 1552 (84) | 7 (0) | 1.15 (1.01, 1.31)* | 1.02 (.88, 1.17) |
| Ever smoked tobacco | 3826 (21) | 519 (13) | 3285 (86) | 22 (1) | .93 (.84, 1.03) | – |
Abbreviations: CI, confidence intervals; HIV, human immunodeficiency virus; IQR, interquartile range; OR, odds ratio; Ref, Reference; TB, tuberculosis.
a General clinic population patients were those who were neither a case nor a contact at the time of testing.
b Odds ratios compare patients with a positive test to those with a negative or indeterminate test.
c Adjusted odds ratios were calculated adjusting for all variables where an OR and 95% CI are reported.
d United States-born includes patients born in the United States, Puerto Rico, and other United States territories and outlying areas.
e Tuberculosis incidence categories are based on tertiles using World Health Organization national incidence estimates.
f High-risk settings include jails, prisons, homeless shelters, and drug treatment facilities.
* Indicates a significant result with P < .05.
Nine percent of US-born individuals were QFT-GIT positive compared with 19% of foreign-born individuals (Table 1). For the top 5 countries of birth for foreign-born patients tested, the proportion of positive results ranged from 11% for Jamaica-born to 22% for China- or Haiti-born. Twenty-four percent of foreign-born patients who were tested 2–5 years after arriving in the United States and 22% of patients tested more than 5 years after arriving had a positive test result compared with 18% of patients who were tested less than 2 years after arrival in the United States. The proportion of positive QFT-GIT results among foreign-born patients increased with increasing TB incidence in patients' country of birth. Eighty-three percent of general clinic population patients tested had unknown human immunodeficiency virus (HIV) status. The proportion of positive QFT-GIT results among HIV-uninfected patients (25%) was double that of HIV-infected patients (12%) and those with unknown HIV status (12%).
In an adjusted logistic regression model comparing general clinic population patients with a positive QFT-GIT test result to those with a negative/indeterminate result, the association with age remained (Table 1). The proportion with a positive result increased with increasing age; patients ≥65 years old were 4 times more likely to have a positive QFT-GIT result compared with those 19–44 years old (adjusted odds ratio [adjOR], 3.94; 95% confidence interval [CI], 3.12–4.72). Compared with non-Hispanic white patients, patients of all other races and ethnicities had higher adjusted odds of a positive result. Patients born in the United States were less likely to have a positive test result (adjOR, 0.57; 95% CI, 0.47–0.69), and the odds of having a positive QFT-GIT result increased with increasing incidence in patients' country of birth. Patients born in a high-incidence country were 3 times more likely to test positive compared with those born in a low-incidence country (adjOR, 3.10; 95% CI, 2.52, 3.81).
Among countries of birth with more than 100 individuals tested, the Philippines had the highest proportion (40%) of positive test results and was the country of birth with the highest average annual TB incidence (328 cases per 100 000 population) (Figure 3). Based on linear regression results, the percentage of positive test results among individuals from Mexico, Philippines, Russia, and Nepal was larger than expected given average estimated TB incidence in these countries. Conversely, a lower than expected proportion of positive test results was observed among individuals from Bangladesh, Yemen, and Ghana.
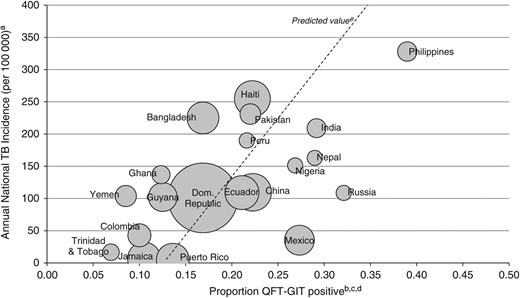
Average annual tuberculosis (TB) incidencea compared with QuantiFERON-Gold In-Tube (QFT-GIT) positive proportion in the general clinic populationb, by top 20 countries of birthc,d, New York City, November 2009–December 2011. (a) Tuberculosis incidence by country of birth was calculated using the average of World Health Organization national incidence estimates from 1990 to 2011. (b) General clinic population patients were those who were neither a case nor a contact at the time of testing. (c) Includes the 20 countries of birth with the largest number of individuals tested and more than 100 tests performed; the United States was excluded due to the large volume of tests performed, and Puerto Rico is displayed separately because it represents a large, distinct portion of the United States-born group. (d) The center of each circle corresponds to the annual TB incidence and proportion QFT-GIT positive for each country. The size of each circle represents the volume of tests conducted. (e) The dashed line represents predicted values based on a linear regression of annual national TB incidence on the proportion of positive QFT-GIT results by country of birth.
The registry match was conducted a median of 2.8 years after patients' most recent QFT-GIT test (range, 1.8–4.2 years). Three patients were identified from the match as having developed TB disease during this follow-up period. One case had a positive QFT-GIT during the study period but did not complete evaluation at that time. Two cases had negative QFT-GIT results during the study period; 1 had known subsequent exposure to TB and a positive test after the end of the study period. Additional testing results were not available for the other patient at the time of publishing.
DISCUSSION
As the number of TB cases continues to decline in the United States, efforts to eliminate TB will require interventions targeted towards persons with TB infection. Identifying the populations at greatest risk for infection and thus for developing future disease requires understanding the underlying epidemiology of TB infection. This study sought to characterize IGRA-based TB infection prevalence among a large clinical sample in NYC.
An earlier study of a similar NYC DOHMH clinic population that used TST as the test for infection found a prevalence of infection in the general clinic population of 24%, whereas we found a prevalence of 14% among those tested with QFT-GIT [4]. The difference in these proportions can largely be attributed to the reduction in the percentage testing positive among the foreign-born patients. We found the same positive proportion among the US-born individuals tested with QFT-GIT (9%) as was previously found with TST. However, among the foreign-born, there was a 53% reduction in the proportion testing positive with QFT-GIT compared with TST (19% vs 40%). Some differences in age distribution and sex were observed between the 2 study populations, with the study based on TST including more female patients and a larger proportion of patients in the 20–34 year age group compared with our study population (data not shown). The TST study was conducted from 2002 to 2004, when TB incidence rates in NYC were 52% higher compared with 2009 to 2011 [4, 12]. However, in both studies, foreign-born individuals comprised more than half of the study population and the countries of birth represented were similar. Incidence rates for the foreign-born in NYC only declined 27% from 2002 to 2011, and global declines in incidence have been even smaller [12, 17]. As such, population and temporal differences are unlikely to explain the majority of the observed decrease in the proportion of foreign-born individuals testing positive for TB infection.
A more likely explanation for the observed reduced prevalence of TB infection among foreign-born individuals is a decrease in the number of false-positive results for persons born in countries that routinely administer BCG vaccine [5]. Although there is some evidence in the literature of heterogeneous QFT specificity and waning effects of BCG vaccination, these findings appear to depend upon the background risk of TB infection and timing of BCG [18, 19]. The contribution of the increased specificity of QFT to the reduced prevalence of TB infection among the foreign-born group is supported by the stability of results among the US-born individuals who are not routinely BCG-vaccinated and thus not subject to BCG-related false-positive results.
Several studies have concluded that IGRAs are cost-effective compared with TST, particularly in settings with a large, high-risk foreign-born population [20–22]. In NYC TB clinics, the reduction in the proportion of the population testing positive likely resulted in resource savings. With fewer persons with positive results to manage, efforts can be focused on providing further evaluation to the much smaller population more likely to be truly infected. The superior performance of QFT-GIT in the NYC TB clinic patient population has resulted in QFT-GIT being adopted as the standard test for TB infection in the clinics and for contact investigations in large, congregate settings; plans to expand testing with QFT-GIT for all contact investigations are underway.
As of September 2013, 2 cases of TB disease were identified among the general clinic population who tested negative with QFT-GIT after a median of almost 3 years of follow-up. One patient had a known exposure to TB and a second, positive QFT-GIT test, both of which occurred after the end of the study period. No follow-up testing results were found for the other patient, but re-exposure is possible. Given that the highest risk of breaking down with active TB disease occurs within 2 years of exposure, these findings provide some measure of assurance that false-negative test results are unlikely and that TB infection is not being underdiagnosed among those at highest risk [23].
When stratifying by IGRA type, there was an increase in the proportion testing positive with QFT-GIT vs QFT-G, likely due to a change in testing policy within the NYC TB clinics rather than any substantive differences between the tests. A few months before the adoption of QFT-GIT, clinic policy was amended to provide testing only to those believed to be at greatest risk for TB. By narrowing the population tested to those that fall within high-risk categories, as was expected, the overall proportion testing positive rose, signaling a successful focus on those at increased risk. Further evaluation is needed to determine whether the observed increase in the proportion testing positive is truly due to policy changes that decreased testing of low-risk individuals, a changing population, or other factors.
Analyses to identify factors associated with a positive QFT-GIT result among the general patient population were consistent with known TB risk factors [24–26]. Elderly patients, the foreign-born, and those from high TB incidence countries were all more likely to have a positive test result. In unadjusted analyses, persons living in the United States for 2 or more years had a higher likelihood of testing positive than those who arrived within 2 years. This increased risk could be an indicator of local transmission in NYC. In addition, when comparing the positive proportion by place of birth with the average WHO incidence, several groups were found to have a higher than expected proportion of positive results, including those from Mexico, Philippines, Russia, and Nepal. Previous work has identified a higher proportion of genotype clustering, widely used as a proxy for recent transmission, among some of these same populations in NYC [27–29]. This result further suggests that TB infection among some subpopulations in NYC may be locally acquired as opposed to being solely imported from abroad. Additional studies are needed to investigate which groups contribute the most to local transmission to better target TB control interventions.
This study had limitations. The data used for this analysis were collected in the course of normal clinic operations rather than for research. Robust information on clinical comorbidities, such as diabetes and use of tumor necrosis factor-α inhibitors, was not consistently collected in the EMR and could not be used for analysis. The data also did not include complete information on the reason patients were tested. As a result, a match was conducted with the TB Registry to identify contacts and active TB cases. This process may have resulted in some misclassification of patients; however, the higher proportion of positive results among patients classified as cases (76%) and contacts (36%) compared with the general clinic population (14%) suggests that patients at increased risk for TB infection were successfully identified. Even so, patients attending a NYC TB clinic may not be representative of the NYC population as a whole. However, given the resources required to conduct a population-based prevalence study, these results provide a useful benchmark for identifying high-risk subpopulations and allowed direct comparison with the earlier study using TST. Misclassification may also have occurred among individuals with TB infection who had indeterminate test results; however, the very small proportion of indeterminate results suggests that any undercounting of the QFT-GIT-positive group would be minimal. The study was also limited by the large proportion of missing HIV results. Due to the fact that HIV status was unknown for the majority of patients, we could not include it in our logistic regression model. Electronic transmission of IGRA results was available at all clinics beginning in November 2010; manual entry of results may have resulted in data errors.
To our knowledge, this is the largest study of IGRA test results published to date. The study includes almost 70 000 IGRA tests conducted over 6 years in a large and diverse urban population. The large sample size enabled us to limit our analysis to general clinic population patients and estimate the background rate of TB infection in NYC and the long study period allowed for a median of almost 3 years of follow-up time for all patients. In addition, the completeness of TB surveillance data in NYC allowed for accurate follow-up and capture of patients later identified as cases of TB disease.
Use of IGRAs lowered the proportion of positive results among those tested compared with use of TST, likely decreasing the resources required for medical follow-up. Adoption of IGRAs also allowed for a more accurate evaluation of the prevalence of TB infection among a large, diverse population. Patient characteristics associated with a positive QFT-GIT result were consistent with established risk factors, suggesting that IGRAs are reliable. These data will allow physicians and TB controllers to better understand the background prevalence of TB in NYC and identify high-burden subpopulations for targeted testing and treatment.
Acknowledgments
We thank Errol Robinson, John Somma, and Syeda Iffat Naqvi for assistance in obtaining data from the New York City chest clinic electronic medical record system, and we acknowledge the efforts of all chest clinic staff who contributed to the data used in this work.
Financial support. This work was supported in part by an appointment to the Applied Epidemiology Fellowship Program administered by the Council of State and Territorial Epidemiologists and funded by the Centers for Disease Control and Prevention (Cooperative Agreement Number 5U38HM000414 [to N. L. S.]).
Potential conflicts of interest. All authors: No reported conflicts.
All authors have submitted the ICMJE Form for Disclosure of Potential Conflicts of Interest.


Comments