


Abstract
Many regions have experienced successive epidemic waves of coronavirus disease 2019 (COVID-19) since the emergence of severe acute respiratory syndrome coronavirus 2 (SARS-CoV-2), with heterogeneous differences in mortality. Elucidating factors differentially associated with mortality between epidemic waves may inform clinical and public health strategies.
We examined clinical and demographic data among patients admitted with COVID-19 during the first (March–August 2020) and second (August 2020–March 2021) epidemic waves at an academic medical center in New York City.
Hospitalized patients (n = 4631) had lower overall and 30-day in-hospital mortality, defined as death or discharge to hospice, during the second wave (14% and 11%) than the first (22% and 21%). The wave 2 in-hospital mortality decrease persisted after adjusting for several potential confounders. Adjusting for the volume of COVID-19 admissions, a measure of health system strain, accounted for the mortality difference between waves. Several demographic and clinical patient factors were associated with an increased risk of mortality independent of wave: SARS-CoV-2 cycle threshold, do-not-intubate status, oxygen requirement, and intensive care unit admission.
This work suggests that the increased in-hospital mortality rates observed during the first epidemic wave were partly due to strain on hospital resources. Preparations for future epidemics should prioritize evidence-based patient risks, treatment paradigms, and approaches to augment hospital capacity.
As of March 15, 2022, severe acute respiratory syndrome coronavirus 2 (SARS-CoV-2), which causes coronavirus disease 2019 (COVID-19), has led to >460 million confirmed infections and >6 million deaths worldwide [1]. New York City (NYC) experienced one of the earliest and largest local epidemics, with a peak of >16 000 daily hospitalizations and 700 daily deaths in April 2020 [2]. COVID-19 infections in New York City declined and remained relatively low from July through November 2020, averaging <60 hospitalizations per day and 15 deaths per day during this time period [2]. A second epidemic surge occurred from November 2020 through March 2021, resulting in a peak of nearly 400 daily hospitalizations and 90 daily deaths by February 2021 [2].
Data from the United States and Europe show significant heterogeneity in mortality rates between the first and subsequent waves of COVID-19 [3, 4]. While many regions have reported lower case fatality rates (CFRs) in the second epidemic wave compared with the first, some countries have demonstrated the reverse pattern [5–10]. Explanations for the frequently observed mortality reduction over time include the development and use of effective therapies, seasonal effects, viral variant effects, and age, race, ethnicity, and comorbidity differences, but these hypotheses have been underexplored [11]. In the United States, race and ethnicity have been strong correlates of COVID-19 mortality and may play a role in observed differences between epidemic waves [12]. Among regions with a trend toward increased mortality in the second wave, proposed explanations include increased pressure on the health care system and the emergence of viral variants [7]. Previous studies reporting CFRs between epidemic periods were not able to examine the impact of related demographic, health system, or environmental factors.
We investigated whether in-hospital mortality differed by epidemic wave and whether individual-level demographic (eg, age, race, and ethnicity) and clinical factors, as well as markers of health system burden, affected mortality among COVID-19 patients admitted to an academic medical center and an affiliated community hospital in New York City.
METHODS
Data Sources
The study was conducted at a large quaternary academic medical center and an affiliated community hospital in Northern Manhattan, New York. Patients age ≥18 years presenting between March 1, 2020, and March 31, 2021, with a positive or presumed positive SARS-CoV-2 reverse transcription polymerase chain reaction (RT-PCR) test within 2 days of hospital presentation were counted as COVID-19 cases. Data were gathered and analyses performed for the subset of these patients who were admitted to the hospital. A 2-day cutoff for a positive RT-PCR test was chosen to best reflect community-acquired cases of COVID-19 requiring hospital admission and to minimize inclusion of incidental and nosocomial cases. Data were extracted and cleaned from the medical center clinical data warehouse and electronic health record (EHR) as previously described [13–15]. Patient demographics, anthropometric measurements, SARS-CoV-2 RT-PCR cycle threshold (Ct) value, level of respiratory support, intensive care unit (ICU) admission status, historical and current medications, and discharge status were collected.
Patient Consent
Study approvals were obtained from the Columbia University Irving Medical Center Institutional Review Board (IRB), New York. The requirement for obtaining written informed consent was waived by the IRB.
Variables Assessed
We classified COVID-19 admissions in our cohort by 2 epidemic periods; the intervals during which cases increased, peaked, and decreased were called waves. Wave 1 was defined from March 1, 2020, to August 23, 2020, and Wave 2 from August 24, 2020, to March 31, 2021. The breakpoint between waves was defined by the nadir of admissions on August 24, 2020. Sex, age, race, and ethnicity were self-reported. Body mass index (BMI) was categorized using a ≥30-kg/m2 cut-point for obese individuals, and <30 kg/m2 was considered normal. Viral load assessments based on Ct values were reported for the cobas (Roche Molecular Systems, Inc., Branchburg, NJ, USA) and Xpert Xpress assays (Cepheid, Inc., Sunnyvale, CA, USA), but not for the BioFire Respiratory Panel assay (BioFire Diagnostics, Salt Lake City, UT, USA). The ORF1ab gene was targeted for the cobas assay, and the N2 gene was targeted for the Xpert Xpress assays. Quantitative Ct values were converted to high, medium, and low viral load categories based on tertiles. For the cobas and Xpert Xpress assays, high, medium, and low viral load were defined by Ct values <25, 25–30, and >30 (cobas) and <27, 27–32, and >32 (Xpert Xpress), respectively. Choice of viral load assay varied by laboratory needs, resources, and timing. The level of respiratory support at hospital presentation was recorded as room air, nasal cannula, nonrebreather, noninvasive ventilation, or intubation. We also recorded whether patients or their decision-makers elected for do-not-intubate (DNI) status. Patients admitted to an ICU within 24 hours of hospital admission were considered admitted to an ICU at presentation. Steroid usage was defined by documented receipt of intravenous or oral formulations of prednisone, dexamethasone, or methylprednisolone. Underlying coronary artery disease (CAD), chronic kidney disease (CKD), diabetes mellitus (DM), or hypertension (HTN) was defined by current or historical International Classification of Diseases, 10th Revision (ICD-10), codes (Supplementary Table 1). We calculated the age-adjusted Charlson comorbidity index (CCI) score using the EHR [16]. Hospital Frailty Risk Score (HFRS) was calculated among patients age ≥75 years [17]. If corresponding ICD-10 codes were not found in the medical record, then the comorbidity was assumed to be absent. Each variable was assessed for degree of missingness. The weekly number of COVID-19 admissions was recorded as a proxy for hospital COVID-19 burden. The primary outcome was death or discharge to hospice.
Statistical Analyses
Histogram plots were used to visualize the distribution of cases and admissions. Descriptive statistics were reported, including counts with percentages, medians, and interquartile ranges (IQRs). The Wilcoxon rank-sum test was used to compare groups for continuous variables, and Pearson’s chi-square test was used for categorical variables. Wave was defined as a binary variable. In-hospital mortality was examined using Kaplan-Meier survival analysis and Cox proportional hazards models. Survival time was calculated as days from hospital admission to death or discharge to hospice for events and from admission to discharge alive for the rest. Those who did not die were considered alive until March 31, 2021. In Cox proportional hazards analyses, survival times were right censored on day 30 after admission. Proportional hazards assumptions were graphically examined. Final models focused on 30-day survival and investigated potential covariables in conjunction with the epidemic wave. Models were also run separately for those age ≥75 years. Model fit was assessed by examining the log-likelihood ratio (LLR) between unadjusted and adjusted models. All statistical analyses were conducted using R Studio (Boston, MA, USA).
RESULTS
Hospitalized patients with COVID-19 (n = 4631) were grouped by date of admission into wave 1 (March 1, 2020, to August 23, 2020; n = 2952) or wave 2 (August 24, 2020, to March 31, 2021; n = 1679), with the breakpoint defined by the nadir of admissions.
The volume of SARS-CoV-2 cases and admissions (Figure 1A) vastly differed between waves 1 and 2. The median length of hospitalization among patients who died or were discharged to hospice (Figure 1B) was shorter in wave 1 than wave 2. The distribution of length of hospital stay among patients who were discharged alive did not differ by epidemic wave (Figure 1B). A similar pattern was seen in length of stay among patients age ≥75 years (Figure 1C). The monthly in-hospital mortality rate (per 100 inpatients) peaked in wave 1 at 27% and rose to 16% during wave 2 (Supplementary Figure 1).
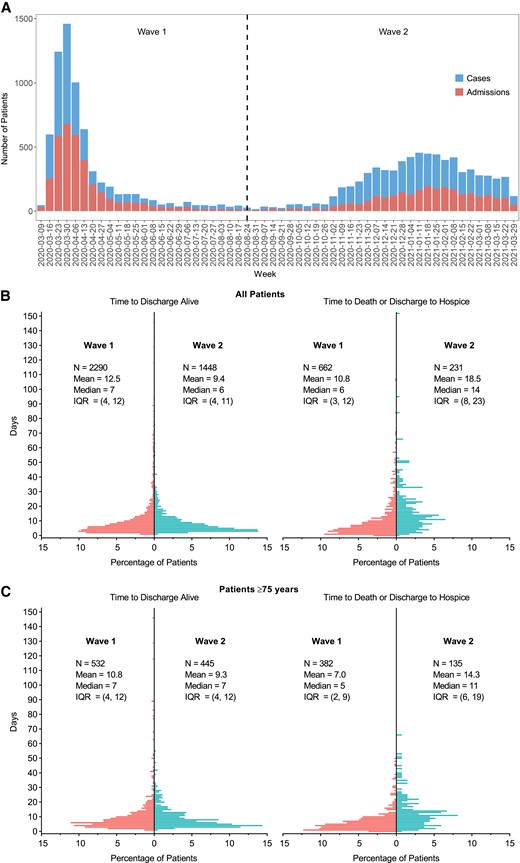
A, Distribution of SARS-CoV-2 cases (upper bars) and admissions (lower bars) seen at the medical center during the study period. B, Time to discharge alive (left panel) or time to death or discharge to hospice (right panel) among all patients in wave 1 (left bars) and wave 2 (right bars). C, Same analysis as (B) for patients age ≥75 years. Abbreviations: IQR, interquartile range; SARS-CoV-2, severe acute respiratory syndrome coronavirus 2.
Table 1 shows patient characteristics by epidemic period and P values for each variable comparing wave 1 with wave 2. Wave 2 patients had a significantly lower rate of death or discharge to hospice (14%) compared with those in wave 1 (22%). Age, BMI, history of comorbidities, Charlson comorbidity index, and Hospital Frailty Risk Score did not differ by wave. Patients during wave 2 were less likely to identify as male (51% vs 56%), to identify as non-Hispanic Black (10% vs 14%), to have DNI status (23% vs 32%), and to be admitted to the ICU at presentation (7% vs 11%). Wave 2 patients were more likely to have a low Ct value (high viral load). However, only 29% of patients in wave 2 had recorded Ct values, compared with 96% during wave 1, due to the use of different assays. Patients during wave 2 were less likely to require supplemental oxygen (55% vs 64%), a nonrebreather mask (5% vs 21%), and invasive mechanical ventilation (4% vs 6%) at presentation. Patients in wave 2 were also more likely to receive supplemental oxygen via nasal cannula (46% vs 36%) and noninvasive ventilation (2% vs 1%). Steroid use and remdesivir use in wave 2 were significantly higher than in wave 1, while hydroxychloroquine use was significantly lower in wave 2 than in wave 1. Weekly COVID-19 admissions divided by 50 were significantly lower in wave 2 compared with wave 1.
Demographic and Clinical Characteristics of Patients Hospitalized With COVID-19 in the First and Second Waves
| Total | Wave 1b | Wave 2b | |||
|---|---|---|---|---|---|
| … | No.a | (n = 4631) | (n = 2952) | (n = 1679) | P Valuec |
| Discharge status, No. (%) | 4631 | … | … | … | <.001 |
| Alive | … | 3738 (81) | 2290 (78) | 1448 (86) | … |
| Death/hospice | … | 893 (19) | 662 (22) | 231 (14) | … |
| Status at 30 d, No. (%) | 4631 | … | … | … | <.001 |
| Alive or discharged | … | 3835 (83) | 2346 (79) | 1489 (89) | … |
| Death/hospice | … | 796 (17) | 606 (21) | 190 (11) | … |
| Age, mean (SD), y | 4631 | 65 (17) | 65 (17) | 66 (18) | .2 |
| Age, No. (%) | 4631 | … | … | … | .030 |
| 18–50 y | … | 869 (19) | 546 (18) | 323 (19) | … |
| 50–65 y | … | 1208 (26) | 801 (27) | 407 (24) | … |
| 65–75 y | … | 1060 (23) | 691 (23) | 369 (22) | … |
| 75+ y | … | 1494 (32) | 914 (31) | 580 (35) | … |
| Sex, No. (%) | 4631 | … | … | … | <.001 |
| Female | … | 2101 (45) | 1285 (44) | 816 (49) | … |
| Male | … | 2530 (55) | 1667 (56) | 863 (51) | … |
| Race/ethnicity, No. (%) | 4631 | … | … | … | <.001 |
| Hispanic/Latino | … | 2398 (52) | 1534 (52) | 864 (51) | … |
| Non-Hispanic Black | … | 586 (13) | 415 (14) | 171 (10) | … |
| Non-Hispanic White | … | 536 (12) | 321 (11) | 215 (13) | … |
| Other | … | 1111 (24) | 682 (23) | 429 (26) | … |
| BMI, No. (%) | 4301 | … | … | … | .4 |
| <30 kg/m2 | … | 2766 (64) | 1742 (65) | 1024 (64) | … |
| ≥30 kg/m2 | … | 1535 (36) | 947 (35) | 588 (36) | … |
| Ct value, median (IQR) | 3324 | 28 (23–33) | 29 (23–33) | 27 (21–33) | <.001 |
| Viral load categories,d No. (%) | 3319 | … | … | … | <.001 |
| Low (Ct >32 or 30) | … | 1400 (42) | 1228 (43) | 172 (35) | … |
| Medium (Ct 27–32 or 25–30) | … | 778 (23) | 672 (24) | 106 (22) | … |
| High (Ct <27 or 25) | … | 1141 (34) | 933 (33) | 208 (43) | … |
| Ever DNI, No. (%) | 4631 | … | … | … | <.001 |
| Yes | … | 1344 (29) | 956 (32) | 388 (23) | … |
| No | … | 3287 (71) | 1996 (68) | 1291 (77) | … |
| Oxygen level at presentation, No. (%) | 4631 | … | … | … | <.001 |
| Room air | … | 1816 (39) | 1074 (36) | 742 (44) | … |
| Nasal cannula | … | 1835 (40) | 1061 (36) | 774 (46) | … |
| Nonrebreather | … | 699 (15) | 623 (21) | 76 (4.5) | … |
| Noninvasive ventilation | … | 50 (1.1) | 22 (0.7) | 28 (1.7) | … |
| Intubation | … | 231 (5.0) | 172 (5.8) | 59 (3.5) | … |
| ICU admission by time, No. (%) | 4631 | … | … | … | <.001 |
| Non-ICU | … | 3769 (81) | 2355 (80) | 1414 (84) | … |
| ICU at presentation | … | 437 (9.4) | 320 (11) | 117 (7.0) | … |
| ICU after presentation | … | 425 (9.2) | 277 (9.4) | 148 (8.8) | … |
| Steroid use, No. (%) | 4540 | … | … | … | <.001 |
| Yes | … | 1913 (42) | 750 (26) | 1163 (70) | … |
| No | … | 2627 (58) | 2124 (74) | 503 (30) | … |
| Remdesivir use, No. (%) | 4631 | … | … | … | <.001 |
| Yes | … | 817 (18) | 101 (3) | 716 (43) | … |
| No | … | 3814 (82) | 2851 (97) | 963 (57) | … |
| Hydroxychloroquine use, No. (%) | 4631 | … | … | … | <.001 |
| Yes | … | 1317 (28) | 1310 (44) | 7 (0.4) | … |
| No | … | 3314 (72) | 1642 (56) | 1672 (99) | … |
| History of coronary artery disease, No. (%) | 4631 | 730 (16) | 452 (15) | 278 (17) | .3 |
| History of chronic kidney disease, No. (%) | 4631 | 798 (17) | 504 (17) | 294 (18) | .7 |
| History of diabetes, No. (%) | 4631 | 1824 (39) | 1190 (40) | 634 (38) | .088 |
| History of hypertension, No. (%) | 4631 | 2741 (59) | 1755 (59) | 986 (59) | .6 |
| Age-adjusted Charlson comorbidity score,e median (IQR) | 4582 | 4 (2–5) | 4 (2–5) | 4 (2–5) | .5 |
| Age-adjusted Charlson comorbidity index, No. (%) | 4582 | … | … | … | .2 |
| 0–1 | … | 931 (20) | 577 (20) | 354 (21) | … |
| 2–3 | … | 1318 (29) | 859 (29) | 459 (28) | … |
| 3–5 | … | 1358 (30) | 877 (30) | 481 (29) | … |
| 6+ | … | 975 (21) | 601 (21) | 374 (22) | … |
| Hospital Frailty Risk Score among age ≥75, mean (SD) | 1476 | 6.3 (5.9) | 6.4 (6.0) | 6.2 (5.7) | .8 |
| COVID admissions per week, mean (SD) | 4631 | 332 (238) | 448 (225) | 129 (48) | <.001 |
| COVID admissions per week divided by 50, mean (SD) | 4631 | 6.6 (4.8) | 9.0 (4.5) | 2.6 (1.0) | <.001 |
Abbreviations: BMI, body mass index; Ct, cycle threshold; DNI, do-not-intubate; ICU, intensive care unit; IQR, interquartile range.
Number of observations for each variable.
Epidemic waves were defined as: wave 1, Mar 1, 2020–Aug 23, 2020; wave 2, Aug 24, 2020–Mar 31, 2021.
P values compare wave 1 vs wave 2. Pearson’s chi-square test was used for categorical variables. Wilcoxon rank-sum test was used for continuous and binary variables.
For the cobas assay: high, medium, and low viral loads were defined by Ct <25, 25–30, and >30, respectively. For the Xpert Xpress assay: high, medium, and low viral loads were defined by Ct <27, 27–32, >32, respectively.
Charlson comorbidity score predicts 10-year survival in patients with multiple comorbidities.
Figure 2A and B show Kaplan-Meier plots comparing survival between wave 1 and wave 2 (log-rank test, P < .0001). For wave 1, the cumulative survival probabilities declined from 0.87 on day 7 to 0.79 by day 30 after admission, worse than in wave 2, where these probabilities were 0.97 at day 7 and 0.88 by day 30 (Figure 2C). Survival probabilities were lower among patients age ≥75 years across both waves, but the pattern of improved survival in wave 2 persisted (Figure 2).
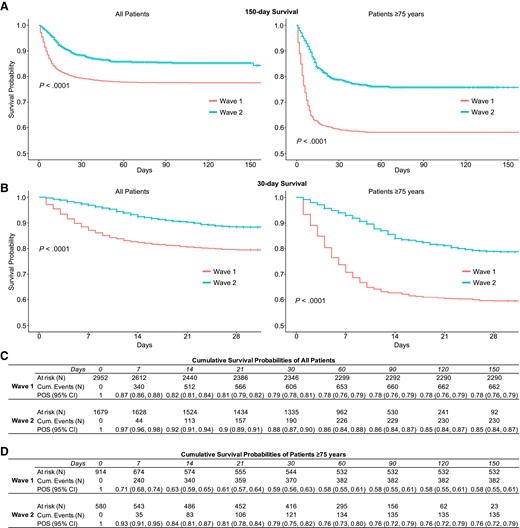
A, Kaplan-Meier survival plots of all patients (left panel) and patients age ≥75 years (right panel) hospitalized in the first and second waves of COVID-19 in New York City censored on March 31, 2021. B, Kaplan-Meier survival plots of all patients (left panel) and patients age ≥75 years (right panel) censored at 30 days. C, Cumulative survival probabilities for all patients. D, Cumulative survival probabilities for patients age ≥75 years. Abbreviations: COVID-19, coronavirus disease 2019; POS, probability of survival.
Unadjusted Cox regression for 30-day survival showed a 0.51-fold (95% CI, 0.43–0.60) reduction in risk of death in wave 2 compared with wave 1 (Table 2). The lower risk of death associated with wave 2 persisted after adjusting for potential demographic confounders. For example, after adjusting for age, sex, and race individually, wave 2 was associated with 0.45-fold (95% CI, 0.38–0.53), 0.51-fold (95% CI, 0.43–0.60), and 0.50-fold (95% CI, 0.43–0.50) lower in-hospital mortality, respectively, than wave 1. Oxygen level at presentation, a marker of the severity of disease, attenuated the association between wave and mortality, although hazard ratios remained <1 and statistically significant. After adjusting for the volume of weekly COVID-19 admissions, a marker of health service strain, wave 2 was no longer associated with lower mortality (hazard ratio, 0.91; 95% CI, 0.73–1.14). Potentially confounding variables were identified as those associated with both wave and mortality. A complete model adjusting for these variables, including age, race/ethnicity, Ct value, DNI status, supplementary oxygen requirement at presentation, steroid use, and weekly COVID-19 admission volume, accounted for the mortality difference between epidemic periods (Table 2).
Unadjusted and Adjusted Cox Proportional Hazards Models of the Association Between Epidemic Wave and Death by 30 Days After Admission, Adjusted for Potentially Confounding Factors, Among All Patients
| … | Unadjusted | HRadj (95% CI) | HRadj (95% CI) | HRadj (95% CI) |
|---|---|---|---|---|
| HR (95% CI) | Epidemic Period Adjusted for Each Covariate | Epidemic Period Adjusted for Each Covariate and Admission Volume | Epidemic Period and All Potentially Confounding Variablesa | |
| Epidemic period | … | … | … | … |
| Wave 1 | Ref | Ref | Ref | Ref |
| Wave 2 | 0.51 (0.43–0.60)b | 0.51 (0.43–0.60) | 0.51 (0.43–0.60) | 1.22 (0.84–1.76)b |
| Age | … | 0.45 (0.38–0.53) | 0.79 (0.63–0.98) | … |
| 18–50 y | Ref | Ref | ||
| 50–65 y | 3.34 (2.13–5.25) | 1.76 (1.08–2.86) | ||
| 65–75 y | 6.79 (4.40–10.5) | 2.31 (1.44–3.70) | ||
| 75+ y | 15.2 (10.0–23.1) | 2.93 (1.84–4.66) | ||
| Sex | … | 0.51 (0.43–0.60) | 0.91 (0.73–1.14) | NA |
| Female | Ref | |||
| Male | 1.00 (0.87–1.15) | |||
| Race/ethnicity | … | 0.50 (0.43–0.50) | 0.90 (0.72–1.13) | |
| Hispanic/Latino | Ref | |||
| Non-Hispanic Black | 1.03 (0.83–1.28) | |||
| Non-Hispanic White | 1.29 (1.05–1.60) | |||
| Other | 1.04 (0.87–1.23) | |||
| BMI | … | 0.56 (0.47–0.66) | 1.02 (0.80–1.29) | NA |
| <30 kg/m2 | Ref | |||
| ≥30 kg/m2 | 0.87 (0.75–1.02) | |||
| Ct value | 0.97 (0.97–0.98) | 0.38 (0.28–0.51) | 0.72 (0.51–1.03) | … |
| Viral load categories | … | 0.35 (0.26–0.48) | 0.62 (0.43–0.88) | NA |
| Low (Ct >32 or 30) | Ref | |||
| Medium (Ct 27–32 or 25–30) | 2.00 (1.61–2.47) | |||
| High (Ct <27 or 25) | 2.41 (1.99–2.91) | |||
| Ever DNI | … | 0.60 (0.51–0.70) | 0.93 (0.74–1.17) | |
| Yes | 14.0 (11.7–16.7) | |||
| No | Ref | |||
| Oxygen level at presentation | … | 0.72 (0.61–0.86) | 1.05 (0.83–1.32) | |
| Room air | Ref | |||
| Nasal cannula | 2.41 (1.93–3.01) | |||
| Nonrebreather | 9.80 (7.88–12.2) | |||
| Noninvasive ventilation | 8.23 (5.11–13.3) | |||
| Intubation | 8.64 (6.57–11.4) | |||
| ICU admission by time | … | 0.54 (0.46–0.64) | 0.93 (0.74–1.16) | NA |
| Non-ICU | Ref | |||
| ICU at presentation | 3.70 (3.10–4.41) | |||
| ICU after presentation | 3.41 (2.86–4.07) | |||
| Steroid use | … | 0.42 (0.35–0.50) | 0.76 (0.60–0.96) | |
| No | Ref | |||
| Yes | 1.19 (1.03–1.37) | |||
| Remdesivir use | … | 0.43 (0.36–0.53) | 0.76 (0.60–0.97) | NA |
| No | Ref | |||
| Yes | 0.86 (0.72–1.04) | |||
| Hydroxychloroquine use | … | 0.52 (0.44–0.63) | 0.87 (0.70–1.10) | NA |
| No | Ref | |||
| Yes | 1.43 (1.24–1.66) | |||
| COVID admissions per week divided by 50 | 1.09 (1.08–1.11) | 0.91 (0.73–1.14) | … | … |
Abbreviations: BMI, body mass index; Ct, cycle threshold; DNI, do-not-intubate; HR, hazard ratio; ICU, intensive care unit; LLR, log-likelihood ratio.
Fully adjusted model included the following variables associated with epidemic wave and mortality: age, race/ethnicity, Ct value, DNI status, oxygen level at presentation, steroid use, and COVID admissions per week divided by 50. Variables listed as NA were not included in the fully adjusted model because they did not fit the criteria as potentially confounding variables in our data set. Although hydroxychloroquine was associated with wave and mortality, it was excluded because only 0.7% of wave 2 patients received it.
Model fit was assessed by examining the log-likelihood ratio between the unadjusted model with epidemic wave alone (LLRunadj), with the fully adjusted model containing all potentially confounding variables (LLRadj). (LLRunadj = 74.06)–(LLRadj = 1183).
Supplementary Table 2 shows unadjusted and adjusted Cox models of the association between covariates and death or discharge to hospice within 30 days. These models illustrate that increasing age, identifying as non-Hispanic White, lower Ct values, DNI status, supplementary oxygen requirement at presentation, ICU admission, and the volume of COVID-19 admissions were each associated with higher in-hospital mortality after adjusting for wave. Among patients ≥75 years of age, wave 2 had a 0.42-fold (95% CI, 0.34–0.52) reduced risk of death compared with wave 1 (Supplementary Table 3), and the covariate associations with in-hospital mortality were similar to those seen in the overall sample (Supplementary Table 4).
We expected steroid and remdesivir use to be associated with reduced in-hospital mortality but recognize that confounding by indication may produce results showing the opposite. Therefore, we conducted stratified analyses by wave and ICU status (Supplementary Table 5). These analyses suggested that steroid and remdesivir effects were modified by wave, that is, lowered mortality risk in wave 1, ICU patients, and no benefit or slightly increased mortality risk in wave 2. Particularly in wave 1, there was a strong suggestion of confounding by indication for steroids.
DISCUSSION
Our analysis of 4631 patients admitted with SARS-CoV-2 during the first 2 epidemic waves in NYC revealed a decrease in risk of death or discharge to hospice in wave 2 compared with wave 1. The association between wave and in-hospital mortality persisted after covariate adjustment for several factors including age, sex, race, and markers of disease severity. However, the association between wave and mortality disappeared after adjusting for the volume of COVID-19 admissions, suggesting that strain on hospital resources may have been one of the factors accounting for the high in-hospital mortality rate in epidemic wave 1. Although the duration of hospital stay did not differ among patients who were discharged alive, the median time to death in the second wave was 1 week longer than in wave 1.
There were several other variables correlated with decreased in-hospital mortality. Patients presenting in the second wave were less likely to require oxygen or to be admitted to an ICU at presentation. Among those who did require oxygen, patients in the second wave were more likely to require a nasal cannula than to require higher levels of oxygen support, suggesting that their disease was less severe at the time of presentation. Due to the higher patient volume in wave 1, individuals may have been more reluctant to present to the hospital until they developed a greater degree of respiratory distress, resulting in a higher chance of intubation on arrival. Alternatively, admission criteria may have led to a cohort of patients in wave 1 with higher disease severity due to limited bed availability for those with less severe illness. We did not observe differences between waves in individual comorbidities, Charlson comorbidity index scores, or frailty (among patients age ≥75 years).
Interventions may account for mortality differences between the 2 waves. Noninvasive ventilation was less common in wave 1 due to concerns about aerosolizing the virus, as well as the theory that early intubation would lead to less risk of lung injury [18, 19]. This approach was later shown to lack benefit, leading to increased use of noninvasive ventilation during wave 2 [18–20]. We observed effect modification by epidemic wave and a paradoxical effect of COVID-19 therapies on in-hospital mortality in wave 2. Early in the pandemic, corticosteroid use was not routine in many centers, in part due to a lack of supportive data in ARDS due to influenza [21]. By wave 2, corticosteroid use was widespread based on data showing reduced mortality [22]. We observed higher steroid use among patients in wave 2, which likely contributed to decreased in-hospital mortality and associated with mortality due to the residual confounding effect of use by disease severity that we could not measure or control for in this analysis. Remdesivir became widely used in wave 2, but was shown to shorten time to recovery rather than reduce mortality [23, 24]. We used ICU status as a proxy for disease severity, and it partially explained the association between steroid and remdesivir use and increased the in-hospital mortality observed in wave 2. It is likely that other changes in the clinical management of COVID-19 and available therapies, including monoclonal antibodies, early proning, and rapid implementation of evidence-based guidelines, similarly contributed to reduced mortality [25–28].
Increasing vaccination prevalence during wave 2 in NYC may have contributed to decreases in COVID-19 admissions [29–32]. It is possible that preexisting immunity had a differential impact on infections and severe illness during wave 2. Baseline patient characteristics including age, sex, race/ethnicity, BMI, and the presence of several comorbidities were similar between the 2 epidemic waves, suggesting that the availability of vaccines did not alter the overall demographics of patients admitted with COVID-19 through March 31, 2021. We suspect that vaccination had a limited impact on mortality in wave 2 as vaccine uptake in the population at risk by March 31, 2021, was highly limited.
During wave 1 in NYC, many hospitals were overwhelmed with the rapid influx of patients combined with staff and equipment shortages. Studies have shown that COVID-19 mortality is inversely correlated with available hospital beds and health care workers [33]. In our analysis, we see a significant association between in-hospital COVID-19 mortality and the rate of COVID-19 admissions. This relationship may be explained by the strain placed on hospital resources with increasing COVID-19 cases. We note that wave 2 in NYC reached a lower peak number of cases with a more even distribution of admissions over the same period [2]. In our analysis, over twice as many patients were admitted with COVID-19 during the 4-month first wave compared with the 4-month second wave period. This result is in line with studies associating efforts that flatten the curve of COVID-19 cases with reduced case fatality [34]. Our estimates of hospital capacity are based on COVID-19 admissions due to difficulties accurately estimating total hospital admissions and ICU capacity from our database. Patients admitted with COVID-19, however, utilize specific hospital resources that would be expected to impact the care of other COVID-19 patients, including oxygen, ventilators, and ICU beds and staff.
Lastly, differences in mortality by wave may be affected by evolution of SARS-CoV-2 and the prevalence of different viral genotypes. Wave 2 in NYC was primarily driven by multiple variants of the ancestral SARS-CoV-2 lineage [35]. Multiple subtypes of the Iota (B.1.526) lineage were characterized in NYC during the second wave, with a high prevalence of the E484K mutation, which is associated with resistance to therapeutic monoclonal antibodies as well as convalescent and vaccinee sera [35]. The Iota lineage was subsequently outpaced by the Alpha (B.1.1.7) variant of concern in NYC, which several studies have associated with both increased transmissibility and mortality compared with the ancestral virus [36, 37]. Notably, a multivariate analysis by Cusinato et al. found an increased risk of death during the second wave at a large hospital in the United Kingdom to be temporally associated with the Alpha variant of concern [8].
Our study has several limitations. Cases of COVID-19 are likely to be undercounted from wave 1 due to limited testing capacity. Detection of incidental COVID-19 likely increased in wave 2 when routine testing was ubiquitous. Information bias in the EHR limited accurate characterization of comorbidities. RT-PCR Ct data were also missing in a differential way that could have biased viral load findings in either direction. Ct values had the highest degree of missingness (28%), while all other variables were <10% missing (Table 1). Missing Ct values were more prevalent in wave 2 than wave 1 (71% vs 4%) due to an institutional shift to qualitative rapid PCR testing. Missing Ct values were also more prevalent among patients discharged alive (30%) compared with those who died or were discharged to hospice (20%). We were not able to examine the use of monoclonal antibody therapies in our cohort because, during the time period of our study, these therapies were given only in the outpatient setting, so administration was not systematically recorded in our database. Our conclusions are limited to hospitalized patients and may not wholly reflect NYC-wide cases. Extrapolating to the general population can increase the likelihood of Berkson’s bias in identifying spurious correlations not present outside the hospital setting. We reduced selection bias in our sample and model specification by right-censoring patients after 30 days as the proportional odds assumption did not hold. Patients observed for >30 days were a small subset and were excluded from regression analyses.
In conclusion, we noted a distinct reduction in in-hospital COVID-19 mortality between the first and second epidemic waves in NYC associated with several covariates. The explanation for this reduction is multifactorial and likely includes standardization of COVID-19 management, availability and knowledge of effective therapies, knowledge of ineffective treatments and interventions, and reduced strain on critical health care resources. Public health interventions are also likely to be critical contributors to the observed mortality differences given changes in lockdown policies, mask guidance, social distancing behavior, availability and speed of SARS-CoV-2 testing, and availability of vaccines for high-risk groups. A focus on the specific variables associated with reduced and increased mortality in this analysis may help prepare for future epidemic waves by improving the accuracy of COVID-19 projections and informing public health policy decisions. Furthermore, plans to address future potential pandemics may benefit from prioritizing rapid, systematic methods of studying and developing treatment standards and plans to rapidly adjust hospital capacity and scale up necessary resources.
Supplementary Data
Supplementary materials are available at Open Forum Infectious Diseases online. Consisting of data provided by the authors to benefit the reader, the posted materials are not copyedited and are the sole responsibility of the authors, so questions or comments should be addressed to the corresponding author.
Acknowledgments
Financial support. This work was supported by the National Institute of Allergy and Infectious Diseases at the National Institutes of Health (UM1AI069470, K23AI150378, and T32 AI100852, Columbia Integrated Training Program in Infectious Disease Research) and supplement for COVID-19 (UM1AI069470: 3UM1AI069470-14S1).
References
Author notes
Anthony Bowen, Jason Zucker, Magdalena Sobieszczyk and Delivette Castor equal contribution.
Potential conflicts of interest. All authors: no reported conflicts. All authors have submitted the ICMJE Form for Disclosure of Potential Conflicts of Interest. Conflicts that the editors consider relevant to the content of the manuscript have been disclosed.


Comments