


Abstract
A suboptimal diet is a leading factor in the current burden of chronic diseases. In Australia, dietary factors contribute to one-fifth of the chronic disease burden. Understanding the dietary patterns of Australian adults and summarizing their effects on chronic conditions are imperative for improving interventions targeting dietary behaviors.
This systematic review aims to summarize the dietary patterns of Australian adults derived using a posteriori and hybrid analysis methods and their associations with adverse health outcomes.
Six databases were first searched in December 2020 and updated in August 2023.
Cardiometabolic health, cardiovascular mortality, cancer, pregnancy-related metabolic conditions (gestational diabetes mellitus [GDM] or hypertensive disorders during pregnancy [HDP]), mental health, and cognitive function were the main health outcomes.
Dietary patterns from each study were classified as either healthy or unhealthy. A narrative synthesis was used to describe the association of dietary patterns with adverse health outcomes in longitudinal studies. Fifty-nine observational studies (31 cross-sectional, 3 case-control, 22 longitudinal, and 3 combining both cross-sectional and longitudinal designs) were included, involving a total of 362 263 participants aged 18 years and older.
Higher adherence to a healthy dietary pattern (characterized by higher consumption of dark-yellow, green leafy, cruciferous vegetables and fruits, nuts, whole grains, tomatoes, fish, and low-fat dairy) is associated with improved cardiometabolic risk factors, reduced risk of GDM and HDP, better mental health, and improved pregnancy outcomes. On the other hand, an unhealthy dietary pattern (characterized by a higher intake of processed and red meat, takeaway foods, white bread, high-fat dairy, potatoes, discretionary fat, sweet snacks, soft drinks, fat spreads, jam, and Vegemite) is linked to increased cardiometabolic risks. Overall, while healthy dietary patterns are associated with a reduced risk of several physical and mental health outcomes, unhealthy dietary patterns are linked to an increased risk in Australian adults.
PROSPERO registration no. CRD42023452960.
INTRODUCTION
According to the 2024 Australian Institute of Health and Welfare brief, noncommunicable diseases, including coronary heart disease, cerebrovascular disease, dementia, and cancer, were the leading causes of disease burden in Australia.1 Almost half of Australians across all age groups (47%) were affected by 1 or more chronic conditions, while nearly 1 in 5 (19%) had 2 or more chronic conditions, a state commonly referred to as multimorbidity (multiple long-term conditions).2 In addition, mental health disorders, such as depression, were among the leading contributors to disease burden in Australia.3 According to the 2015 Burden of Diseases Study in Australia, poor dietary choices accounted for one-fifth of chronic diseases.4
Dietary behaviors are important risk factors for chronic conditions5 and mental health disorders.6 However, this insight has traditionally relied on the analysis of individual nutrients or specific food items.7 There has been a growing emphasis in the literature on exploring dietary consumption patterns to assess their overall impact on health outcomes.8,9 Dietary patterns may provide a more accurate representation of dietary risks associated with adverse health outcomes compared to approaches that focus on specific foods or nutrients. This is because they provide a complete picture of dietary behavior as well as the relative contribution of distinct food items within the dietary patterns.8,10
Based on existing scientific evidence, adopting healthy dietary patterns—characterized by increased consumption of fruits, vegetables, whole grains, and legumes—is linked to a lower risk of cardiovascular disease (CVD),11 diabetes,12 cancer,13 and overweight/obesity.14 Conversely, unhealthy dietary patterns characterized by a higher intake of red and processed meat, fast and processed foods, refined grains, and alcohol have been associated with a broad spectrum of adverse health outcomes.12,14,15 Recognizing these associations, the Australian Dietary Guidelines (ADG) advocate for the adoption of healthy dietary patterns.16
As our understanding of the complex interplay between diet and health outcomes continues to evolve in Australia,4 providing a comprehensive summary of the existing evidence on dietary patterns and health outcomes is crucial for designing interventions to mitigate the impact of unhealthy dietary behaviors and promote optimal health and well-being among the Australian population. However, systematically generated evidence that comprehensively summarizes the dietary patterns of Australian adults and their associations with chronic health conditions is lacking.
The aim of this systematic review was to characterize dietary patterns identified by a posteriori (data-driven) and hybrid (a combination of data-driven and theory-based/predefined indices) methods and explore their longitudinal associations with chronic health conditions in the Australian context. This review focuses on a posteriori and hybrid methods to reflect the food intake patterns of the Australian population, including all consumed food items in the data analysis. As the a priori (based on predefined indices) methods mainly depend on selected parts of the dietary components (eg, Healthy Eating Index)17 and do not examine the interaction of all food components,18 these were not the focus of the current review.
METHODS
Protocol Registration
The protocol for this systematic review was registered in the International Prospective Register of Systematic Reviews (PROSPERO) with a registration ID CRD42023452960 (registered on August 17, 2023). The Preferred Reporting Items for Systematic Reviews and Meta-Analyses (PRISMA) guidelines was used to structure the search, conduct the review, and report the findings.19
Inclusion and Exclusion Criteria
The inclusion and exclusion criteria were developed using the Population, Exposure, Comparator, and Outcome (PECO) criteria.20 No limitations were imposed on publication date and study designs, and the following exclusion criteria were applied: (1) non-original research (ie, reviews, editorials, non-research letters); (2) case reports or case series; (3) ecological studies; (4) studies without health outcome(s) as the endpoint; (5) studies published in a non-English language; and (6) studies involving non-adult populations (<18 years) (Table 1).
Population, Exposure, Comparator, and Outcome (PECO) Inclusion and Exclusion Criteria
| Criteria | Inclusion criteria | Exclusion criteria |
|---|---|---|
| Population | Adult population (≥18 y) and studies conducted in Australia | Less than 18 y of age; dietary data collected during pregnancy |
| Intervention/exposure | A posteriori or hybrid-derived dietary patterns | A priori dietary patterns or single food items and nutrients |
| Comparator | Higher adherence to specific dietary patterns will be compared with lower adherence | None |
| Outcome | Risk of developing chronic noncommunicable diseases or mortality among adult population with specific dietary patterns derived by a posteriori or hybrid methods | Other health outcomes |
Search Strategy
One of the authors (Y.A.M.) developed the search strategy with an expert librarian, L.M., with input from K.D. and K.M.L. A combination of keywords and Medical Subject Headings (MeSH) terms was used to search articles including dietary patterns, health outcomes, dietary pattern analysis, principal components analysis (PCA), cluster analysis (CA), partial least squares (PLS), and reduced rank regression (RRR). The articles were searched in 6 electronic databases (Scopus, Medline, CINAHL, EmCare, Web of Science, and Cochrane Library) first in December 2020 and updated on August 24, 2023. A detailed search strategy is provided in Table S1.
Data Extraction
All studies retrieved through the search strategy were imported into EndNote (Clarivate, Philadelphia, PA, USA), and duplicates were removed. Between December 2020 and April 2021, studies were screened by Y.A.M. and K.D. based on titles, abstracts, and full texts to identify those that met the inclusion criteria. All potentially eligible articles were read in full, and relevant studies were selected. Between August and November 2023, additional screening of newly identified articles was conducted by Z.A.A. and Y.A.M. Any disagreements during the initial screening and full-text review were resolved through discussion.
A data-extraction sheet was prepared in Excel (Microsoft Corporation, Redmond, WA, USA) and tested on a subsample of studies for necessary modifications before starting the extraction of all included studies for the final analysis. Data extracted from each relevant study included author identification, publication year, name of the study (if applicable), the state in which a study was conducted, study population (sex and age), study design, sample size, dietary intake assessment methods (number of food items/group, frequency of assessment, and reference period), identified dietary patterns (explained variance and food items), classification (categorization) of dietary pattern scores, analysis methods for dietary pattern derivation (including response variables for RRR and PLS), outcomes, effect (association) estimates and their confidence intervals, covariates used in models as confounders, and principal conclusions. In cases where studies reported different associations between dietary patterns and health outcomes, with varying degrees of adjustment, the effect estimates from models with the greatest number of covariates were extracted. Z.A.A. extracted the data and Y.A.M. cross-checked approximately 14% of the studies, which were selected at random.
Health Outcomes
The risk of developing chronic conditions or cause-specific and all-cause mortality among an adult population with specific dietary patterns derived using an a posteriori or a hybrid method was determined. The associations between dietary patterns and these conditions were described and summarized from longitudinal studies; however, all study designs were used to characterize dietary patterns.
Risk-of-Bias Assessment
The Newcastle-Ottawa Quality Assessment Scale (NOS)21 and its adapted version by Zou et al22 and Modesti et al23 were used to assess the methodological quality and risk of bias of included studies. This scale evaluates the quality of studies across 3 dimensions: selection of the study groups, comparability of the groups, and verification of either exposure or outcome of interest. An adapted version was used for cross-sectional studies as the original scale has a limitation, allowing a maximum of 10 stars.22,23 The adaptations included assessing the general representativeness of the entire sample rather than just the exposure and control groups separately and omitting the criterion “Demonstration that the outcome of interest was not present at the start of the study” as it was not applicable for cross-sectional designs.23 The quality of studies were rated as follows: high (8–10), medium (5–7), or low (0–4) for cross-sectional studies and as high (7–9), medium (4–6), or low (0–3) for cohort/case-control studies.22 Two authors (Z.A.A. and T.C.M.) independently evaluated the quality of the included studies. Any discrepancies between their assessments were resolved through mutual discussion, and no third party was involved, as all conflicts were resolved between the 2 authors.
Dietary Pattern Identification
Studies used a wide variety of nomenclatures and lacked standardization in reporting dietary patterns.24 To mitigate this challenge, the reported dietary patterns were categorized into 2 groups (healthy and unhealthy) for both characterizing dietary patterns and summarizing effect estimates for longitudinal studies. To classify a dietary pattern into either of these categories, the following approaches were used. First, if the authors gave defined names such as Mediterranean, healthy and prudent (healthy), and unhealthy and Western (unhealthy), the classification was maintained. Second, some authors assigned names based on specific food items and contents. In this case, the name and factor loadings of food items were evaluated to classify them either to healthy or unhealthy dietary patterns. For instance, fruit, vegetables, prudent, low-fat dairy, and Mediterranean-style patterns were defined as healthy, as they encompass substantial quantities of health-promoting foods like fruits, vegetables, fiber, and whole grains. Conversely, patterns characterized by high consumption of meat, saturated fat, sugar, alcohol, and processed foods were classified as unhealthy dietary patterns, given their significant inclusion of food items generally considered detrimental to health (Table S2). This classification was guided by the ADG,16 which emphasizes the importance of consuming adequate amounts of vegetables, fruits, grains, cereals, dairy, and lean meats, while limiting the intake of saturated fat, added salt, added sugar, and alcohol.16
Data Synthesis
A systematic narrative synthesis was used to describe the available studies separately for each health outcome to summarize and synthesize all findings. The following steps were applied to synthesize the data: (1) describing the characteristics of included studies and grouping findings by dietary patterns and health outcomes, and (2) summarizing the magnitude and direction of the association between dietary patterns and health outcomes. The studies were categorized into 5 themes based on the health outcomes they reported: (1) cardiometabolic health, cardiometabolic risk factors, or CVD mortality; (2) cancer incidence or mortality; (3) pregnancy-related metabolic conditions and birth outcomes; (4) mental health and cognitive status; and (5) other health outcomes (Table S3). The findings were then summarized and presented using figures, tables, and text.
An attempt was made to pool effect estimates using meta-analysis25,26 if the studies (1) were longitudinal and (2) assessed the same outcome categories as described above. However, 3 prospective studies that utilized relative risks (RRs) to measure the association between 11 dietary patterns and cardiometabolic risk factors were identified. One study examined multiple dietary patterns or/and health outcomes. Additionally, 2 studies on pregnancy-related metabolic conditions (gestational diabetes mellitus [GDM] or hypertensive disorder during pregnancy [HDP] outcomes) were found from the same dataset and authors. Similarly, 3 prospective studies utilized odds ratios (ORs) to measure the association with 8 dietary patterns and cardiometabolic risk factors. Pooling together these dietary patterns and health outcomes would violate independence assumptions of meta-analysis. Therefore, forest plots were used to display the association of each dietary pattern with health outcomes (cardiometabolic risk factors or CVD mortality, pregnancy-related metabolic conditions and birth outcomes, cancer, mental health, cognitive status, and other health outcomes) without pooling effect estimates.
The most adjusted effect estimates, comparing the highest quantile, quartile, or tertile with the lowest for both healthy and unhealthy dietary patterns, were summarized and plotted using R version 4.3.1 (R Foundation for Statistical Computing, Vienna, Austria).27 Since ORs and RRs have different interpretations, separate forest plots were used for each.
RESULTS
Search Results
A total of 2068 articles were identified and 943 remained after removing duplicates. In the title and abstract screening phase, 831 articles were excluded. After applying the inclusion and exclusion criteria, 59 articles published between 2001 and 2023, with a total of 362 263 participants, were included (Figure 1).28–86
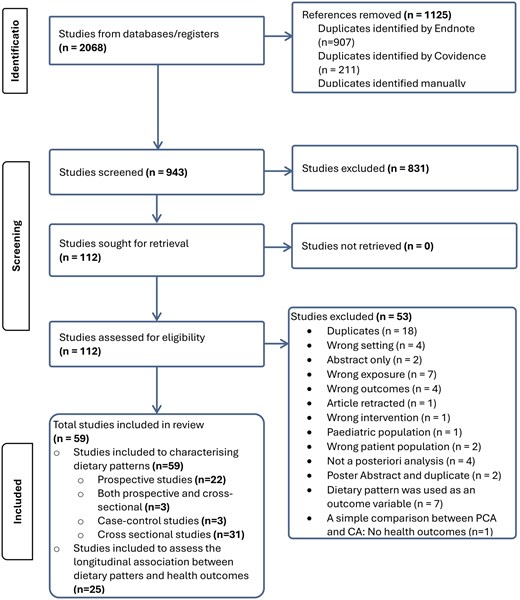
Preferred Reporting Items for Systematic Reviews and Meta-Analyses (PRISMA) Flow Diagram Showing Study Search and Inclusion for Systematic Reviews. Abbreviations: CA, cluster analysis; PCA, principal components analysis
Characteristics of the Included Studies
Three case-control,29,30,52 3 both cross-sectional and longitudinal,71,76,86 31 cross-sectional,28,32,35–39,42,44,49,50,54–68,70,72,78,84,85 and 22 longitudinal31,33,34,40,41,43,45,47,48,51,53,69,73–75,77,79–83 studies were included in the current review. While more than one-quarter (28.8%) of studies used national samples,28,32,34,35,37,45,52,54,55,58,59,66,67,71,73–75 15.3% were conducted in South Australia,38,42,49,50,64,65,69,76,83 15.3% in Victoria,31,43,44,46–48,60,62,63 and 6.78% in New South Wales36,39,68,72 (Table S4). The study sample sizes ranged from 73 to 156 035 with participant ages between 18 and 90 years. Two studies reported CVD mortality as an outcome,43,69 3 reported on cognitive status,34,39,50 1 study reported on GDM,74 1 reported on esophageal cancer,52 1 study reported on aging,48 4 reported on body mass index,33,60,79,83 2 reported on diabetes,47,75 and 4 studies reported on body mineral content.36,64,65,84
Risk of Bias
Of the 25 prospective studies included, only 4 (16%)69,73,76,86 were rated as medium quality, while the remaining 21 (84%) were considered high-quality studies (Table S5). All case-control studies29,30,52 were rated as high quality. Less than one-third (10 studies; 29.4%)28,32,36,44,55,66,67,71,72,76 of the 34 cross-sectional studies were rated as medium quality, while the remaining were rated as high quality.
Characteristics of Dietary Patterns
To evaluate dietary intake, 50 used food-frequency questionnaires (FFQs), 5 studies used 24-hour dietary recalls,28,35,58,59,62 2 used dietary history,32,63 and 2 studies used weighted food record methods.60,68 Most of these studies, except for 8,28,35,49,51,58,59,63,68 measured dietary exposure at a single time point. The range of food items covered by FFQs varied from 1272 to 212.42 The time frame of the dietary assessment instruments in the studies varied, evaluating dietary intake ranging from just the previous day35 to lifetime dietary exposure.50 Most of the studies measured the frequency of consuming specific food items per week and the quantity in grams per day (Table S2).
Two studies used PCA, RRR, and PLS65,76; 1 study used both factor analysis and CA56; 4 studies used RRR58–61; and the remaining studies used either factor analysis or PCA. The number of unique dietary patterns generated by the studies was 88, the most common being “Western” (n = 22) and “prudent” (n = 17) (Figure 2).
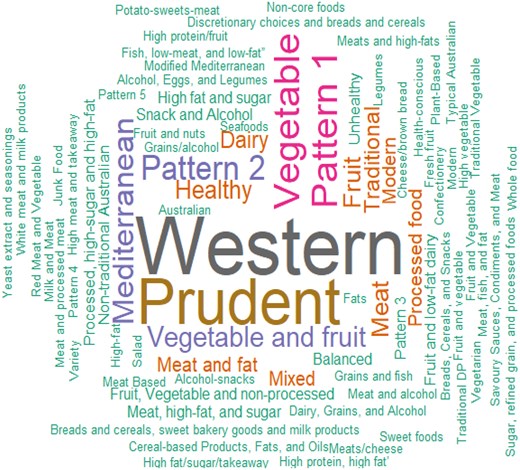
Names of Dietary Patterns Reported in the Original Studies. The font size of the words or phrases indicates the relative quantity of these dietary patterns in the included studies
Based on the characteristics of the food items, the reported dietary patterns were categorized into 2 dietary patterns: healthy and unhealthy (Table S2). Of the 192 total dietary patterns generated by the studies, 107 (55.7%) were classified as healthy. Dietary patterns identified by terms such as “healthy,” “fruits,” “vegetables,” “plant-based,” “prudent,” “vegetarian,” “dairy,” and “fruit” were classified as healthy dietary patterns. These healthy dietary patterns included high loadings for foods such as dark-yellow vegetables, green leafy vegetables, fruits, cruciferous vegetables, other vegetables, nuts, whole grains, tomatoes, fish, and low-fat dairy.
On the other hand, dietary patterns labeled as “unhealthy,” “Western,” “meat,” “alcohol,” “snacks,” “refined and processed,” “meat and fat,” “processed-high sugar,” and “high-fat” were considered unhealthy dietary patterns. These dietary patterns were characterized by high positive loadings for processed meat, high-fat potatoes, discretionary fat, takeaway foods, jam, Vegemite, beer, soft drinks, red meat, high-fat dairy, poultry with skin on, white bread, sweet snacks, and fat spreads, and very low factor loadings for fruits, vegetables, and fish (Table S2).
Longitudinal Association of Dietary Patterns and Health Outcomes
In the longitudinal studies, dietary patterns had different levels of associations with health outcomes. In this review, 25 longitudinal studies31,33,34,40,41,43,45,47,48,51,53,69,71,73–77,79–83,86 were included to determine the relationship between 95 dietary patterns and 90 health outcomes, as described in Figures 3 and 4 and Table 2.31,33,34,40,41,43,45–48,51,53,69,71,73–77,79–83,86
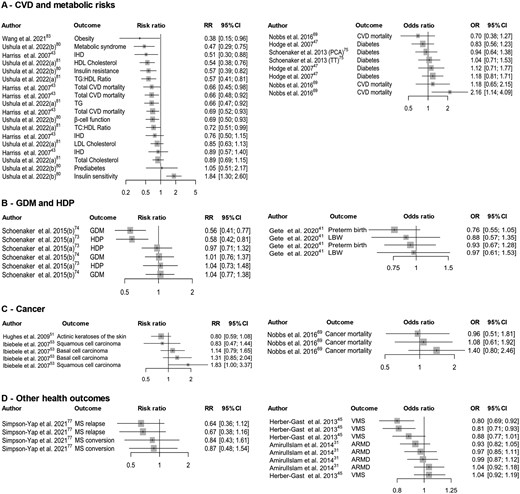
Summary of Association of Healthy Dietary Patterns With (A) Cardiometabolic Diseases and Risk Factors; (B) GDM and HDP; (C) Cancer; and (D) Other Health Outcomes. Studies reported in different estimands (RRs and ORs). Cardiometabolic diseases—estimates were from 3 studies with different dietary patterns or outcomes. Cardiometabolic risk factors—estimates were from 3 studies with different dietary patterns or outcomes. GDM and HDP—estimates were pooled from 2 studies with different dietary patterns or outcomes. Abbreviations: ARMD, age-related macular degeneration; CVD, cardiovascular disease; GDM, gestational diabetes mellitus; HDL, high-density lipoprotein; HDP, hypertensive disorder during pregnancy; IHD, ischemic heart disease; LBW, low birth weight; LDL, low-density lipoprotein; MS, multiple sclerosis; OR, odds ratio; PCA, principal components analysis; RR, risk ratio; TG, triglyceride; TT, treelet transform; VMS, vasomotor menopausal symptom
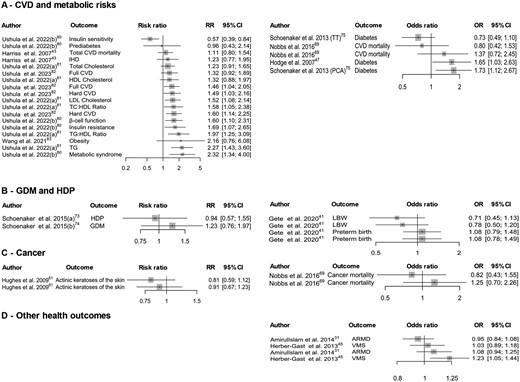
Summary of Association of Unhealthy Dietary Patterns With (A) Cardiometabolic Diseases and Risk Factors; (B) GDM and HDP; (C) Cancer; and (D) Other Health Outcomes. [Studies reported in different estimands (RRs and ORs). Cardiometabolic diseases—estimates were from 3 studies with different dietary patterns or outcomes. Cardiometabolic risk factors—estimates were from 3 studies with different dietary patterns or outcomes. GDM and HDP—estimates were pooled from 2 studies with different dietary patterns or outcomes. Abbreviations: ARMD, age-related macular degeneration; CVD, cardiovascular disease; GDM, gestational diabetes mellitus; HDL, high-density lipoprotein; HDP, hypertensive disorder during pregnancy; IHD, ischemic heart disease; LBW, low birth weight; LDL, low-density lipoprotein; MS, multiple sclerosis; PCA, principal components analysis; TG, triglyceride; TT, treelet transform; VMS, vasomotor menopausal symptom
Longitudinal Association of Dietary Patterns and Health Outcomes
| First author (year) | Study population | Sample size, n | Outcome | Name of dietary patterns (provided by the authors) | Labeled as | Association with health outcome | |
|---|---|---|---|---|---|---|---|
| Sex | Age at baseline, y | ||||||
| Arabshahi et al (2017)33 | Female | 25-75 | 683 | Weight change | Meat and fat | Unhealthy | + |
| Fruit and vegetable | Healthy | + | |||||
| Male | 25-75 | 504 | Meat and fat | Unhealthy | — | ||
| Fruit and vegetable pattern | Healthy | — | |||||
| Harriss et al (2007)43 | Both | 40–69 | 40 653 | Total CVD mortality | Factor 1 (Mediterranean foods) | Healthy | – |
| Factor 2 (vegetables) | Healthy | – | |||||
| Factor 3 (meat) | Unhealthy | — | |||||
| Factor 4 (fresh fruit) | Healthy | – | |||||
| IHD | Factor 1 (Mediterranean foods) | Healthy | – | ||||
| Factor 2 (vegetables) | Healthy | — | |||||
| Factor 3 (meat) | Unhealthy | — | |||||
| Factor 4 (fresh fruit) | Healthy | – | |||||
| Hodge et al (2007)47 | Both | 27-75 | 31 276 | Diabetes | Factor 1 | Healthy | — |
| Factor 2 | Healthy | – | |||||
| Factor 3 | Unhealthy | + | |||||
| Factor 4 | Healthy | — | |||||
| Nobbs et al (2016)69 | Both | >70 | 1034 | CVD incidence or mortality | Discretionary choices and breads and cereals | Unhealthy | — |
| Vegetable and fruit | Healthy | + | |||||
| White meat and milk products | Healthy | — | |||||
| Bread and cereals, sweet bakery goods, and milk products | Healthy | — | |||||
| Red meat and protein alternatives | Unhealthy | — | |||||
| Cancer incidence or mortality | Discretionary choices and breads and cereals | Unhealthy | — | ||||
| Vegetables and fruit | Healthy | — | |||||
| White meat and milk products | Healthy | — | |||||
| Breads and cereals, sweet bakery goods, and milk products | Healthy | — | |||||
| Red meat and protein alternatives | Unhealthy | — | |||||
| Schoenaker et al (2013)75 | Female | 45-50 | 7346 | Diabetes incidence (factor analysis) | Prudent | Healthy | — |
| Western | Unhealthy | + | |||||
| Diabetes incidence (Treelet transform) | Prudent | Healthy | — | ||||
| Western | Unhealthy | — | |||||
| Schoenaker et al (2015)73 | Female | 25-39 | 3582 | Hypertensive disorders of pregnancy | Meat, high-fat, and sugar | Unhealthy | — |
| Mediterranean-style | Healthy | – | |||||
| Fruit and low-fat dairy | Healthy | — | |||||
| Cooked vegetables | Healthy | — | |||||
| Ushula et al (2022)80 | Both | 30a | 877 | Metabolic syndrome | Western | Unhealthy | + |
| Insulin resistance | + | ||||||
| β-Cell function | + | ||||||
| Insulin sensitivity | – | ||||||
| Prediabetes | — | ||||||
| Metabolic syndrome | Prudent | Healthy | – | ||||
| Insulin resistance | – | ||||||
| β-Cell function | – | ||||||
| Insulin sensitivity | + | ||||||
| Prediabetes | — | ||||||
| Ushula et al (2022)81 | Both | 30a | 1078 | Total cholesterol | Western | Unhealthy | — |
| LDL | + | ||||||
| HDL | — | ||||||
| TG | + | ||||||
| TC:HDL ratio | + | ||||||
| TG:HDL ratio | + | ||||||
| Total cholesterol | Prudent | Healthy | — | ||||
| LDL | — | ||||||
| HDL | – | ||||||
| TG | – | ||||||
| TC:HDL ratio | – | ||||||
| TG:HDL ratio | – | ||||||
| Wang et al (2021)83 | Both | >18 | 787 | Obesity | Prudent | Healthy | – |
| Western | Unhealthy | — | |||||
| Ushula et al (2023)79 | Both | 21-30 | 2157 | Body-weight change | Western | Unhealthy | + |
| Prudent | Healthy | — | |||||
| BMI change | Western | Unhealthy | + | ||||
| Prudent | Healthy | — | |||||
| Ushula et al (2023)82 | Both | 30 | 875 | Hard CVD events | Pattern by RRR | Unhealthy | + |
| Full CVD events | Unhealthy | + | |||||
| Hard CVD events | Pattern by PLS | Unhealthy | + | ||||
| Full CVD events | Unhealthy | — | |||||
| Schoenaker et al (2015)74 | Female | 25-39 | 3853 | GDM | Meat, high-fat, and sugar | Unhealthy | — |
| Mediterranean-style | Healthy | – | |||||
| Fruit and low-fat dairy | Healthy | — | |||||
| Cooked vegetables | Healthy | — | |||||
| Ashby-Mitchell et al (2015)34 | Both | ≥60 | 577 | Cognitive status (impairment) | Variety | Healthy | — |
| Western | Unhealthy | — | |||||
| Dairy, grains, and alcohol | Unhealthy | — | |||||
| Gardener et al (2015)40 | Both | ≥60 | 527 | Global cognitive score | Prudent diet score | Healthy | — |
| Verbal memory | — | ||||||
| Visual memory | — | ||||||
| Executive function | — | ||||||
| Language | — | ||||||
| Attention | — | ||||||
| Visuospatial functioning | — | ||||||
| Global cognitive score | Western diet score | Unhealthy | — | ||||
| Verbal memory | — | ||||||
| Visual memory | — | ||||||
| Executive function | – | ||||||
| Language | — | ||||||
| Attention | — | ||||||
| Visuospatial functioning | — | ||||||
| Hodge et al (2013)46 | Both | 50-69 | 8660 | Psychological distress | Modified Mediterranean | Healthy | — |
| Australian dietary pattern | Healthy | – | |||||
| Rienks et al (2013)71 | Female | 18-75 | 7588 | Depressive symptoms | Cooked vegetables | Healthy | — |
| Fruit | Healthy | + | |||||
| Mediterranean-style | Healthy | – | |||||
| Meat and processed meat | Unhealthy | — | |||||
| Dairy | Healthy | — | |||||
| High-fat and -sugar | Unhealthy | — | |||||
| Shakya et al (2019)76 | Both | >18 | 859 | Depressive symptoms | Prudent (PCA) | Healthy | – |
| Western (PCA) | Unhealthy | + | |||||
| Prudent (RRR) | Healthy | — | |||||
| Western (RRR) | Unhealthy | — | |||||
| Modern (RRR) | Healthy | — | |||||
| Typical Australian dietary pattern (RRR) | Unhealthy | — | |||||
| Prudent (PLS) | Healthy | — | |||||
| Western (PLS) | Unhealthy | + | |||||
| Modern (PLS) | Healthy | — | |||||
| Typical Australian dietary pattern (PLS) | Unhealthy | – | |||||
| Amirul Islam et al (2014)31 | Both | 40-70 | 19 768 | Age-related macular degeneration | Fruit | Healthy | — |
| Vegetables | Healthy | — | |||||
| Grains and fish | Healthy | — | |||||
| Meat | Unhealthy | — | |||||
| Processed foods | Unhealthy | — | |||||
| Salad | Healthy | — | |||||
| Herber-Gast et al (2013)45 | Female | 45-50 | 6040 | Vasomotor menopausal symptoms | Cooked vegetables | Healthy | — |
| Fruit | Healthy | – | |||||
| Mediterranean-style | Healthy | – | |||||
| Meat | Unhealthy | — | |||||
| Dairy | Healthy | — | |||||
| High-fat and -sugar | Unhealthy | + | |||||
| Hodge et al (2014)48 | Both | >70 | 6308 | Successful aging | Factor 1 (vegetables) | Healthy | — |
| Factor 2 (fruit) | Healthy | + | |||||
| Factor 3 (Mediterranean) | Healthy | — | |||||
| Factor 4 (meat) | Unhealthy | – | |||||
| Hughes et al (2009)51 | Both | 44 ±11 | 1123 | Actinic keratoses of the skin | Vegetables-fruit | Healthy | – |
| Potato-sweets-meat | Unhealthy | — | |||||
| Alcohol-snacks | Unhealthy | — | |||||
| Ibiebele et al (2007)53 | Both | 25-75 | 1360 | Basal and squamous cell carcinoma of the skin | Vegetable and fruit | Healthy | — |
| Meat and fat | Healthy | — | |||||
| Vegetable and fruit | Healthy | — | |||||
| Meat and fat | Healthy | + | |||||
| Gete et al (2020)41 | Female | 25-30 | 3422 for preterm and 3508 for LBW | Preterm birth | Meats and high-fats | Unhealthy | — |
| Prudent | Healthy | — | |||||
| Sugar, refined grain, and processed foods | Unhealthy | — | |||||
| Traditional vegetables | Healthy | — | |||||
| Low birth weight | Meats and high-fats | Unhealthy | — | ||||
| Prudent | Healthy | — | |||||
| Sugar, refined grain, and processed foods | Unhealthy | — | |||||
| Traditional vegetables | Healthy | — | |||||
| Zheng et al (2021)86 | Both | 63.2a | 392 | Change in total WOMAC scores | High-fat | Unhealthy | — |
| Change in WOMAC Pain | — | ||||||
| WOMAC Function | — | ||||||
| WOMAC Stiffness | — | ||||||
| Change in total WOMAC scores | Healthy | Healthy | — | ||||
| Change in WOMAC Pain | — | ||||||
| WOMAC Function | — | ||||||
| WOMAC Stiffness | — | ||||||
| Change in total WOMAC scores | Mixed | Unhealthy | — | ||||
| Change in WOMAC Pain | — | ||||||
| WOMAC Function | — | ||||||
| WOMAC Stiffness | — | ||||||
| Cartilage volume | High-fat | Unhealthy | — | ||||
| Cartilage defects | — | ||||||
| Bone marrow lesions | — | ||||||
| Effusions-synovitis volume | — | ||||||
| Cartilage volume | Healthy | Healthy | — | ||||
| Cartilage defects | — | ||||||
| Bone marrow lesions | — | ||||||
| Effusions-synovitis volume | — | ||||||
| Cartilage volume | Mixed | Unhealthy | — | ||||
| Cartilage defects | — | ||||||
| Bone marrow lesions | — | ||||||
| Effusions-synovitis volume | — | ||||||
| Simpson-Yap et al (2021)77 | Both | 18-58 | 227 | MS conversion | Prudent | Healthy | — |
| High-vegetable | Healthy | — | |||||
| Mixed | Unhealthy | — | |||||
| MS relapse | Prudent | Healthy | – | ||||
| High-vegetable | Healthy | — | |||||
| Mixed | Unhealthy | — | |||||
Mean age.
Abbreviations: BMI, body mass index; CVD, cardiovascular disease; GDM, gestational diabetes mellitus; HDL, high-density-lipoprotein cholesterol; IHD, ischemic heart disease; LDL, low-density-lipoprotein cholesterol; LBW, low birth weight; MS, multiple sclerosis; PCA, principal components analysis; PLS, partial least squares; RRR, reduced rank regression; TG, triglyceride; WOMAC, Western Ontario and McMaster Universities Arthritis Index; +, positive association; -, inverse association; —, no association. Hard CVD events include coronary death, myocardial infarction and stroke. Full CVD events include Hard CVD plus coronary insufficiency and angina pectoris, transient ischaemic attack, intermittent claudication, and congestive heart failure.
Cardiometabolic Health and CVD Mortality
Ten studies explored cardiometabolic health (n = 45 079)33,47,75,79–83 and CVD mortality (n = 41 687).43,69 A longitudinal study from Victoria assessed CVD and ischemic heart disease (IHD) mortality using 4 dietary patterns: Mediterranean, vegetables, meat, and fresh fruit.43 The findings from this study showed that higher adherence to Mediterranean (risk ratio = 0.66; 95% CI: 0.45, 0.98), vegetable pattern (RR = 0.66; 95% CI: 0.48, 0.92), and fresh fruit dietary patterns (RR = 0.69; 95% CI: 0.52, 0.93) was associated with a 31%–34% reduced risk of mortality from CVD. However, only a Mediterranean dietary pattern was associated with a 49% reduced risk of mortality from IHD (RR = 0.51; 95% CI: 0.30, 0.88) (Table S6).
A nationwide study by Schoenaker et al75 showed that higher adherence to Western dietary patterns was associated with a 73% increased odds of diabetes incidence (OR = 1.73; 95% CI: 1.12, 2.67). Similarly, a study in Queensland80 showed that higher adherence to a Western dietary pattern was associated with an increased risk of metabolic syndrome (RR = 2.32; 95% CI: 1.34, 4.0), insulin resistance (RR = 1.69; 95% CI: 1.07, 2.65), impaired beta-cell function (RR = 1.60; 95% CI: 1.10, 2.31), and decreased insulin sensitivity (RR = 0.57; 95% CI: 0.39, 0.84). In contrast, higher adherence to prudent dietary patterns was associated with a decreased risk of metabolic syndrome (RR = 0.47; 95% CI: 0.29, 0.75), insulin resistance (RR = 0.57; 95% CI: 0.39, 0.82), and impaired beta-cell function (RR = 0.69; 95% CI: 0.50, 0.93) and increased insulin sensitivity (RR = 1.84; 95% CI: 1.30, 2.60).80
Three studies80,81,83 investigated the association between 11 healthy dietary patterns—namely, healthy, prudent, vegetables, and fruit—and cardiometabolic health risk factors. Except for prediabetes, all other associations remained uniform across studies, suggesting a decreased risk of cardiometabolic risk factors. The adjusted RRs ranged from 0.38 to 2.17 for the highest category of dietary pattern score compared with the lowest category (Figure 3).
Similarly, 11 unhealthy dietary patterns were examined for their association with cardiometabolic risk factors, yielding inconsistent results. The corresponding RRs ranged from 0.57 to 3.60. The estimates in Figure 4 suggested that unhealthy dietary patterns significantly increase the risk of cardiometabolic conditions.
Cancer
Two studies reported cancer outcomes (n = 2394).53,69 A study by Nobbs et al.69 in South Australia identified 5 dietary patterns: discretionary choices and breads and cereals; vegetables and fruit; white meat and milk products; breads and cereals, sweet bakery goods, and milk products; and red meat and protein alternatives. The findings showed that only a red meat and protein alternatives pattern was associated with increased risk of cancer incidence or mortality (lowest tertile vs. second tertile: OR = 1.46; 95% CI: 1.03, 2.07; and third tertile: OR = 1.28; 95% CI: 0.87, 1.90). Another study conducted in Queensland by Ibiebele et al.53 found that a meat and fat dietary pattern was associated with increased risk of basal and squamous cell carcinoma of the skin (RR = 1.83; 95% CI: 1.00, 3.37). Additionally, a study by Hughes et al.51 examined the link between precancerous lesions and dietary patterns. They identified 3 main dietary patterns: vegetable-fruit, potato-sweets-meat, and alcohol-snack. Only the vegetable-fruit dietary pattern showed a negative association with actinic keratoses of the skin (Figures 3 and 4).
Pregnancy-Related Metabolic Conditions (GDM and HDP) and Birth Outcomes
Only 2 studies were available on the association between dietary patterns and GDM and HDP.73,74 Findings from the Australian Longitudinal Study on Women’s Health (ALSWH) showed that a Mediterranean-style dietary pattern reduced the risk of both GDM (RR = 0.56; 95% CI: 0.41, 0.77) and HDP (RR = 0.58; 95% CI: 0.42, 0.81).73,74 On the other hand, “Western” dietary patterns had no association with HDP (RR = 0.94; 95% CI: 0.57; 1.55) or GDM (RR = 1.23; 95% CI: 0.76, 1.97). Similarly, a single study examined the association between dietary patterns and birth outcomes, and the findings showed that neither healthy nor unhealthy dietary patterns were associated with low birth weight or preterm birth41 (Figures 3 and 4).
Mental Health Conditions and Cognitive Function
Five studies reported on dietary patterns and either mental health conditions or cognitive function (n = 18 211) (Table 2).34,40,46,71,76 Healthy, fruit, traditional, prudent, and typical Australian dietary patterns were inversely associated with mental health and cognitive function,46,71,76 whereas unhealthy dietary patterns were positively associated with depression and cognitive function impairment.40,76 A longitudinal study by Ashby-Mitchell et al34 reported on 3 dietary patterns: variety, Western and dairy, grains, and alcohol patterns. These dietary patterns had no significant association with cognitive status. However, findings from a study conducted by Gardener et al40 showed that a Western dietary pattern was associated with greater cognitive decline after 36 months of follow-up.
Moreover, 2 studies71,76 investigated the correlation between dietary patterns and symptoms of depression. The findings from these studies indicate that adhering to healthy dietary patterns was linked to a reduced risk of depression symptoms.76 Conversely, in the other study,76 it was observed that adhering to Western dietary patterns was associated with an elevated risk of depression symptoms.
Other Health Outcomes
Seven studies considered other health outcomes related to dietary patterns (n = 37 280) (Figures 3 and 4 and Table 2).31,41,45,48,51,77,86 A study conducted in the Melbourne Collaborative Cohort Study (MCCS) identified 6 dietary patterns31: fruit, vegetables, grains and fish, meat, processed foods, and salad. None of the patterns were significantly associated with earlier stages of age-related macular degeneration.
A study conducted by Herber-Gast and Mishra,45 as part of the ALSWH, examined various dietary patterns and their association with vasomotor menopausal symptoms. The study identified 6 dietary patterns: vegetables, fruit, Mediterranean-style, meat, dairy, and high-fat and high-sugar patterns. The fruit and Mediterranean-style patterns were found to have a negative association with vasomotor menopausal symptoms, whereas the high-fat and -sugar pattern showed a positive association.
One study explored the association between dietary patterns and outcomes during childbirth.41 The study identified 4 distinct dietary patterns: meat and high-fat; prudent; traditional vegetables; and sugar, refined grain, and processed foods. The findings suggested that none of these dietary patterns was associated with preterm birth or low birth weight (Table 2).
DISCUSSION
Summary of the Findings
This comprehensive systematic review investigated the association between dietary patterns identified through a posteriori and hybrid methods, and their relationship with health outcomes in Australian studies. The review identified 59 eligible studies (of which 25 were longitudinal in design) that examined associations between dietary patterns and their associations with health outcomes. The main findings are that healthy dietary patterns are associated with a reduced risk of cardiometabolic conditions, GDM, and HDP. Furthermore, unhealthy dietary patterns were associated with an increased risk of overweight/obesity, diabetes, insulin resistance, mental health conditions, and cognitive function impairment.
Even though this review supports the current ADG recommendation, the ADG were developed based on findings from a single nutrient or food group.16 It is critical that the current revision of the ADG87 considers dietary patterns in addition to individual food items or groups when making recommendations. Most of the prospective studies (17 out of 25) included in this systematic review were published after the release of the 2013 ADG.16 Therefore, the findings from these studies could be considered when updating the guidelines.
Comparison of Findings
In this review, healthy dietary patterns were associated with reduced risk of cardiometabolic conditions (such as obesity, insulin resistance, triglycerides, low-density-lipoprotein [LDL] cholesterol, total cholesterol, and prediabetes), GDM, and HDP. Additionally, a healthy dietary pattern may reduce the risk of mental health conditions (stress, depression, anxiety), cognitive function decline, and pregnancy complications (low birth weight and preterm birth). The healthy dietary patterns were characterized by a higher consumption of fruits and vegetables, whole grains, milk and dairy products. The findings of the current review align with previous systematic reviews of observational studies that reported a protective effect of healthy dietary patterns against multiple chronic conditions such as colorectal cancer,88,89 CVD,90 breast cancer,91 and overweight/obesity.92,93
Adopting a healthy dietary pattern offers a multifaceted approach to reduce the risk of diet-related health outcomes by influencing various interconnected mechanisms. These include the regulation of inflammation,94 blood sugar,95 weight,14 gut microbiota,96 antioxidant defenses,97 and immune function.98 Chronic inflammation, a common denominator in many diet-related diseases, can be mitigated by a healthy dietary pattern that is high in fruits, vegetables, and whole grains, as these contain anti-inflammatory components.94,99 Moreover, incorporating dietary components, such as fiber-rich foods, contributes to the regulation of blood sugar levels.100–102 This is particularly crucial to prevent and manage diabetes, where unstable blood sugar can lead to insulin resistance and other metabolic disorders.103 Additionally, high-fiber diets foster the growth of beneficial gut bacteria.104,105 A balanced and diverse gut microbiota is linked to improved digestion and nutrient absorption, and a diminished risk of gastrointestinal diseases.106 Furthermore, fruits and vegetables, rich in antioxidants, play a pivotal role in neutralizing free radicals and alleviating oxidative stress.107 Finally, maintaining a diet low in saturated and trans fats while increasing the intake of omega-3 fatty acids from sources like fish and nuts plays an important role in preventing chronic diseases.108
In this review, an unhealthy dietary pattern was associated with an increased risk of cardiometabolic diseases and related metabolic risks, consistent with other studies demonstrating a strong link to the development of chronic conditions.109 Unhealthy dietary patterns are characterized by high consumption of meat, fried and processed foods, saturated fat, added salt, added sugar, alcohol, and high-fat dairy products. Excess consumption of these dietary components is considered as a risk factor for chronic conditions in dietary guidelines including the ADG,16 World Health Organization,110 and the World Cancer Research Fund.111 Contrary to previous systematic reviews,112,113 findings of the current review on unhealthy dietary patterns and GDM/HDP are inconsistent. Despite contradictions, these studies are either global112 and include a large number of observational studies or focus on a larger number of cohort studies.113 In addition, it is important to note that the above 2 reviews included both a posteriori and a priori dietary analysis approaches. Furthermore, only 2 studies,73,74 which were part of the above two reviews, were included in the current review, and both had the same study population.
This review suggests an association between dietary patterns and mental health conditions, cognitive function, birth outcomes, and other health-related conditions. However, a definitive conclusion cannot be drawn because of the limited number of studies, confounding, and other methodological challenges. Most of the studies included in this review only measured dietary data at a single point in time. Dietary behavior is dynamic; therefore, it is important to assess it over time to establish associations with health outcomes. For instance, both early childhood and adulthood dietary exposures have been associated with overweight/obesity, which is a risk factor for many other health outcomes.114 Additionally, studies reported different exposure assessment time frames, ranging from 1 day to a lifetime recall period. This variability could potentially bias the results, and interpretation of the results is challenging.115
Implications for the ADG and beyond
Despite inconsistencies, overall, the findings highlight the positive effects of healthy dietary patterns and the detrimental effects of unhealthy dietary patterns on health outcomes in Australia. Although the 2013 ADG's dietary recommendations are mostly based on evidence that was derived from isolated food items,116 our findings are generally in line with the recommendations.117 However, the message in the ADG diet can focus on overall dietary patterns alongside individual dietary components. While recommendations based on individual foods are important for providing clear messages and encouraging measurable behavioral changes, people typically do not consume food items in isolation.118 Although difficult to define measurably, recommendations based on dietary patterns offer a more realistic and practical approach.119 Furthermore, evidence originating from studies that focus on dietary patterns and health outcomes rather than isolated food items has 3 main advantages. First, the methods account for the interactions and confounding effects of other food items to some extent.17,120 Second, analyzing dietary patterns is beneficial for evaluating dietary guidelines and can help identify the complex relationships between diet and health outcomes, as the combined effect of an entire diet may be greater than that of its individual components.17 Third, recommendations based on the whole diet may be easier for consumers to understand and follow.121
Despite the limited evidence on certain health outcomes, the available data on diet–disease relationships among Australian adults have been systematically gathered, which could help inform the current revision of the ADG. This review aligns with 1 of 4 priority research questions (“dietary patterns [combinations and amounts of foods regularly consumed]”) set for the revision of the 2013 ADG.87 Therefore, it is recommended that the ongoing revision of the ADG consider the comprehensive evidence on dietary patterns presented in this work. In recent years, countries other than Australia have emphasized using evidence on dietary patterns and health outcomes, in addition to isolated food items, to inform dietary guidelines.121 This approach considers not only the effect of ‘one-in-many’ but also ‘many-in-one’ dietary exposures on health outcomes. Overall, while it is important to continue using evidence that focuses on individual dietary components, these complex interactions between the components suggest that incorporating evidence on dietary patterns should also be a complementary approach when reviewing and developing dietary guidelines.
Limitations
Despite being conducted using a predefined set of criteria and protocol, this review has the following limitations. First, only observational studies were included. Therefore, confounding, including residual confounding from the original studies, cannot be ruled out. However, conducting randomized controlled trials to assess the long-term effects of dietary patterns on health outcomes is often infeasible or unethical.122 Second, the variation in dietary assessment tools, methods for deriving dietary patterns, naming conventions of dietary patterns, measurements of associations, and health outcomes introduces heterogeneity, making it difficult to compare results across studies. Third, while many studies used validated dietary assessment tools, such as FFQs, the dietary data in these studies often relied on self-reporting with varying recall periods (as shown in Table S2). Additionally, most of the data were collected at a single time point. This variability across studies could influence the reported relationship between dietary patterns and health outcomes. Fourth, different types of dietary patterns were derived from various methods. These patterns were classified into 2 commonly reported categories—healthy and unhealthy dietary patterns—based on the characteristics of the food items within each pattern. This approach helps reduce the risk of bias, although there remains the potential for misclassification. Finally, this systematic review does not include dietary patterns identified by standardized index-based approaches determined a priori, as these methods do not consider all dietary components consumed and only depend on selected food items a priori. However, this is an important area that could provide valuable evidence for dietary guidelines and should be explored in future reviews.
CONCLUSION
This review highlights the scarcity of longitudinal studies examining dietary patterns and health outcomes in Australian adults. Moreover, widespread inconsistencies in reporting dietary patterns and their effects on adverse health outcomes underscore the need for standardized approaches in analysis, nomenclature, and reporting of data-driven dietary patterns, as well as the need for further longitudinal studies. Despite these limitations, the overall synthesis of available evidence shows that healthy dietary patterns are associated with a reduced risk of chronic conditions, including cardiometabolic risks and outcomes, GDM, and HDP among Australian adults. Conversely, unhealthy dietary patterns are associated with an increased risk of cardiometabolic issues, mental health conditions, and cognitive decline. These findings align with the 2013 ADG,117 although the guidelines’ recommendations are largely based on individual food items. The ongoing revision of the ADG,87 threfore, should incorporate the findings from this review, alongside evidence on individual dietary components.
Author Contributions
Z.A.A.: Screened articles, extracted data, performed critical appraisal, organized and analyzed data, assessed quality of evidence, co-wrote the first draft, incorporated feedback from co-authors; K.D.: conceived the study, screened articles, extracted data, critically reviewed the draft, and read and approved the version of the manuscript being submitted; T.M.C.: performed critical appraisal, critically reviewed the draft, and read and approved the version of the manuscript being submitted; A.R., S.A., L.M., D.J.E., and R.A.: data interpretation, critically reviewed the draft, and approved the version of the manuscript being submitted; K.M.L.: conceived the study, data interpretation, critically reviewed the draft, and read and approved the version of the manuscript being submitted; Y.A.M.: conceived the study, screened articles, extracted data, assessed quality of evidence, co-wrote the first draft, incorporated feedback from co-authors, and supervised the overall project.
Supplementary Material
Supplementary Material is available at Nutrition Reviews online.
Funding
This research was funded by the National Health and Medical Research Council (NHMRC) (2009776). K.M.L. and Y.A.M. are supported by a NHMRC Emerging Leadership Fellowship (2009776 and 1173803). D.J.E. is supported by an NHMRC Leadership Fellowship (1196261). The findings of this review are solely the responsibility of the authors and do not represent the views of the funding institution.
Conflicts of Interest
Outside the submitted work, D.J.E. has received research grants from Bayer, Takeda, Invicta Medical, Apnimed, Eli Lilly, and Withings and has served on Scientific Advisory Boards or as a consultant for Apnimed, Invicta, Mosanna, Takeda, and Bayer. All other authors report no potential conflicts.
Data Availability
All data generated or analyzed during this study are included in this published article and its supplementary information files.
REFERENCES
National Health and Medical Research Council (
World Health Organization. Healthy diet.
World Cancer Research Fund/American Institute for Cancer Research. Diet, nutrition, physical activity and cancer: a global perspective. Continuous Update Project Expert Report.
National Health and Medical Research Council. A review of the evidence to address targeted questions to inform the revision of the Australian Dietary Guidelines 2011. Accessed April 19, 2024. https://www.eatforhealth.gov.au/sites/default/files/2022-11/n55d_dietary_guidelines_evidence_report_2011_0.pdf
National Health and Medical Research Council. Australian Dietary Guidelines. National Health and Medical Research Council;
