


Abstract
2-hydroxy-glutarate (2HG) is a metabolite that accumulates in isocitrate dehydrogenase (IDH)-mutated gliomas and can be detected noninvasively using MR spectroscopy. However, due to the low concentration of 2HG, established magnetic resonance spectroscopic imaging (MRSI) techniques at the low field have limitations with respect to signal-to-noise and to the spatial resolution that can be obtained within clinically acceptable measurement times. Recently a tailored editing method for 2HG detection at 7 Tesla (7 T) named SLOW-EPSI was developed. The underlying prospective study aimed to compare SLOW-EPSI to established techniques at 7 T and 3 T for IDH-mutation status determination.
The applied sequences were MEGA-SVS and MEGA-CSI at both field strengths and SLOW-EPSI at 7 T only. Measurements were performed on a MAGNETOM-Terra 7 T MR-scanner in clinical mode using a Nova 1Tx32Rx head coil and on a 3 T MAGNETOM-Prisma scanner with a standard 32-channel head coil.
Fourteen patients with suspected glioma were enrolled. Histopathological confirmation was available in 12 patients. IDH mutation was confirmed in 9 out of 12 cases and 3 cases were characterized as IDH wildtype. SLOW-EPSI at 7 T showed the highest accuracy for IDH-status prediction (91.7% accuracy, 11 of the 12 predictions correct with 1 false negative case). At 7 T, MEGA-CSI had an accuracy of 58.3% and MEGA-SVS had an accuracy of 75%. At 3 T, MEGA-CSI showed an accuracy of 63.6% and MEGA-SVS of 33.3%. The co-edited cystathionine was detected in 2 out of 3 oligodendroglioma cases with 1p/19q codeletion.
Depending on the pulse sequence, spectral editing can be a powerful tool for the noninvasive determination of the IDH status. SLOW-editing EPSI sequence is the preferable pulse sequence when used at 7 T for IDH-status characterization.
Whole brain spectral editing is a powerful tool for preoperative noninvasive determination of the isocitrate dehydrogenase (IDH)-status.
SLOW-EPSI at 7 T showed the highest accuracy for IDH-status prediction.
Noninvasive and accurate IDH-mutation assessment can contribute to decision-making in patients with glioma.
Spectral editing can be a powerful tool for the noninvasive determination of the isocitrate dehydrogenase (IDH)-status. There are, however, large differences in diagnostic accuracy, which can range from 33.3% up to 91.7% dependent on the field strength and applied method. Our results suggest that the whole brain SLOW-editing EPSI sequence is the preferable pulse sequence when used at 7 Tesla (7 T) for IDH-mutation status characterization. Moreover, the study highlights the importance of developing dedicated ultra-high field (UHF) (≥7 T) sequences for metabolic imaging to leverage the strengths and mitigate the weaknesses of the UHF systems. These results of noninvasive IDH-mutation determination with the aid of 7 T SLOW-editing EPSI sequence can contribute to optimized decision-making in patients with suspected glioma.
The isocitrate dehydrogenase (IDH) mutation status is one of the most important factors in the diagnostic process of gliomas which is reflected by its central role in the new 2021 WHO classification for Central Nervous System (CNS) tumors.1 Postoperative histopathological analysis including immunohistochemistry and gene sequencing is the gold standard for assessing the mutation status. 2-Hydroxy-glutarate (2HG) is a biochemical compound that accumulates in IDH-mutated gliomas and can be detected noninvasively using in vivo MR spectroscopy.2,3 Detection of 2HG can be used as a surrogate diagnostic as well as a prognostic marker.2,3 Moreover, preoperative detection of 2HG can have an impact on therapy planning.4,5 Recently, a further biomarker cystathionine was postulated as a spectroscopic marker for 1p/19q codeletion to complement the assessment of 2HG in tumor profiling.6–8
However, due to the low concentration of metabolites, for example, 2HG magnetic resonance spectroscopic imaging (MRSI) techniques have limitations with respect to signal-to-noise ratio (SNR), as well as to spatial resolution that can be obtained within clinically acceptable measurement times. The SNR limitation can be improved by increasing the main magnetic field strength B0. MR scanners with a B0 ≥ 7 Tesla (7 T) are called ultra-high field (UHF) scanners. Two other limitations to overcome are the limited sensitivity due to the low 2HG concentrations and the fact that 2HG is a J-coupled spin system having multiple resonances hidden by other stronger overlapping resonances. To tackle the problem of strong overlapping resonances, some techniques have been proposed, such as long echo-time (TE) schemes,9,10 2D correlation spectroscopy,3 and spectral editing.2,3,11 The long TE schemes and spectral editing are now common methods for detecting 2HG. The former utilizes the phase modulation with a TE = 97–110 ms for 2HG at 2.25 ppm to create a maximum 2HG signal difference with overlapping resonances (glutamate and glutamine). However, it usually needs to be combined with spectral fitting algorithms12,13 to estimate metabolite concentrations in post-processing because the overlapping resonances (glutamate and glutamine) are not null. In contrast, spectral editing techniques were developed to enable the removal of strong overlapping resonances from the weaker resonances underneath, resulting in a clean edited 2HG signal without the strict necessity for spectral fitting to visually identify the presence or absence of 2HG. However, for quantification of the concentration of 2HG, fitting is necessary.14 The most prominent in vivo spectral editing method is MEGA, which is a so-called J-difference editing technique.15 MEGA-editing has been proposed for editing of several molecules, for example, γ-aminobutyric acid (GABA),16,17 but also for Phosphorylethanolamine (PE)18 and for accurate measurement of 2HG.19–22 Yet, these techniques are mostly used at a field strength of 3 Tesla (3 T); however, dedicated methods specifically designed to perform at 7 T are sparse (eg,23). At UHF scanners, MEGA is mostly combined with semiLASER for localization; 17–21 however, the high specific absorption rate (SAR) of the used adiabatic radiofrequency (RF)-pulses in semi-LASER pose serious disadvantages at B0 ≥ 7 T counteracting the SNR advantage of UHF.
A more recent and UHF-specific spectral editing method, SLOW editing, has been proposed.24 SLOW overcomes most of the challenges MEGA-semiLASER poses at UHF, and has proven a viable alternative to MEGA-editing for multiple applications including 2HG, GABA+, and PE, and was integrated into a 3D spatial resolved EPSI25 sequence enabling whole brain spectral editing.24
This work reports on a prospective patient study comparing 5 spectral editing sequences: MEGA-semiLASER-SVS at 3 T and 7 T; 2D-MEGA-semiLASER-CSI at 3 T and 7 T, and, finally, SLOW-EPSI at 7 T. All sequences aim at optimal detection of 2HG for presurgical prospective prediction of the patients’ IDH status. Since MEGA-semiLASER-SVS/CSI (in short, MEGA-SVS/CSI) are the most applied pulse sequences for 2HG detection (and regarded as the spectroscopic reference method for IDH-status determination) they were chosen for comparison to SLOW-EPSI at 7 T. In addition, cystathionine a postulated marker for 1p/19q codeletion was assessed in suspected oligodendrogliomas.6–8 The study aimed at finding the most robust technique for noninvasive IDH-mutation status determination, having both maximum accuracy and specificity.
Materials and Methods
Scanner
All MR-imaging and MR-spectroscopic measurements were performed on a 7 T MAGNETOM-Terra scanner in clinical mode using a Nova 1Tx32Rx head coil and on a 3 T MAGNETOM-Prisma scanner equipped with a 32-channel head coil, both provided by the vendor (Siemens Healthcare, Erlangen, Germany).
UHF RF-mode
The clinical mode of the 7 T Terra system (1Tx, FDA-approved) was used.
Applied Pulse Sequences
The SLOW-EPSI was used as recently described.24–27 In brief, the refocusing/editing chemical-shift selective adiabatic pulse (CSAP) for SLOW editing was 24 ms. The bandwidth (BW) of editing-full and editing-partial ranged from 1.6 to 4.2 ppm and 2.7 to 4.2 ppm, respectively (Figure 1A). The editing result was obtained by the subtraction of the editing-full (acquisition #1) by the editing-partial signal (acquisition #2). TE = 68 ms, TR = 1500 ms, matrix = 65 × 23 × 9, FOV = 280 × 180 × 70 mm, averages = 1, and TA = 9:04 min. The parameters of MEGA-SVS and CSI15,28–32 were the following.
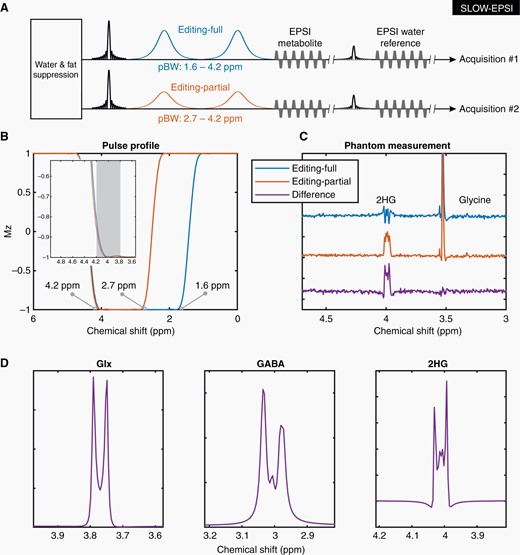
SLOW editing. (A) The sequence of EPSI-based SLOW-editing (SLOW-EPSI). The passband bandwidth (PBW) is 1.6–4.2 ppm for editing-full (acquisition #1), and 2.7–4.2 ppm for editing-full (acquisition #2). (B) Pulse profiles of editing-full and -partial pulse if used as inversion pulse. (C) The phantom measurement results: Editing-full (blue), editing-partial (orange), and difference (purple). (D) The simulation of Glx (glutamate/glutamine = 2/1), GABA, and 2HG under SLOW-editing, respectively. Note the striking resemblance between simulation and phantom measurement (B, E). Simulation of the spin system was performed using in-house MATLAB (R2019b) code, by solving relaxation-free Liouville-von Neumann Equation.33
At 3 T.
MEGA-SVS: TE = 75 ms, TR = 2000 ms, volume of interest (VOI) = 30 × 30 × 30 mm, averages = 64, and TA = 4:36 min. MEGA-CSI: TE = 75 ms, TR = 2000 ms, VOI = 80 × 80 × 25 mm, FOV = 160 × 160 × 25 mm (12 × 12 matrix), averages = 3, and TA = 8:43 min.
At 7 T.
MEGA-SVS: TE = 75 ms, TR = 2500 ms, VOI = 30 × 30 × 30 mm, averages = 64, and TA = 5:42 min. MEGA-CSI: TE = 75 ms, TR = 2900 ms, VOI = 70 × 70 × 20 mm, FOV = 200 × 200 × 20 mm (12 × 12 matrix), averages = 1, and TA = 8:10 min.
Before undergoing neurosurgery, all patients were examined using MEGA-SVS/CSI at 3 T and 7 T and SLOW-EPSI at 7 T on the same day within a total of 2 to 3 h time. In addition to MRSI, 3D-T1-MPRAGE, 3D-T2-SPACE as well as TOF-angiography were acquired.
Phantom Measurements
Prior to patient measurements, phantom measurements were performed at 7 T. The “Braino”-phantom (General-Electric, USA) was used with the following metabolite concentrations: 5 mM NAA (N-Acetyl-l-aspartic acid), 10 mM of Cr (creatine), 3 mM of Cho (choline chloride), 7.5 mM of mI (Myo-inositol), 12.5 mM of Glu (l-glutamic acid; the ionic form known as glutamate), and 5 mM of Lac (l-Lactic acid). Spherical 2HG-phantom consisted of a pH-7 buffered solution of 7.8 mM of 2HG and 18 mM of glycine.
Patients
The inclusion criteria were: (1) strong suspicion of a brain tumor visible on recent MRI without prior surgery and without indication for emergency surgery, (2) no contraindications for 7 T MRI, including being non-claustrophobic and, (3) the ability to endure 2 adjacent MRI-scans of 60 min duration each, (4) mental ability to give informed consent for participation in the study, and (5) no known neurodegenerative disease.
Placement of Spectroscopic Volumes
The placement of MEGA-SVS/CSI volumes and SLOW-EPSI slab for each method was performed by an MRS expert, with more than 30 years of experience, in consensus with a neuroradiologist.
Qualitative Analysis of MEGA-SVS/CSI Spectroscopy
For all MEGA-SVS and -CSI at both field strengths, the presence of 2HG-peak was assessed by 2 neuro-spectroscopy experts according to the following criteria:
- Clear separation of the Cho-peak at 3.21 ppm and Cr-peak at 3.01 ppm in the tumor region.
- Visibility of 2HG at 4.01 ppm.
- Presence/absence of ghosting artifacts in the spectra in the offset range of 3.5–4.5 ppm.
- The SNR of the 2HG should at least be 2 to be deemed present and, consequently, the tumor being IDH-mutated.
The definition of SNR is given in the Supplementary material.
Spectroscopic Analysis of SLOW-EPSI Data
Because SLOW-ESPI is a whole-brain MRSI, the sVOI was selected according to the following criteria:
- The sVOI includes visible lesions based on structural MRI (using at least sequences required by RANO criteria34).
- The SLOW-full/partial spectra showing abnormalities in one or all major metabolites (NAA, Cr, Cho, and mI) compared to the contralateral healthy control tissue.
- No or little (ghosting) artifact around 4.1–4.3 ppm, compared to the likely 2HG signal at 4.01 ppm.
- The SNR of the 2HG should at least be 2 to be deemed present and, consequently, the tumor being IDH-mutated.
After selecting the sVOI, 2 experts assessed the presence of 2HG-peak at 4.01 ppm (in consensus).
The presence of co-edited cystathionine was assessed with the criterion for positivity being the presence of 2 peaks (at 2.7 and 3.85 ppm) within and around the visible lesion compared to the contralateral healthy control tissue.
Comparison of the Overall Performance Scores of Qualitative Spectroscopy Analysis
Each of the 5 examined methods was analyzed individually for the presence of 2HG before surgery. Based on these analyses, 5 diagnoses were formulated for each MRS technique predicting the IDH-mutation status. These MRS-based diagnoses were thus formulated before histopathological diagnosis was known and compared afterward with the gold standard.
Diagnosis of the presence of 2HG-based of all 5 CSI/MRS(I)-methods was divided into 4 levels: “−−” for nonconclusive; “−” uncertain; “+” fairly certain; and “++” certain. For each case, the performed MRS(I) was scored as 5 (correct prediction with ++), 4 (correct prediction with +), 3 (correct prediction with −), 2 (wrong prediction with −), 1 (wrong prediction with +), 0 (wrong prediction with ++ or nonconclusive −−). The overall performance score was defined as the average of the scores and was divided by 5 to normalize.
Written histopathological and molecular reports (using the current 2021 CNS WHO classification) were assessed to obtain the final integrative diagnosis including CNS WHO Grade and the presence of IDH mutation. Patients were excluded from the analysis if a histopathological report could not be obtained/surgery was not performed.
Quantitative Analysis of Spectroscopy by Spectral Fitting
All spectroscopic data from both field strengths have been quantified using TDFDFit,13 an advanced prior-knowledge-based NLLS-fitting algorithm that uses mixed models of (simulated) metabolite basis sets and Voigt lines, comparable to LC-Model.35 For each of the 5 examined MRS(I) pulse sequences 5 separate prior knowledge models have been made, and the 2HG at 4.01 ppm and Glu at 3.75 and 2.45 ppm were determined from the spectra. An example of the basis set used for SLOW-edited spectra at 7 T is provided in Supplementary Figure S2. The accuracy of the fitting results was compared with the qualitative analysis performed by experts. The 2HG/Glu ratio was used to indicate the relative concentration of 2HG, with Glu serving as an internal reference. The Cramer-Rao minimum variance bounds (CR-MVB) were calculated to estimate the errors of fitting parameters.
Data Processing and Reconstruction
The reconstruction and processing were performed via Metabolic Imaging Data Analysis System (MIDAS),36 spectrIm-QMRS, and MATLAB R2019b (MathWorks, USA). The details of reconstruction and processing are shown in Supplementary Figure S1.
Statistical Analysis
Sensitivity and specificity were calculated for all 5 MR-spectroscopic methods regarding the histopathology report as the gold standard.
Ethics
The measurements were performed in conformity with the declaration of Helsinki and all local and national ethical regulations. All patients signed general consent forms and study-specific consent forms in advance before the scans took place.
Results
In vitro Measurement 2HG at 4.01 ppm
The pulse profiles of editing-full (1.6–4.2 ppm) and editing-partial (2.7–4.2 ppm) are displayed in Figure 1B. The corresponding measurement for the 2HG-phantom is shown in Figure 1C. Figure 1D shows the simulated editing-difference spectra of Glx at 3.76 ppm, GABA at 3.01 ppm, and 2HG at 4.01 ppm. Further details of phantom measurements are presented in Supplementary Figure S3.
In vivo MRS(I)
Fourteen patients with suspected glioma were included (patient characteristics are shown in Table 1). Surgery followed by histopathological analysis was performed in 12 of the 14 patients. Two patients did not receive surgery and were excluded from the analysis. The presence of an IDH mutation was confirmed by histopathology in 9 out of 12 cases and 3 cases were characterized as IDH wildtype (WT).
Patient Details with SLOW-EPSI Result
| Pat. | Tumor location | Integrative
diagnosis WHO grade | IDH 1/2 | IDH comment | 1p/19q codeletion | ATRX status (ICH) | ATRX-mutation | TERT-promoter-mutation | MGMT-promoter methylation | Max. dimeter a-p on T2 space | Max. dimeter m-l on T2 space | Max. dimeter c–c on T2 space | SLOW-EPSI | |||||
|---|---|---|---|---|---|---|---|---|---|---|---|---|---|---|---|---|---|---|
| 2HG | mI | Cho | Cr | NAA | ||||||||||||||
| 1 | Fronto-temporal L | Astrocytoma | 2 | Mutant | IDH1 R132H | negative (microsatellite analysis) | NC | NA | NA | NA | 67 | 56 | 63 | 1 | ↑ | ↑ | − | ↓ |
| 2 | Temporal R | Astrocytoma | 2 | Mutant | IDH1 R132H | negative (microsatellite analysis) | Loss | NA | No | NA | 40 | 25 | 35 | 1 | ↑ | ↑ | ↑ | ↓ |
| 3 | Insula R | Astrocytoma | 2 | Mutant | IDH1 R132L | NA | Loss | Yes | No | NA | 77 | 42 | 67 | 1 | ↑ | ↑ | − | ↓ |
| 4 | Parieto-occipital R | Astrocytoma | 2 | Mutant | IDH1 R132H | No | NC | p.R1426 | NA | NA | 23 | 26 | 26 | 1 | ↑ | ↑ | − | ↓ |
| 5 | Fronto-parietal R | Astrocytoma | 4 | Mutant | IDH1 R132H | NA | Loss | NA | NA | Yes | 63 | 43 | 44 | 1 | ↑ | ↑ | ↓ | ↓ |
| 6 | Parieto-occipital L | Astrocytoma | 4 | Mutant | IDH1 R132H | NA | Loss | NA | NA | Yes | 36 | 24 | 43 | 1 | ↑ | ↑ | − | ↓ |
| 7 | Fronto-parieto-temporal R | Glioblastoma | 4 | WT | NA | No loss | No | Yes | No | 75 | 47 | 54 | 0 | ↑ | ↓ | ↑ | ↓ | |
| 8 | Parieatal L | Glioblastoma | 4 | WT | NA | No loss | NA | Yes | No | 16 | 15 | 14 | 0 | ↑ | ↑ | ↓ | ↓ | |
| 9 | Frontal R | Glioblastoma | 4 | WT | NA | No loss | NA | Yes | No | 82 | 65 | 56 | 0 | ↓ | ↓ | − | ↓ | |
| 10 | Frontal L | Oligodendroglioma | 2 | Mutant | IDH1 R132H | Yes | NA | NA | Yes | NA | 44 | 38 | 46 | 1 | ↑ | ↑ | ↑ | ↓ |
| 11 | Frontal R | Oligodendroglioma | 3 | Mutant | IDH1 R132H | Yes | NA | NA | NA | Yes | 44 | 56 | 48 | 1 | − | ↑ | − | ↓ |
| 12 | Temporal L | Oligodendroglioma | 2 | Mutant | IDH1 R132H | Yes | No loss | NA | NA | NA | 25 | 11 | 8 | 0 | − | − | − | ↓ |
↑ and ↓ Indicate an increase and decrease (difference ≥ 15%), respectively, of the metabolite in the lesion compared with normal tissue;—represents unchanged of metabolite signal intensity.
2HG status was assessed with 5 spectroscopic methods at 2 different field strengths in all patients, namely MEGA-SVS at 3 T/7 T, MEGA-CSI at 3 T/7 T, and SLOW-EPSI at 7 T.
In SLOW-editing, the IDH-mutation-related 2HG signal at 4.01 ppm was detected in 8 out of 12 patients and no 2HG peak could be detected in the remaining 4 cases (Supplementary Figure S6 and Table S1). There were no inconclusive cases (sensitivity: 88.9%; specificity: 100%). At 7 T using MEGA-CSI, the 2HG signal was detected and in 7 patients, no 2HG-peak could be detected in 3 cases. There were 2 (16.7%) spectral quality-related inconclusive cases (sensitivity: 71.4%; specificity: 33.3%). At 7 T, using MEGA-SVS, a 2HG signal was detected in 4 patients, no 2HG peak could be detected in 7 cases. There was 1 (8.3%) ambiguous case (sensitivity: 87.5%; specificity: 66.7%). At 3 T, using MEGA-CSI, the 2HG signal was detected in 5 patients, and no 2HG peak could be detected in 6 cases. There was no ambiguous case but 1 case was not available for analysis due to quality (sensitivity: 55.6%; specificity: 100%). At 3 T using MEGA-SVS the 2HG signal was detected and in 3 patients, no 2HG-peak could be detected in 4 cases. There were 5 (41.7%) ambiguous cases (sensitivity: 50%; specificity: 66.7%). The accuracy and the overall performance scores are shown in Table 2. (The ROC-Curve analysis is provided in Supplementary Figure S5 and Table S3).
MEGA-SVS/CSI and SLOW-EPSI Results
| # | Pathology report | MEGA-SVS | MEGA-CSI | SLOW-EPSI | |||||||
|---|---|---|---|---|---|---|---|---|---|---|---|
| 3 T | 7 T | 3 T | 7 T | 7 T | |||||||
| Diagnosis | Confidence | Diagnosis | Confidence | Diagnosis | Confidence | Diagnosis | Confidence | Diagnosis | Confidence | ||
| 1 | Mutant | N.C. | −− | Mutant | ++ | Mutant | + | Mutant | + | Mutant | ++ |
| 2 | Mutant | WT | − | Mutant | + | WT | − | N.C. | −− | Mutant | + |
| 3 | Mutant | WT | − | N.C. | −− | WT | + | WT | + | Mutant | ++ |
| 4 | Mutant | Mutant | − | Mutant | ++ | WT | ++ | Mutant | + | Mutant | ++ |
| 5 | Mutant | Mutant | − | Mutant | + | Mutant | ++ | Mutant | + | Mutant | ++ |
| 6 | Mutant | N.C. | −− | Mutant | + | Mutant | + | Mutant | ++ | Mutant | ++ |
| 7 | WT | Mutant | − | Mutant | + | N.A. | 0 | Mutant | − | WT | + |
| 8 | WT | WT | + | WT | ++ | WT | ++ | WT | ++ | WT | ++ |
| 9 | WT | WT | ++ | WT | + | WT | ++ | WT | ++ | WT | ++ |
| 10 | Mutant | N.C. | −− | Mutant | + | Mutant | − | N.C. | −− | Mutant | ++ |
| 11 | Mutant | N.C. | −− | Mutant | ++ | Mutant | − | Mutant | ++ | Mutant | ++ |
| 12 | Mutant | N.C. | −− | WT | ++ | WT | + | WT | + | WT | − |
| Accuracy | 4/12 (33.3%) | 9/12 (75%) | 7/11 (63.6%) | 7/12 (58.3%) | 11/12 (91.7%) | ||||||
| Overall performance score | 35.0% | 68.3% | 60.0% | 60.0% | 91.7% | ||||||
N.C. Means not Conclusive, WT Means Wildtype, Mutant Means IDH-mutated, N.A. Means not Available. Confidence Levels: Very Confident (++), Confident (+), not Sure (−), not Conclusive (−−).
The comprehensive metabolic profile of each tumor was assessed on SLOW-EPSI spectra due to the excellent SNR and complete absence of in-plain chemical-shift-displacement-artifact (CSDA), allowing for unambiguous comparisons to the contralateral region.
- The neuronal tissue-marker NAA measured at 2.01 ppm, was clearly decreased in all cases.
- In 10 of 12 cases the mI signal (representing a glial marker), was higher in the tumor as in the contralateral region. Only in 2 cases (patient #11 (IDH-mutant CNS WHO grade 3 oligodendroglioma), and patient #12 (IDH-mutant CNS WHO grade 2 oligodendroglioma)) mI was similar in contralateral sVOI.
- In 7 cases, Cr was equal to the contralateral side and increased in 3 cases patient #2 (IDH-mutant CNS WHO grade 2 astrocytoma), patient #7 (IDH-WT CNS WHO grade 4 glioblastoma), and patient #10 (IDH-mutant WHO 2 oligodendroglioma), and in 2 cases decreased [patient #5 (IDH-mutant CNS WHO grade 4 astrocytoma) and patient #8 (IDH-WT CNS WHO grade 4 glioblastoma)].
- Cho (measured at 3.21ppm) was increased in 9 out of 12 cases, in 1 case was unchanged (patient #12, IDH-mutant CNS WHO grade 2 oligodendroglioma), and in 2 cases it was reduced compared to the contralateral side (patient #7 (IDH-WT CNS WHO grade 4 glioblastoma), and patient #9 (IDH-WT CNS WHO grade 4 glioblastoma)).
Comparison of Analysis Performed by Experts and Fitting Algorithms
The fitting results of SLOW and MEGA are shown in Supplementary Figure S6 and Supplementary Tables S4–8. In Supplementary Table S9 a comparison of diagnostic performance between qualitative analysis based on the visual interpretation of the spectra performed by expert raters and quantitative analysis based on prior knowledge of NLLS spectral fitting of the spectra is summarized.
On SLOW-EPSI at 7 T the experts incorrectly interpreted 1 case as wild type (false negative case #12) while the fitting algorithm correctly detected the 2HG signal, resulting in 100% accuracy in IDH-mutation status determination. For the spectra of the 4 other MEGA-based MRS(I) pulse sequences the experts performed better in the interpretation of SVS at 7 T and CSI at 3 T, while the fitting algorithm performed better in the analysis of SVS at 3 T and CSI at 7 T (Supplementary Table S9). For MEGA, the experts had an average accuracy (both 3 T and 7 T pooled) of 57.4% whereas the accuracy of the fitting algorithm was 55.3%. The increase of the main magnetic field strength improved the average accuracy of qualitative interpretation by experts from 47.8% at 3 T to 66.7% at 7 T and for the fitting approach from 43.5% at 3 T to 66.7% at 7 T.
MRS(I) Examples
Figure 2 illustrates the SLOW-EPSI results of 2 examinations (for IDH wildtype and IDH-mutated tumors). There is no 2HG signal in IDH wildtype (#8), whereas a clear 2HG signal was present in patient #3 with an IDH-mutated tumor (Editing difference = SLOW-partial minus SLOW-full). The passbands of the SLOW-full and -partial pulses are marked with black lines (Figure 2C′, D′). In addition to the editing-difference spectrum, the SLOW-full and -partial spectra also provide the following metabolic information: NAA decreases, Cr decrease, Cho increase, mI remains the same in IDH-wildtype patient #8, while NAA decrease, Cr remains the same, Cho increase and mI increase in IDH-mutant patient #3.
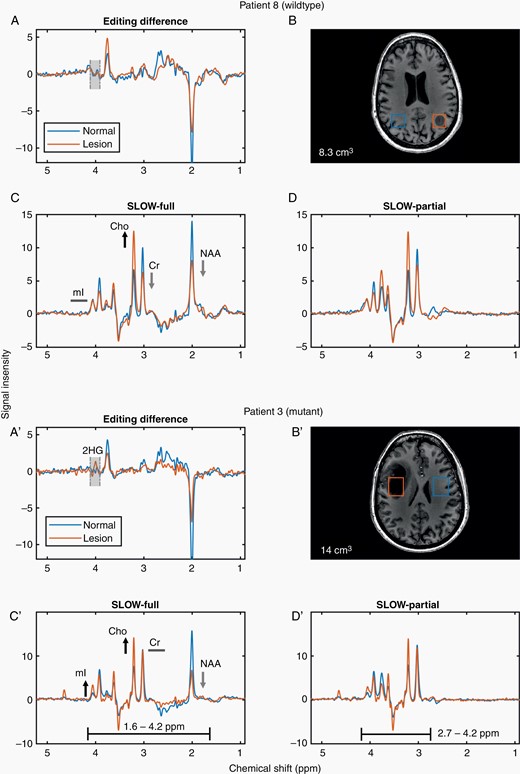
SLOW-EPSI for 2 patients (IDH wildtype/mutant). (A, A′) Editing difference = SLOW-partial minus SLOW-full. (B, B′) The corresponding MRI and displaced volume (7.6 cm3 in B and 14 cm3 in B′. (C, C′) SLOW-full acquisition. (D, D′) SLOW-partial acquisition.
Figure 3 compares the performance of SLOW-EPSI and MEGA-SVS/CSI at 7 T in 3 IDH-mutated tumors. The 2HG signal at 4.01 ppm is clearly present in all 3 patients using SLOW-EPSI (indicated by red arrows; histopathological confirmation of IDH mutation). However, MEGA-SVS failed to detect the 2HG signal in patient #3, while MEGA-CSI failed in all 3 patients. Figure 3D shows the corresponding MRI and VOI/sVOI.
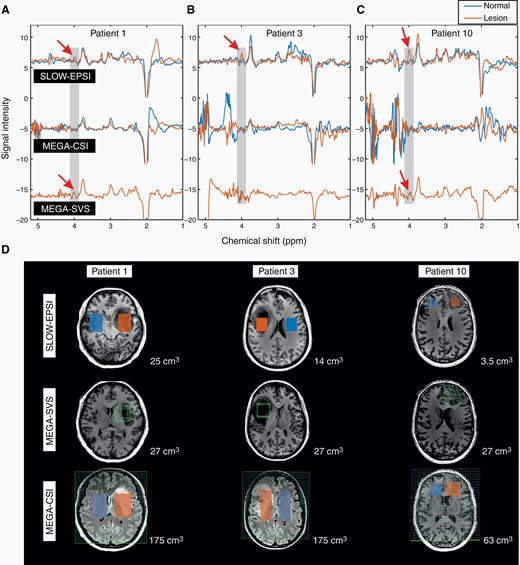
(A–C) The in vivo spectral editing difference (editing-partial minus editing-full for SLOW-editing, editing-on minus editing-off for MEGA-editing) within lesion/tumor (orange line) and mirror-symmetric normal tissue (blue line). The red arrows indicate the 2HG signals. (D) The MRI and corresponding MRSI/MRS volume-of-interest of 3 patients. The displaced volumes are indicated as orange (lesion) and blue (normal tissue) rectangular for SLOW-EPSI and MEGA-CSI. The size of the displaced volume is as indicated.
2HG Distribution and Co-edited Cystathionine
Figure 4 shows the spectrum of 3 locations (sVOI) in an IDH-mutated tumor (patient #10). In this case, the tumor center (A–A′) with the greatest changes in major metabolites (NAA, Cr, Cho, and mI) has low 2HG-levels compared with regions around (B–B′) and outside (C–C′) the tumor.
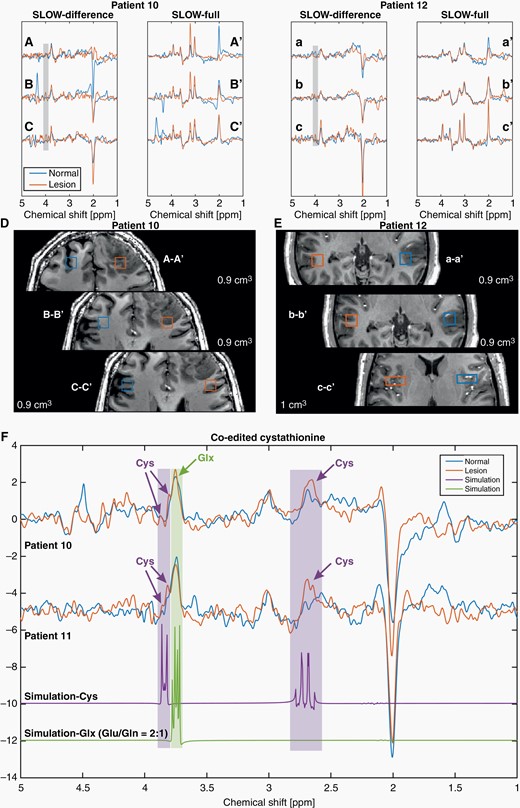
SLOW-EPSI for patients #10, 11, and 12. (A–C, a–c) Editing difference spectrum for 3 different locations, inside, around and outside the tumor in patients #10 and 12. (A′–C′, a′–c′) Corresponding SLOW-full spectrum. (D–E) Corresponding selected volume and MRI. (F) The cystathionine peaks (orange) are shown and indicated by purple arrows at 2.7 and 3.85 ppm in patients #10 and 11, respectively. Note that the selected volumes were not shown in the MRI. The simulations of cystathionine (purple) and Glx (glutamate/glutamine = 2:1, green) are shown.
The same approach was applied to another IDH-mutated tumor (patient #12), in which SLOW-EPSI and all MEGA-CSI/SVS failed to predict the IDH status.
Co-edited cystathionine was assessed in 3 patients with oligodendroglioma (#10, 11, and 12). The analysis showed: Positive findings in 2 patients and false negative findings in 1 patient (#12), also false negative for 2HG detection.
Discussion
SLOW-editing has been developed as a dedicated UHF-MRSI sequence and was therefore only performed on 7 T whereas the MEGA-based techniques were performed at both field strengths.
The principle of SLOW-EPSI for the detection of 2HG is illustrated in Figure 1. Because the 2HG has J-coupled spins at – 2CH (4.01 ppm) and – 3CH2 (1.82 and 1.98 ppm) groups, the J-evolution is restored using editing-partial pulse pair (orange) but not by using editing-full pulse pair (blue). Therefore, the 2 measurements result in 2 different spectra of 2HG, whereas the glycine resonance shows no difference since it is a non-J-coupled spin system. The editing-difference spectrum (purple) is the subtraction of the editing-full and -partial spectra, with the 2HG peak at 4.01 ppm enhanced and glycine eliminated (Figure 1C). This is the working principle of SLOW-editing to obtain the so-called edited spectrum with a non-masked 2HG signal. When applied in vivo, mI and Lac peaks overlapping with 2HG at about 4.01 ppm can fully be removed by SLOW-editing. Since Glx (glutamate/glutamine = 2/1) and GABA also have J-coupled spins in the same offset range as 2HG, they are also co-edited using the SLOW-editing sequence.
In our study, MEGA-SVS at 3 T performed the worst in predicting IDH status when accounted for a large number of ambiguous cases (4 of 12 predictions were correct), and the best performing method was SLOW-EPSI (11 of 12 predictions correct. However, for patient #12, all 5 different MRS-sequences failed to find 2HG in the spectra of the tumor and wrongly predicted the IDH-status as wildtype). SLOW-EPSI is the method with the highest accuracy for IDH-status prediction (91.7%) compared to MEGA-SVS/CSI. There are multiple reasons why this is the case:
SNR
The first and most obvious reason is that SLOW-EPSI is a method that has been specifically designed for use at UHF. Due to the very low SAR burden to the patient, SLOW-EPSI can benefit from better SNR per time unit compared to all MEGA-semiLASER-based methods investigated here. Better SNR also explains why the performance of MEGA-SVS is much better at 7 T than at 3 T. However, if SNR would be the decisive factor, one would expect that MEGA-CSI at 7 T would also outperform its counterpart at 3 T. This was not observed: MEGA-CSI at 3 T (63.6% accuracy) performs slightly better than at 7 T (58.3% accuracy). The reason for this is most likely the larger CSDA discussed below.
Adiabaticity
All five spectroscopic techniques use adiabatic refocusing- pulses which are, if applied within a correct B1+-amplitude range, very robust to B1+-inhomogeneities. At 7 T, however, there is not sufficient RF-peak power to guarantee full adiabatic performance over the VOI when using broadband slice selective phase compensated 2π-refocusing pulses (2π-SSAP) used in the MEGA-SVS/CSI sequences. In contrast, SLOW-EPSI uses narrow band 2π-CSAP that has an adiabatic performance B1+-safety range of 100% above the adiabatic threshold.24 This is the reason that the 2π-CSAP used in SLOW-EPSI acts closely to an ideal over the whole brain volume and does not add significant B1+-related spatial inhomogeneity in the clinical mode.24–27 In addition, the investigated MEGA-SVS/CSI-implementations use non-adiabatic small-band Gaussian-shaped editing pulses which are highly sensitive to B1+− as well as to B0-inhomogeneities. In SLOW-editing, the 2π-CSAP performs both refocusing and editing and is, at a given maximum B1+ peak power, more robust to B1+ inhomogeneities than the broadband 2π-SSAP counterparts.
B0-inhomogeneities
Since SLOW-editing utilizes the flat passband and stopband of 2π-CSAP, it is robust to B0-inhomogeneities in the magnetic field of at least 0.2 ppm (0.2 ppm ≥ ΔB0 ≥ −0.2 ppm).24 The MEGA-Gaussian shaped RF-pulses, however, are very sensitive to B0-inhomogeneities, especially for MEGA-CSI due to the larger shim-volume. This could be one of the reasons that MEGA-SVS has better accuracy performance (75% accuracy) than MEGA-CSI at 7 T (58.3% accuracy).
Chemical-Shift Displacement Artifact and SAR
The CSDA is inversely proportional to the pulse bandwidth (BW) of the used 2π-SSAP. There is only one way to reduce CSDA, and that is by increasing the bandwidths of these pulses. Unfortunately, the SAR of every specific RF-pulse type is linearly proportional to its BW; the BW in turn is limited by the scanners’ available maximum B1+-peak power since high-power linear RF amplifiers are very expensive components. However, even if the available B1+-peak power would be doubled, the associated larger SAR would inevitably force the use of longer TR, resulting in (extremely) long measurement times. This, in turn, results in low SNR per acquisition time unit as well as patient discomfort, completely counteracting the SNR advantage of UHF. Finally, the trade-off between CSDA and SAR, leads to poorer performance of MEGA-CSI at 7 T (accuracy 58.3%) compared to 3 T (accuracy 63.6%): The larger CSDA at 7 T inevitably leads to more severe spatial dependent and chemical-shift dependent refocusing, which negatively affects the editing quality and the interpretability of the spectra. This is especially the case if the tumor is located near the edge of the excited volumes/volume of interest (VOI): The effects of the CSDA are most severe. As was shown in the reference37 in these zones antiphase and multi-quantum coherences are generated, reducing the SNR, and causing spectral anomalies. These effects are absent when using narrowband 2π-CSAP, since there is no in-plane CSDA SLOW-EPSI. The SAR is only a fraction of all MEGA-semiLASER-based techniques and allows whole-brain coverage at a short repetition time (TR,1.5s) with a measurement time of 9 min.
Water/Lipid Suppression
In SLOW-EPSI, the water and lipid resonances are located in the stopband of 2π-CSAP, resulting in the implicit water/lipid and other resonances outside the passband suppression (dephasing) at zero SAR cost. This leads to significantly lower ghosting (3.8–5.3 ppm) and unwanted baseline role effects, cleaner spectra, and unambiguous detection of 2HG (Figure 3).
2HG Distribution
Our result (Figure 4) indicates that the 2HG distribution could be heterogeneous and slightly vary from the lesion depicted on T1w or T2w/FLAIR images. This is consistent with the previous works.22,38 More specifically, 2HG concentration could be higher outside or around the lesion than inside or in the center. This means that the spectral result is sensitive to the location of the VOI of MEGA-SVS/CSI, which is planned during measurement. This requires expert knowledge for optimal placement; more specifically, the operator should select the non-necrotic/apoptotic solid tumor part of the lesion. For this reason, MEGA-SVS/CSI is prone to sampling error. An unfortunate choice may cover a region of low 2HG concentration, giving a false negative result. This is not the case with SLOW-EPSI thanks to the advantage of whole-brain measurement: The location and size of the sVOI (to be distinguished from a predefined VOI) of SLOW-EPSI can be selected after the measurement enabling for example a larger region to be explored in a step-by-step approach.
Cystathionine Detection
Our method can also detect cystathionine (Figure 4), which is a postulated marker of the 1p/19q codeletion.6–8 In 2 out of 3 oligodendrogliomas with 1p/19q codeletion, the cystathionine was detected using the SLOW-editing scheme which was optimized for 2HG detection. In the false negative case both, cystathionine and 2HG were not detected. In the next step, SLOW-editing will be optimized for the detection of cystathionine.
Comparison of Artifacts
MEGA-SVS/CSI-based 2HG-editing showed large ghosting artifacts in the 3.8–5.3 ppm range in 9 out of 12 cases, often preventing unambiguous 2HG detection (see 3 typical cases in Figure 3). Despite the fact that the 2π-SSAP pulse times of semiLASER were chosen to be 8040 µs, these pulses could “just” reach their correct nominal 180-degree flip angles. However, sufficiently larger B1+ amplitude (flip angles >180 degrees) are required to guarantee robust adiabatic behavior under realistic B1+-inhomogeneity conditions of the 1Tx Nova head coil. For the narrowband 2π-CSAP in SLOW, the adiabatic condition can be easily met when using the standard 1Tx32Rx Nova head coil standardly delivered with each Terra system. Apparently, for broadband 2π-SSAP used in semiLASER, the criterium for adiabatic RF-pulse behavior using the Nova 1Tx32Rx head coil is not sufficiently met, resulting in unwanted ghosting artifacts. Finally, the degradation of spectral quality observed in MEGA-semiLASER-based editing is not only due to the B1+-inhomogeneities, but also to large CSDA, B0-inhomogeneities, insufficient water suppression, and inhomogeneous 2HG distribution, which can all being overcome by using SLOW-editing.26,27
Comparison to Previous Literature
Previous works have used MEGA-based spectral editing19 and non-editing10,39,40 MRS(I) to predict IDH status at 3 T. Accuracy was found to be 80.65% (25/31), 94.12% (16/17), and 53.85% (7/13) for 3 cohorts named discovery, preoperative validation, and recurrent-lesion validation cohorts using TE = 97 ms single-voxel PRESS-based SVS-sequence, respectively.10 For CSI in the same study, accuracy was 63.64% (26/41), 81.82% (18/22), and 86.67% (13/15) for the discovery, preoperative validation, and recurrent-lesion validation cohorts, respectively. Our SLOW-EPSI at 7 T has higher accuracy (91.7%) compared with the discovery cohort (80.65% and 63.64% for SVS and CSI). The SVS has a higher accuracy (94.12%) for the preoperative validation cohort while the CSI has a lower accuracy (81.82%). The performance of SVS (53.85%) was worse for the recurrent-lesion validation cohort compared to CSI (86.67%). The reason could be that detectable amounts of 2HG are located in different locations than the MRI-visible lesions. Additionally, the probability of accidental placement of a (small) SVS VOI in an area with a low concentration of 2HG is not negligible.
Comparison of Analysis Performed by Experts and Fitting Algorithms
Overall, the performance of qualitative analysis performed by experts and of the fitting-based quantitative analysis was similar in our study on the cohort level, but varies from case to case (Supplementary Table S9). The major pitfall for the quantitative fitting-based analysis is artifacts around 3.9–4.1 ppm. Such artifacts can potentially result in false identification of 2HG accumulation and an acceptable CR-MVB when relying on the fitting approach, while the expert would most likely identify the artifacts as false positive findings.
Limitations
The experts analyzing the spectra were not blinded to the method or field strength. The low sample size needs to be accounted for when interpreting the results. In more than 50% of cases, SLOW-EPSI was performed before MEGA-SVS/CSI at 7 T and then MEGA-SVS/CSI at 3 T. This could be a potential bias, as patients’ compliance tends to decrease as they stay in the scanner longer. However, it should be noted that there was a break between the 7 T and 3 T exams.
SLOW-EPSI analysis of 2HG status resulted in one false negative result (identified as WT while histopathology revealed an IDH-mutated tumor) and did not result in any false positive results. The false negative case (patient #12) was a small tumor in the left temporal lobe with a total volume of 2.9 mL (Volume non-enhancing tumor: 0 mL; Volume of contrast-enhancing tumor component 0 mL, FLAIR envelope/edema 2.9mL) (Figure 4 and Supplementary Figure S4) and marked with a low level of confidence. Histopathological analysis of this case revealed a very small tumor cell proportion with dominating edema. Similarly, the assessment of cystathionine revealed a false negative result in this case.
Importantly, the IDH status was correctly predicted in the smallest tumor (patient #9) of the presented cohort (1.6 mL, Volume non-enhancing tumor: 0.1 mL; Volume of contrast-enhancing tumor 0.7 mL, FLAIR envelope/edema 0.8) (Supplementary Figure S4). This tumor was located in the left parietal lobe. Notably, it was located further away from the skull base compared to the false negative case and was characterized by a larger proportion of tumors cells compared to edema in both, volumetry and histopathological analysis. We speculate that primarily the low tumor cell density within the mass combined with relative proximity to the skull base potentially contributed to the false negative result.
Due to the 2π-CSAP requiring a steeper transition band, the SLOW-editing does not work at low fields ≤1.5 T, and it might work at 3 T but needs to be investigated. On the other hand, SLOW could potentially benefit from a higher magnetic field (for instance, ≥9.4 T), which also remains to be studied.
Finally, it should be noted that SLOW-EPSI as used in this work is blind for spectral information of the 0.8 ppm–1.8 ppm range, eg, mobile lipids, lactate, and alanine are not available. However, high concentrations of the quartet of lactate could, in principle, be detected at 4.1 ppm.
Conclusion
Depending on the pulse sequence used, spectral editing can be a powerful tool for the noninvasive determination of the IDH status. There are, however, large differences in the diagnostic accuracy which can be obtained ranging from 33.3% for MEGA-SVS up to 91.7% for the SLOW-editing implemented within an EPSI sequence. The latter sequence enables whole-brain spectral editing of 2HG within a total measurement of approximately 9 min. The IDH-status prediction accuracy of MEGA-SVS at 7 T is higher than at 3 T. In contrast, the same was not true for MEGA-CSI which showed a slightly better prediction accuracy at 3 T. The reason for this is the larger CSDA at 7 T which strongly influences the editing performance, especially at the edges of the excited volume of the semiLASER-localization. In conclusion, the SLOW-editing EPSI sequence is the preferable pulse sequence when used at 7 T for IDH-mutation status characterization.
Given the importance of IDH mutation in glioma diagnostics with its prognostic value,41 this more accurate prediction of IDH-mutation status could contribute to decision-making between primary surgery and a watch-and-wait strategy.
Acknowledgments
We thank all patients for participating in this study. We thank our radiographers Samuel Stettler and Sabrina Herzog from the Inselspital (Switzerland). We thank Andrew A. Maudsley and Sulaiman Sheriff from the University of Miami School of Medicine (USA) for the milestone works in MRSI, for providing the EPSI sequence and discussions. We thank Gülin Öz, Dinesh Deelchand, Edward J. Auerbach, and Małgorzata Marjańska for the development of MEGA-semiLASER sequences which provided by the University of Minnesota (USA) under a C2P agreement.
Funding
The research is supported by the Swiss National Science Foundation (SNSF-182569) European Union’s Horizon 2020 research and innovation program under grant agreement No 813120 and Sitem Insel Support funding (SISF).
Conflict of Interest
We disclose that the application of SLOW-editing described in the paper has been filed at the International Bureau of WIPO as a PCT patent application. Patent applicant: Universität Bern. Published number: WO2022/229728.
Authorship Statement.
Ethics committee approval (JS). Study design and preparation (JS, RW, PR). MRSI methodology (GW, JS). Patient recruitment (EE, RK, PR, IZ, PS, PR). Histopathological reports and oversight (TM). Data analysis (GW, JS, PR). Manuscript preparation (GW, JS, PR). Manuscript editing (all authors). Johannes Slotboom and Piotr Radojewski contributed equally to the manuscript.
