


Abstract
Telomerase reverse transcriptase promoter (TERTp) mutations are a biological marker of glioblastoma; however, the prognostic significance of TERTp mutational status is controversial. We evaluated this impact by retrospectively analyzing the outcomes of patients with isocitrate dehydrogenase (IDH)- and TERTp-wild-type glioblastomas.
Using custom next-generation sequencing, we analyzed 208 glioblastoma samples harboring wild-type IDH.
TERTp mutations were detected in 143 samples (68.8%). The remaining 65 (31.2%) were TERTp-wild-type. Among the TERTp-wild-type glioblastoma samples, we observed a significant difference in median progression-free survival (18.6 and 11.4 months, respectively) and overall survival (not reached and 15.7 months, respectively) in patients with and without phosphatase and tensin homolog (PTEN) loss and/or mutation. Patients with TERTp-wild-type glioblastomas with PTEN loss and/or mutation were younger and had higher Karnofsky Performance Status scores than those without PTEN loss and/or mutation. We divided the patients with TERTp-wild-type into 3 clusters using unsupervised hierarchical clustering: Good (PTEN and TP53 alterations; lack of CDKN2A/B homozygous deletion and platelet-derived growth factor receptor alpha (PDGFRA) alterations), intermediate (PTEN alterations, CDKN2A/B homozygous deletion, lack of PDGFRA, and TP53 alterations), and poor (PDGFRA and TP53 alterations, CDKN2A/B homozygous deletion, and lack of PTEN alterations) outcomes. Kaplan–Meier survival analysis indicated that these clusters significantly correlated with the overall survival of TERTp-wild-type glioblastoma patients.
Here, we report that PTEN loss and/or mutation is the most useful marker for predicting favorable outcomes in patients with IDH- and TERTp-wild-type glioblastomas. The combination of 4 genes, PTEN, TP53, CDKN2A/B, and PDGFRA, is important for the molecular classification and individual prognosis of patients with IDH- and TERTp-wild-type glioblastomas.
- Median OS varies in isocitrate dehydrogenase (IDH)- and TERTp-wild-type GBM with and without PTEN loss/mutation.
- PTEN, TP53, CDKN2A/B, and PDGFRA are important in the molecular classification of IDH- and TERTp-wild-type GBM.
Biological markers for glioblastoma include TERT promoter (TERTp) mutations. As the frequency of TERTp mutations in glioblastoma is approximately 70%–90%, the relatively small number of TERTp-wild-type glioblastoma cases has limited the study of its molecular characteristics and prognostic factors. Here, we report that PTEN alterations are associated with favorable outcomes in patients with TERTp-wild-type glioblastomas. Using hierarchical molecular classification, we revealed 3 distinct clusters of TERTp-wild-type glioblastoma prognosis groups: good (alterations in PTEN and TP53, and lack of CDKN2A/B homozygous deletion and PDGFRA alterations), intermediate (alterations in PTEN, CDKN2A/B homozygous deletion, and lack of alterations in PDGFRA and TP53), and poor (alterations in PDGFRA and TP53, homozygous deletion of CDKN2A/B, and lack of alterations in PTEN). A combination of 4 genes (PTEN, TP53, CDKN2A/B, and PDGFRA) is important for the molecular classification and prognosis of patients with IDH- and TERTp-wild-type glioblastomas.
Glioblastoma (GBM) is the most common primary malignant brain tumor in adults and is classified as grade 4 by the World Health Organization (WHO). GBM’s relapse rate is very high, and median survival is typically only 10 to 11 months, even with multimodal treatment encompassing surgery, radiation, and chemotherapy.1 GBM is heterogeneous with a wide mutational spectrum.2–4 To obtain insights into the biology of this tumor and subsequently improve its diagnosis and treatment, the molecular classification of GBM has been intensifying.
TERT promoter (TERTp) mutations are collectively one of the biological and diagnostic markers for GBM.5–7 TERT is a reverse transcriptase catalytic subunit of telomerase that maintains telomere lengths.8 Telomere maintenance is essential for the unlimited proliferation of tumor cells and occurs in many cancer types via the reactivation of telomerase.9–11TERTp mutations lead to increased TERT expression and telomerase activation.12TERTp mutations are frequently observed in GBM. Recent studies indicated that 70%–90% of GBM genomes harbor TERTp mutations.13–15 In contrast, low frequencies of TERTp mutations were reported in Japanese groups.16–20 Thus, the frequencies of TERTp-wild-type GBM are higher in Japanese patients than in patients from other countries. Diplas et al. found that a subset of isocitrate dehydrogenase (IDH)- and TERTp-wild-type GBM utilized distinct genetic mechanisms of telomere maintenance driven by alternative lengthening in telomerase-positive cells displaying alterations in ATRX or SMARCAL1 and TERT structural rearrangements.21 However, for TERTp-wild-type GBM, there is relatively less information, and the mechanism of telomere maintenance remains unknown. To the best of our knowledge, there have been only 3 publications dedicated to IDH- and TERTp-wild-type GBMs.21–23
In this study, we examined a cohort of IDH- and TERTp-wild-type GBMs with next-generation sequencing (NGS) using a custom gene panel that we recently reported.16 This study aimed to examine the clinical characteristics of patients with IDH- and TERTp-wild-type GBMs and provide a better understanding of the molecular profiles of IDH- and TERTp-wild-type GBMs.
Materials and Methods
The current study adhered to the reporting recommendations for tumor marker prognostic studies (REMARK) guidelines. The completed checklist is provided in Supplementary Appendix 1.
GBM Samples
Two hundred and eight formalin-fixed paraffin-embedded (FFPE) tumor tissue samples were collected from Kagoshima University, Kyushu University, and University of Occupational and Environmental Health. The study was approved by the Institutional Review Board of Kagoshima University (approval number: 180104) and complied with the tenets of the Declaration of Helsinki. Informed consent was obtained from all patients. Resected tumors were fixed with 10% phosphate-buffered formalin within 24 hours of sampling and routinely processed for paraffin embedding, followed by sections for hematoxylin and eosin staining. All tumors were originally classified according to the WHO 2021 classification. All tissues were histologically evaluated by board-certified pathologists (M.K. and A.T.) to ensure an estimated tumor cell content of ≥ 30%.
Treatments
This was a retrospective study that included 208 patients with IDH-wild-type GBM with available molecular data between 2014 and 2022. We removed ≥90% of the tumor in 94 patients (45.2%) and < 90% of the tumor in 114 patients (54.8%). Additionally, 194 GBM patients were treated with temozolomide during radiotherapy, followed by temozolomide maintenance treatments. However, 14 patients were not treated because of poor clinical status attributed to factors such as advanced age or low Karnofsky Performance Status (KPS) scores.
DNA Extraction and Quantification
For DNA preparation from FFPE samples, we used the Maxwell 16 FFPE Tissue LEV DNA Purification Kit (Promega, Madison, WI, USA, Cat#AS1130) according to the manufacturer’s instructions. Thereafter, DNA concentration was measured using a Qubit 3.0 Fluorometer dsDNA BR Assay Kit (Life Technologies, Grand Island, NY, USA, Cat#Q32850), and DNA quality was monitored using the QIAseq DNA QuantiMIZE Kit (QIAGEN, Reston, VA, USA, Cat#333414). The extracted DNA was diluted to 5–10 ng/μL as a template, and PCR was performed using the QIAseq DNA QuantiMIZE Kit (QIAGEN, Cat#333414).
NGS
NGS was performed using the QIAseq Targeted DNA Custom Panel (QIAGEN, Cat#333525), as described previously.16 Amplicon sequences were aligned to the human reference genome GRCh37 (hg19) in the target region of the sequence. Data were analyzed using the QIAGEN Web Portal service (https://www.qiagen.com/).
Data Analysis
We used OncoPrinter (cbioportal.org/oncoprinter), which is a tool in the cBioPortal for Cancer Genomics software system, to visualize and analyze our data.24,25 We analyzed the data using EZR (Easy R) (Saitama Medical Center, Jichi Medical University, Saitama, Japan), a graphical user interface of the R software (The R Foundation for Statistical Computing, Vienna, Austria). We compared the risk groups and patient characteristics using the chi-square (χ2) and Kaplan–Meier log-rank tests, respectively. We also performed univariate and multivariate Cox regression analyses. A P-value of <.05 was considered statistically significant. Additionally, unsupervised average linkage hierarchical clustering was applied to the NGS data obtained from the tumors based on Jaccard’s matching coefficient to calculate distances. This analysis was performed using the R open-source statistical computing language (v3.5.3), integrated development environment RStudio (v0.99.484), and the R packages nmf (v0.20.6), mass (v7.3–51.5), and stats (v3.2.2). Cluster analysis was performed using Euclidean distance and Ward.D2 linkage.
Results
Clinical and Genetic Factors Associated With TERTp Mutation Status
We identified 208 patients with IDH-wild-type GBM with available molecular data between 2014 and 2022. Within this cohort, TERTp mutations were detected in 143 tumors (68.8%). The remaining 65 (31.2%) were TERTp-wild-type. Clinical factors, including sex, average patient age, KPS score, extent of resection (EOR), and chemoradiotherapy, were not significantly different between TERTp-wild-type and TERTp-mutant GBMs (Table 1). Moreover, progression-free survival (PFS) and overall survival (OS) were not significantly different between TERTp-wild-type and TERTp-mutant GBMs (P = .481 and P = .449, respectively; Supplementary Figure 1A, 1B). Importantly, PDGFRA amplification and/or mutation and TP53 loss and/or mutation were more common in patients with TERTp-wild-type GBMs than in those with TERTp-mutant GBMs (Table 1). Conversely, epidermal growth factor receptor (EGFR) amplification and/or mutation, and PTEN loss and/or mutation were more commonly observed in TERTp-mutant GBMs than in TERTp-wild-type GBMs (Table 1). There was no difference in the frequencies of ATRX, SMARCA4, and ARID1A mutations between patients with TERTp-wild-type and TERTp-mutant GBMs (Table 1).
Background of Patients With and Without TERTp Mutation
| Prognostic Factor | All (n = 208) | TERTp Mutation (n = 143) | TERTp Wild (n = 65) | P-value | |
|---|---|---|---|---|---|
| Sex | male | 123 (59.1%) | 87 (60.8%) | 36 (55.4%) | .543 |
| female | 85 (40.9%) | 56 (39.2%) | 29 (44.6%) | ||
| Age | 70 years> | 125 (60.1%) | 91 (63.6%) | 34 (52.3%) | .130 |
| 70 years≤ | 83 (39.9%) | 52 (36.4%) | 31 (47.7%) | ||
| KPS score | 80 points≤ | 103 (49.5%) | 75 (52.4%) | 28 (43.1%) | .233 |
| 80 points> | 105 (50.5%) | 68 (47.6%) | 37 (56.9%) | ||
| Resection | 90 %≤ | 94 (45.2%) | 67 (46.9%) | 27 (41.5%) | .548 |
| 90 %> | 114 (54.8%) | 76 (53.1%) | 38 (58.5%) | ||
| Chemoradiotherapy | Yes | 194 (93.3%) | 134 (93.7%) | 60 (92.3%) | .768 |
| No | 14 (6.7%) | 9 (6.3%) | 5 (7.7%) | ||
| CDKN2A/B homdel | 94 (45.2%) | 66 (46.2%) | 28 (43.1%) | .764 | |
| NF1 loss and/or mut | 49 (23.6%) | 38 (26.6%) | 11 (16.9%) | .159 | |
| PTEN loss and/or mut | 134 (64.4%) | 108 (75.5%) | 26 (40.0%) | <.001* | |
| RB1 loss and/or mut | 89 (42.8%) | 61 (42.7%) | 28 (43.1%) | 1.000 | |
| PDGFRA amp and/or mut | 43 (20.7%) | 14 (9.8%) | 29 (44.6%) | <.001* | |
| TP53 loss and/or mut | 86 (41.3%) | 49 (34.3%) | 37 (56.9%) | .003* | |
| EGFR amp and/or mut | 69 (33.2%) | 62 (43.4%) | 7 (10.8%) | <.001* | |
| ATRX loss and/or mut | 48 (23.1%) | 35 (24.5%) | 13 (20.0%) | .595 | |
| ARID1A mut | 6 (2.9%) | 5 (3.5%) | 1 (1.5%) | .668 | |
| SMARCA4 mut | 4 (1.9%) | 2 (1.4%) | 2 (3.1%) | .591 | |
KPS, Karnofsky Performance Status; mut, mutation; amp, amplification; homdel, homozygous deletion.
*indicates statistical significance.
Clinical and Genetic Factors Influencing Prognosis in TERTp-Wild-Type GBMs
In TERTp-wild-type GBMs, the most commonly altered genes were TP53 (57%), PDGFRA (45%), CDKN2A/B (43%), RB1 (43%), and PTEN (40%) (Supplementary Figure 2). First, we analyzed whether the identified genetic markers were prognostic markers in TERTp-wild-type GBM. Four clinical features, including sex, age, KPS score, and EOR, were reduced dimensionally via principal component analysis; one optimal feature set, named “clinical information” was subsequently created. Thereafter, we adjusted for covariates, including “clinical information,” in the multivariate Cox proportional hazards model. Notably, CDKN2A/B homozygous deletion and PDGFRA amplification and/or mutation were significant indicators of poor prognosis, as determined by our univariate analysis (hazard ratio [HR]: 2.16 [1.05–4.43], P = .036; and HR: 3.13 [1.48–6.63], P = .003, respectively; Table 2), but were not significant indicators of prognosis in our multivariate analyses. PTEN loss and/or mutation was a significant indicator of favorable prognosis, as determined by our univariate analysis (HR: 0.20 [0.08–0.46], P < .001; Table 2). In our multivariate analyses, PTEN loss and/or mutation was only an independent significant indicator of favorable prognosis in TERTp-wild-type GBM (HR: 0.25 [0.08–0.79], P = .018; Table 2). In contrast, PDGFRA amplification and/or mutation was a significant indicator of poor prognosis, as determined by our univariate (HR: 2.11 [1.03–4.31], P = .041) and multivariate (HR: 2.26 [1.04–4.91], P = .039) analyses in TERTp-mutant GBM (Supplementary Table 1).
Genetic Prognostic Factors in TERTp Wild-Type GBM
| Univariate Analysis | Multivariate Analysis | |||
|---|---|---|---|---|
| Prognostic marker | HR (95% CI) | P-value | HR (95% CI) | P-value |
| Clinical information | 0.99 (0.98–1.01) | .298 | 0.99 (0.97–1.01) | .404 |
| CDKN2A/B homdel | 2.16 (1.05–4.43) | .036* | 0.68 (0.25–1.90) | .464 |
| NF1 loss and/or mut | 0.40 (0.12–1.31) | .130 | 0.70 (0.20–2.53) | .590 |
| RB1 loss and/or mut | 0.83 (0.41–1.71) | .619 | 0.95 (0.42–2.14) | .907 |
| EGFR amp and/or mut | 0.19 (0.03–1.40) | .103 | 0.30 (0.04–2.48) | .266 |
| PDGFRA amp and/or mut | 3.13 (1.48–6.63) | .003* | 1.65 (0.68–4.02) | .267 |
| TP53 loss and/or mut | 1.55 (0.75–3.19) | .235 | 1.85 (0.83–4.10) | .130 |
| PTEN loss and/or mut | 0.20 (0.08–0.46) | <.001* | 0.24 (0.08–0.77) | .016* |
mut, mutation; homdel, homozygous deletion; amp, amplification.
*indicates statistical significance.
Second, we identified the clinical prognostic factors, which included analysis of the genetic markers for PTEN loss and/or mutation in TERTp-wild-type GBM. Our univariate analysis revealed that age (HR: 2.88 [1.38–6.00], P = .005), EOR (HR: 2.24 [1.06–4.73], P = .035), and PTEN loss and/or mutation (HR: 0.20 [0.08–0.46], P < .001) were significantly associated with prognosis (Table 3). Thereafter, we adjusted for covariates, including sex, age, KPS score, and EOR, in the multivariate Cox proportional hazards model. This analysis corroborated the finding that age and PTEN loss and/or mutation were independent prognostic markers of OS in patients with TERTp-wild-type GBM (HR: 2.69 [1.19–6.10], P = .018; and HR: 0.29 [0.11–0.76], P = .001, respectively; Table 3).
Clinical and Genetic Prognostic Factors in TERTp Wild-Type GBM
| Univariate Analysis | Multivariate Analysis | |||
|---|---|---|---|---|
| Prognostic factor | HR (95% CI) | P-value | HR (95% CI) | P-value |
| Sex (male) | 2.00 (0.96–4.18) | .065 | 2.12 (0.98–4.61) | .058 |
| Age (>70 years) | 2.88 (1.38–6.00) | .005* | 2.69 (1.19–6.10) | .018* |
| KPS score (≤80 points) | 1.96 (0.92–4.18) | .082 | 0.93 (0.40–2.16) | .862 |
| Resection (90%>) | 2.24 (1.06–4.73) | .035* | 2.05 (0.92–4.58) | .079 |
| PTEN loss and/or mut | 0.20 (0.08–0.46) | <.001* | 0.29 (0.11–0.76) | .012* |
KPS, Karnofsky Performance Status; mut, mutation.
*indicates statistical significance.
PTEN Loss and/or Mutation is Associated With Favorable Prognoses in Patients With TERTp-Wild-Type GBM
Supplementary Table 2 compares the genetic and clinical factors of the patients with TERTp-wild-type GBM based on their PTEN status. Patients with TERTp-wild-type GBM with PTEN loss and/or mutation were younger (P = .011) and had higher KPS scores (P = .005) than those without PTEN loss and/or mutation. We discovered that alterations in RB1 and EGFR in TERTp-wild-type GBMs were more common with PTEN loss and/or mutation than without PTEN loss and/or mutation (P = .021 and P = .014 for RB1 and EGFR, respectively). Conversely, in TERTp-wild-type GBMs, CDKN2A/B homozygous deletion and PDGFRA amplification and/or mutation were more common without PTEN loss and/or mutation than with PTEN loss and/or mutation (P = .011 and P = .005, respectively). We observed a significant difference in the median PFS (18.6 and 11.4 months, respectively; P = .003; Figure 1A) and OS (not reached and 15.7 months, respectively; P < .001; Figure 1B) in patients with and without PTEN loss and/or mutation in TERTp-wild-type GBM. We classified patients with PTEN homozygous deletion or PTEN mutation + loss as PTEN 2-hit, those with either PTEN heterozygous deletion or PTEN mutation as PTEN 1-hit, and those with wild-type PTEN as PTEN retain. The PFS and OS were significantly longer for PTEN 2-hit than for PTEN 1-hit and PTEN retain (P = .004 and P < .001 for PFS and OS, respectively; Figure 2A, 2B). However, the median PFS (8.5 and 15.4 months, respectively; P = .300; Figure 1C) and OS (17.8 and 23.5 months, respectively; P = .393; Figure 1D) were not significantly different when we compared TERTp-mutant GBMs with and without PTEN loss and/or mutation. These results indicate that PTEN loss and/or mutation is a good prognostic factor that depends on TERTp status.
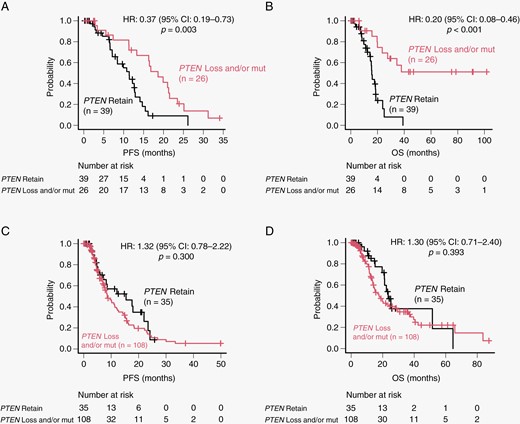
Unadjusted progression-free survival (PFS) and overall survival (OS) analyses of patients with IDH-wild-type glioblastoma according to TERTp and PTEN status. (A) Unadjusted PFS analysis of patients with and without PTEN loss and/or mutation in IDH- and TERTp-wild-type glioblastomas. (B) Unadjusted OS analysis of patients with and without PTEN loss and/or mutation in IDH- and TERTp-wild-type glioblastomas. (C) Unadjusted PFS analysis of patients with and without PTEN loss and/or mutation in IDH-wild-type and TERTp-mutant glioblastomas. (D) Unadjusted OS analysis of patients with and without PTEN loss and/or mutation in IDH-wild-type and TERTp-mutant glioblastomas.
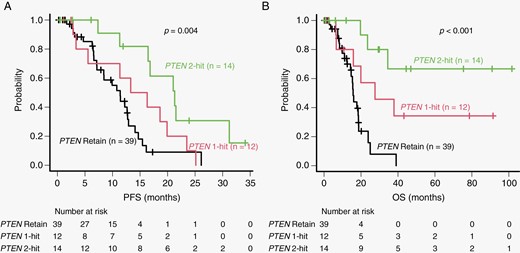
Comparison of PFS (A) and OS (B) in patients with PTEN 2-hit, PTEN 1-hit, and PTEN retain. Patients with PTEN homozygous deletion or PTEN mutation + loss were classified as PTEN 2-hit. Patients with either PTEN heterozygous deletion or PTEN mutation were classified as PTEN 1-hit. Patients with wild-type PTEN were classified as PTEN retain. PFS, progression-free survival; OS, overall survival.
Unsupervised Hierarchical Cluster Analysis of TERTp-Wild-Type GBM
We performed an unsupervised hierarchical cluster analysis on the 65 TERTp-wild-type GBMs, which revealed 3 major distinct groups. One major cluster (cluster 1) was characterized by alterations in PTEN and TP53 and lack of CDKN2A/B homozygous deletion and PDGFRA alterations (Figure 3A). The second major cluster (cluster 2) was characterized by lack of alterations in PDGFRA and TP53 (Figure 3A). The third major cluster (cluster 3) was characterized by alterations in PDGFRA and TP53, homozygous deletion of CDKN2A/B, and lack of alterations in PTEN (Figure 3A). Additionally, we compared the clinical features among clusters 1, 2, and 3. The average age in cluster 1 was 57.18 years, and these patients were significantly younger than those in clusters 2 and 3 (P = .002) (Supplementary Table 3). However, we did not detect any differences in clinical factors, including sex, KPS score, EOR, and chemoradiotherapy, among the clusters (Supplementary Table 3). However, the OS was significantly longer for cluster 1 than for clusters 2 and 3 (P = .002; Figure 3B).
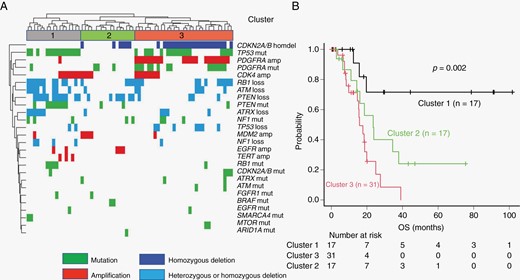
Risk stratification of patients with IDH- and TERTp-wild-type glioblastomas based on unsupervised hierarchical clustering analysis. (A) Results of unsupervised hierarchical clustering analysis in 65 IDH- and TERTp-wild-type glioblastomas. (B) Unadjusted Kaplan–Meier overall survival (OS) curves for each cluster.
Discussion
GBM is the most frequent and deadly primary brain tumor; it is heterogeneous with a wide mutational spectrum.2–4 In an effort to better classify IDH- and TERTp-wild-type GBMs, we used a custom gene panel to genotype these neoplasms. Herein, we demonstrated the impact of PTEN loss and/or mutation as a favorable prognostic marker of IDH- and TERTp-wild-type GBM. Additionally, we revealed the molecular genetic profile in Japanese patients with IDH- and TERTp-wild-type GBM and 3 major distinct groups of IDH- and TERTp-wild-type GBMs.
In the current study, no distinct difference in survival was observed for patients with TERTp-wild-type GBMs or TERTp-mutant GBMs. Similar findings of a lack of prognostic significance of TERTp mutations among IDH-wild-type GBMs were previously reported.21,26 Another report showed that PDGFRA amplification and TP53 loss were more common in TERTp-wild-type GBMs than in TERTp-mutant GBMs, while EGFR amplification and PTEN loss were more commonly observed in TERTp-mutant GBMs than in TERTp-wild-type GBMs.19 These findings are consistent with our results. Recently, Williams et al. reported that TERTp-wild-type GBMs showed frequent mutations in the PI3K pathway and BAF complex gene family (ATRX, SMARCA4, SMARCB1, and ARID1A),22 while our results showed no differences in the frequencies of ATRX, SMARCA4, and ARID1A mutations between TERTp-wild-type and TERTp-mutant GBMs. Unfortunately, our study did not include an analysis of mutations in the PI3K pathway. Diplas et al. identified novel molecular subgroups of TERTp-wild-type GBMs, including a telomerase-positive subgroup driven by TERT structural rearrangements, and an alternative lengthening of telomeres-positive subgroup with mutations in ATRX or SMARCAL1.21 Collectively, these data suggest that TERTp-wild-type GBMs are genetically distinct from TERTp-mutant GBMs.
Moreover, the frequencies of TERTp-wild-type GBM were higher in the Japanese group than in groups from other countries. Thus, we hypothesized that IDH- and TERTp-wild-type GBMs in our cohort have distinct molecular profiles and clinical characteristics. Herein, the frequencies of altered genes within IDH- and TERTp-wild-type GBMs were TP53: 57%, PDGFRA: 45%, CDKN2A/B: 43%, RB1: 43%, PTEN: 40%, and EGFR:11%. Recently, 2 US reports showed that the frequencies of altered genes in IDH- and TERTp- wild-type GBMs were TP53: 24%–69%, PDGFRA: 8%, CDKN2A/B: 12%–19%, RB1: 4%, PTEN: 13%–16%, and EGFR: 28%–31%,21,22 which were different from the frequencies observed in our study. These discrepancies may be caused by racial differences. Interestingly, in our study, when we excluded cluster 3, which was characterized by alterations in PDGFRA and TP53, the homozygous deletion of CDKN2A/B, and lack of PTEN alterations, the frequencies of altered PDGFRA and CDKN2A/B genes were similar to those of previous reports.21,22 Therefore, cluster 3 might include a specific subgroup of Japanese patients. For IDH- and TERTp-wild-type GBMs, CDKN2A/B homozygous deletion and PDGFRA amplification and/or mutation were associated with worse OS, while PTEN loss and/or mutation was a significant predictor of favorable outcomes. Only PTEN loss and/or mutation was an independent prognostic indicator in the multivariate analyses. Surprisingly, when examined according to Knudson’s “two-hit” hypothesis,27 patients with PTEN 2-hit such as PTEN homozygous deletion or PTEN mutation + loss had a better prognosis than patients with PTEN 1-hit and PTEN retain. Liu et al. showed that CDKN2A/B homozygous deletion is a poor prognostic marker for IDH- and TERTp-wild-type GBMs, which is consistent with our findings.23 To date, the prognostic value of PTEN alterations in GBM remains controversial. While several studies have reported the poor prognostic impact of PTEN alterations in GBM,28,29 other studies have reported favorable prognostic impact.30–33PTEN is a lipid phosphatase with a canonical role in dampening the PI3K/Akt-1 signaling pathway; hence, loss of PTEN driven by genetic alterations or epigenetic silencing has oncogenic consequences during gliomagenesis.34 In contrast, recent reports have shown that PTEN loss can be associated with a more favorable prognosis, since it leads to a better response to chemotherapy or radiotherapy.35,36 Moreover, in this study, patients with TERTp-wild-type GBM with PTEN loss and/or mutation were younger and had higher KPS scores than those without PTEN loss and/or mutation. Previous reports indicated that young age and high KPS scores are favorable prognostic factors.37,38 These findings would explain why PTEN alterations predict favorable outcomes in GBM. Interestingly, for TERTp-mutant GBMs, PTEN loss and/or mutation was not a predictor of OS in our study. Because TERTp-wild-type GBMs are genetically distinct from TERTp-mutant GBMs, the prognostic impact of PTEN may depend on TERTp status. To the best of our knowledge, the prognostic impact of PTEN loss and/or mutation in IDH- and TERTp-wild-type GBMs has not been documented.
Using hierarchical molecular classification of IDH- and TERTp-wild-type GBMs, we revealed 3 distinct groups. One major cluster (cluster 1) was characterized by loss and/or mutation in PTEN and TP53, and lack of CDKN2A/B homozygous deletion and PDGFRA amplification and/or mutation. Interestingly, cluster 1 was significantly associated with younger age and favorable prognosis. Previous reports showed that TP53 mutations can be associated with favorable prognosis.39–41 Thus, our finding that cluster 1, with PTEN loss and/or mutation and TP53 mutations, had a favorable prognosis is reasonable. Interestingly, evidence points toward an interplay between PTEN and TP53 in which they regulate each other at the transcriptional and protein levels.42,43 Our most striking finding was that PTEN, TP53, CDKN2A/B, and PDGFRA are important driver genes in the molecular classification of IDH- and TERTp-wild-type GBM. Furthermore, the combination of these 4 genes predicts individual outcomes in patients with IDH- and TERTp-wild-type GBM.
This study had some limitations. First, this was a retrospective study susceptible to selection biases. Second, epigenetic silencing of the PTEN promoter has been identified as an alternative method for gene inactivation.43 However, our study did not include an epigenetic analysis of PTEN.
Conclusions
We report that TERTp-wild-type GBMs are genetically distinct from TERTp-mutant GBMs, and PTEN loss and/or mutation is a good prognostic indicator in IDH- and TERTp-wild-type GBM. We recommend the incorporation of 4 combined genes (PTEN, TP53, CDKN2A/B, and PDGFRA) in the molecular stratification of IDH- and TERTp-wild-type GBMs. Such stratification will likely provide precise information to patients and help influence bedside decisions.
Funding
This work was supported by the Japanese Society for the Promotion of Science Grants-in-Aid for Scientific Research (JSPS KAKENHI, grant no. 21K16636).
Conflict of interest statement
The authors declare that they have no competing interests.
Authorship statement
Conception and design: N.H., A.T., K.Y., and R.H. Development of methodology: T.A., S.Y., and T.T. Acquisition of data (eg, acquired and managed patients and provided facilities): N.H., S.N., N.N., R.O., D.K., and M.K. Analysis and interpretation of data (eg, statistical analysis, biostatistics, and computational analysis): N.H., T.A., and S.Y. Manuscript writing, review, and/or revision: N.H., J.Y., A.T., K.Y., H.Y., and R.H. Administrative, technical, or material support (eg, reporting or organizing data and constructing databases): N.H., R.M., T.T., T.H., H.Y., H.U., T.A., K.M., and S.Y. Study supervision: N.H., J.Y., A.T., K.Y., H.Y., and R.H.
Ethics Approval and Consent to Participate
The study was approved by the Institutional Review Board of Kagoshima University (approval number: 180104) and complied with the Helsinki Declaration. Informed consent was obtained from all patients.
Data Availability
All data used and analyzed in the current study are available from the corresponding author upon reasonable request.
