


Abstract
Acute Kidney Injury (AKI) and Chronic Kidney Disease (CKD) represent two significant complications in patients who undergo radical (RN) nephrectomy in oncological patients. However, Living kidney donors (LKD) undergo a similar surgery, but kidney dysfunctions are rare. Our study aimed to investigate the incidence of AKI and CKD in a consecutive cohort of LKD.
This multi-institutional study involved 256 kidney donors who performed RN between 2014 and 2021 in four tertiary care hospitals. Clinical and laboratory data were collected at baseline pre-surgery, six months after surgery, and then every 12 months for a five-year follow-up. eGFR was calculated with the CKD-EPI equation. Statistical analysis was performed using descriptive statistics and logistic regression.
Descriptive analysis is reported in Table 1. Of note, the rate of AKI was high (85%), even though it was 100% of stage 1. At 12 months, LKD missed 27.9 ± 19.67 ml/min/1.73 m2, persisting stable at 60 months. 26% of patients developed CKD stage GIII, and 10% of patients lost about 30 ml/min/1.73 m2 from the baseline eGFR (Fig. 1 and Tables 1 and 2). The multivariate analysis (logistic regression) showed that age had a direct correlation with the risk of AKI (OR 1.057, p = 0.019), while the female sex was inversely correlated (OR 0.180, p = 0.006); on the other hand, age had a direct correlation with the risk of CKD (OR 1.15, p = 0.001), as well as eGFR before the surgery (OR 1,053, p = 0.027).
AKI and CKD affected a non-negligible percentage of LKD. However, it is remarkable that most LKD had a medium final eGFR >60 ml/min/1.73 m2 due to a healthy solitary kidney that worked properly, increasing its function by about 30% of its baseline capacity.
Renal decay in acute and chronic scenarios in LKD.
Descriptive analysis.
| Variables | Value |
|---|---|
| Age, years | |
| Mean (SD) | 50.7 (9.9) |
| Sex, n (%) | |
| Male | 73 (29) |
| Female | 183 (71) |
| Smoke, n (%) | 86 (33.6) |
| BMI | |
| Mean (SD) | 24.8 (3.3) |
| Hypertension, n (%) | 42 (16.4) |
| Diabetes, n (%) | 1 (0.4%) |
| Serum creatinine (pre-surgery) | |
| Mean (SD) | 0.78 (0.14) |
| Serum creatinine (60 months) | |
| Mean (SD) | 1.04 (0.21) |
| Total slope (eGFR pre–eGFR 12 m) | |
| Mean (SD) | 28.3 (14.0) |
| Slope (eGFR pre–eGFR 60 m) ml/min/1.73 m2/y | |
| Mean (SD) | 5.26 (2.57) |
| Slope (eGFR 12 m–eGFR 60 m) ml/min/1.73 m2/y | |
| Mean (SD) | 0.18 (1.94) |
| CKD stage pre-surgery | |
| normal kidney, % | 73 |
| GII, % | 27 |
| CKD stage at 60 m, mean | 2.16 |
| GI, % | 10.9 |
| GII, % | 62.5 |
| GIII, % | 26.6 |
| CKD stage change, mean | 0.79 |
| Unchanged, % | 20.3 |
| One class, % | 68.8 |
| Two classes, % | 10.2 |
| Acute Kidney Injury (any stage), n (%) | 206 (85.1) |
| Stage I, n (%) | 206 (100) |
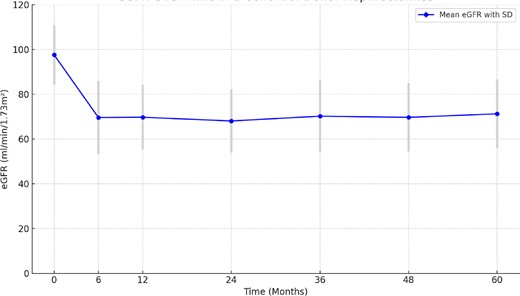
Mean eGFR over time.
| Time | eGFR, mean | SD |
|---|---|---|
| Pre-surgery | 97.5 | 13.30 |
| 6 months | 69.5 | 16.31 |
| 12 months | 69.6 | 14.49 |
| 24 months | 68.0 | 14.18 |
| 36 months | 70.1 | 16.09 |
| 48 months | 69.6 | 15.20 |
| 60 months | 71.2 | 15.29 |
| Time | eGFR, mean | SD |
|---|---|---|
| Pre-surgery | 97.5 | 13.30 |
| 6 months | 69.5 | 16.31 |
| 12 months | 69.6 | 14.49 |
| 24 months | 68.0 | 14.18 |
| 36 months | 70.1 | 16.09 |
| 48 months | 69.6 | 15.20 |
| 60 months | 71.2 | 15.29 |


Comments