


ABSTRACT
To explore the cut-off values of haemoglobin (Hb) on adverse clinical outcomes in incident peritoneal dialysis (PD) patients based on a national-level database.
The observational cohort study was from the Peritoneal Dialysis Telemedicine-assisted Platform (PDTAP) dataset. The primary outcomes were all-cause mortality, major adverse cardiovascular events (MACE) and modified MACE (MACE+). The secondary outcomes were the occurrences of hospitalization, first-episode peritonitis and permanent transfer to haemodialysis (HD).
A total of 2591 PD patients were enrolled between June 2016 and April 2019 and followed up until December 2020. Baseline and time-averaged Hb <100 g/l were associated with all-cause mortality, MACE, MACE+ and hospitalizations. After multivariable adjustments, only time-averaged Hb <100 g/l significantly predicted a higher risk for all-cause mortality {hazard ratio [HR] 1.83 [95% confidence interval (CI) 1.19–281], P = .006}, MACE [HR 1.99 (95% CI 1.16–3.40), P = .012] and MACE+ [HR 1.77 (95% CI 1.15–2.73), P = .010] in the total cohort. No associations between Hb and hospitalizations, transfer to HD and first-episode peritonitis were observed. Among patients with Hb ≥100 g/l at baseline, younger age, female, use of iron supplementation, lower values of serum albumin and renal Kt/V independently predicted the incidence of Hb <100 g/l during the follow-up.
This study provided real-world evidence on the cut-off value of Hb for predicting poorer outcomes through a nation-level prospective PD cohort.
What was known:
- •
Limited evidence on the cut-off values of haemoglobin (Hb) for clinical outcome has been published in the peritoneal dialysis (PD) population.
- •
This study aimed to explore the cut-off values of baseline and time-averaged Hb on adverse clinical outcomes in incident PD patients based on a national-level database.
This study adds:
- •
Our study indicated an independent value of time-averaged Hb <110 g/l in predicting mortality, major adverse cardiovascular events (MACE), modified MACE, hospitalization and transfer to haemodialysis in a PD population.
Potential impact:
- •
This research makes an important contribution to the academic literature by providing evidence from a large nationwide dataset demonstrating optimal Hb cut-off values for the prediction of adverse clinical outcomes in patients with PD, thus providing real-world evidence on the Hb target for anaemia therapy.
INTRODUCTION
Anaemia, as a common complication of chronic kidney disease (CKD), increases with the progression of CKD. It is well known that anaemia is associated with excess mortality, cardiac complications, hospitalization, cognitive decline and reduced quality of life in the CKD population [1–3].
The 2012 Kidney Disease: Improving Global Outcomes (KDIGO) Clinical Practice Guideline for anaemia in CKD recommended that haemoglobin (Hb) levels should be monitored at least monthly in patients on haemodialysis (HD) and every 3 months for non-dialysed CKD stage 3–5 and peritoneal dialysis (PD) patients [4]. However, the Hb target for initiating and tailoring anaemia therapy remains inconclusive, partly due to the heterogeneity of research design and the gap between the target and actual Hb achieved in previous interventional trials [5–10]. The relationship between the overdosage of iron supplementation or erythropoiesis-stimulating agents (ESAs) and increased cardiovascular events, death and infection is now well recognized [11–13]. Therefore, it is important to explore cut-off values of Hb and iron parameters as predictors of worse outcomes, updating real-world evidence for Hb targets in patients with CKD.
Recently the Peritoneal Dialysis Outcomes and Practice Patterns Study (PDOPPS) indicated that mean Hb ranges from 110 to 113 g/l and 16–23% of patients who underwent PD from six countries did not achieve the 100 g/l Hb cut-off [14]. However, investigations of the cut-off value of Hb to predict worse outcomes are scarce in a large-sample PD population. Three national-level PD cohort datasets have been published, showing inconsistent findings on the values of Hb and mortality [15–17]. Given that the PDOPPS data indicated significant variation in anaemia management strategies across countries [14], it is intriguing to investigate the cut-off values of Hb and clinical outcomes in the Chinese PD population, which has increased >10-fold to 120 000 cases over the last decade [18].
Thus we aimed to explore the cut-off values of Hb for adverse clinical outcomes in incident PD patients based on a national-level dataset from the Peritoneal Dialysis Telemedicine-assisted Platform (PDTAP) study [19].
MATERIALS AND METHODS
Study design
This is an observational cohort study using secondary data. The data source is the PDTAP database, which is a clinical database that prospectively collects data on patients receiving PD and evaluates PD management and clinical practice in China, as described in detail in our previous article [19]. Centres’ enrolment and participants’ eligibility and enrolment were already published and listed in the previous study. Every participant signed an informed consent form after the centre received ethics board approval, and the study was conducted in accordance with the Declaration of Helsinki. As part of their informed consent, the participants agreed to the use of their individual data in future studies. This present study was registered on ClinicalTrials.gov on 2 July 2021 (NCT04948424).
Study population
We screened all incident PD patients between 1 June 2016 and 30 April 2019 who were 18–80 years of age and had undergone PD treatment for >3 months due to end-stage kidney disease. We excluded patients with a diagnosis of any cancer within 12 months, with evidence of active bleeding within 30 days, without baseline Hb data, switched from HD, renal transplantation failure or receiving temporary PD (duration <30 days) because of acute kidney injury.
Clinical variables
In general, the PD staff recorded demographics data, primary disease, comorbidity, clinical questionnaires, dialysis prescription, drug information, hospitalization data and clinical outcomes. Laboratory data could be exported directly from the laboratory information management system of hospitals or input by the PD staff. Demographics data, primary disease and comorbidity were evaluated at baseline. Laboratory variables were measured at baseline and repeated every 3 months thereafter. Clinical questionnaires, dialysis prescription and drug information were evaluated at each visit. Dialysis adequacy was measured at baseline and repeated every 6 months. Baseline values were recorded as mean measurements during the first 3 months. During the follow-up, the mean values of laboratory variables, dialysis-relevant variables and doses of specific drugs were calculated using measurements taken over the preceding 3 months. Hb levels were averaged every 3 months and the data within the 2-year period of observation were calculated as the total time-averaged values.
Demographic and comorbidity data
Age, gender, body mass index (BMI), primary disease, education level, annual income, health insurance, residence and the presence of cardiovascular disease (CVD) and diabetes mellitus (DM) were collected within 1 week preceding PD catheter implantation. Cardiovascular disease was recorded if one of the following conditions was present: angina, class III–IV congestive heart failure (as defined by the New York Heart Association), transient ischaemic attack, history of myocardial infarction or cerebrovascular accident, and peripheral arterial disease [20]. The Charlson comorbidity index was evaluated [21].
Laboratory data
Laboratory data such as Hb, serum albumin, glucose, lipids spectrum, uric acid, urea, creatinine, calcium, phosphate, sodium, potassium and intact parathyroid hormone (iPTH) was examined. Iron status, evaluated as serum iron, ferritin, total iron binding capacity (TIBC) and transferrin saturation (TSAT), was available in 25 centres. Serum C-reactive protein (CRP) or high-sensitive CRP (hs-CRP) was measured by immune rate nephelometric analysis. Inflammation status was defined as CRP >5 mg/l or hs-CRP >3 mg/l.
Dialysis prescription and dialysis adequacy
Dialysis prescription, small molecule solute clearance, ultrafiltration and residual renal function (RRF) were measured. Small molecule solute clearance was defined as total, peritoneal and renal urea clearance (Kt/V) and creatinine clearance (CrCl). RRF was estimated using the average renal clearance of urea and creatinine.
Drug information
All drugs prescribed by nephrologists and non-nephrologists were recorded at each visit. For oral or intravenous supplementation, doses of element iron were calculated as mg/day. The doses of ESAs were calculated as amounts per week and then normalized by body weight (μg/kg/week). In the entire cohort, only recombinant human erythropoietin-α was used as an ESA during the study period.
Follow-up and definition of outcome events
All patients were followed-up until transfer to HD, renal transplantation, death, loss to follow-up or the end of the study (31 December 2020). There were three primary outcomes: all-cause mortality, major adverse cardiovascular events (MACE) and modified MACE (MACE+). MACE included myocardial infarction, unstable angina, stroke and cardiovascular deaths. MACE+ was a composite of myocardial infarction, unstable angina, stroke, heart failure and all-cause mortality. The secondary outcomes were occurrences of hospitalizations, first-episode peritonitis [22] and transfer to HD. The incidence of Hb lower than the time-averaged cut-off value during the follow-up among patients with Hb higher than the baseline cut-off value was also a secondary outcome.
Statistical analyses
The statistical results are presented as mean ± standard deviation (SD), median [interquartile range (IQR)] or percentages, as appropriate. We chose the 12-month period of observation here to calculate the total time-averaged values. Cubic spline regression analyses were used to examine the relationships between baseline and time-averaged Hb values, all-cause mortality, MACE and MACE+. Then the cut-off points of baseline and time-averaged Hb levels for the above events were created. The independent t-test, Mann–Whitney U test or χ2 test was used to compare the differences in variables between groups according to cut-off values of Hb. Differences in the risk for all-cause mortality, MACE and MACE+ curves between groups were evaluated using the logrank test, differences in the risk for transfer to HD and first-episode peritonitis were evaluated using competing risk Fine–Gray models and differences in the risk for hospitalization were evaluated using NegBin regression analyses. Risk factors for the first occurrence of Hb <100 g/l during follow-up were also evaluated using competing risk Fine–Gray models in the subjects with Hb ≥100 g/l at baseline. We report hazard ratios (HRs) with 95% confidence intervals (CIs) for the risk for all clinical outcomes by univariable and multivariable adjustment among the total cohort and subgroups (diabetes and non-diabetes, CVD and non-CVD, inflammation and non-inflammation). Baseline variables associated with each clinical outcome were identified by proportional hazards models and used as adjustment variables in the multivariable analysis. Survival analysis with time-averaged variables excluded patients with outcome events occurring in the first 12 months. All probabilities were two-tailed and the level of significance was set at 0.05. Statistical analyses were performed using SPSS version 20.0 (IBM, Armonk, NY, USA), R version 3.6.1 (R Foundation for Statistical Computing, Vienna, Austria) and Stata version 15.1 (StataCorp, College Station, TX, USA).
RESULTS
Clinical characteristics and follow-up
Between 1 June 2016 and 30 April 2019, a total of 2519 incident PD patients who met the eligibility criteria were enrolled and followed up until 31 December 2020 (Fig. 1). The baseline characteristics for the whole cohort are presented in Table 1. The mean age of our participants was 50.2 ± 13.8 years, with 42.4% female, and a mean BMI of 23.2 ± 3.6 kg/m2. Glomerular disease was the first primary renal disease. The prevalence of DM and CVD at baseline was 29.1% and 25%, respectively.
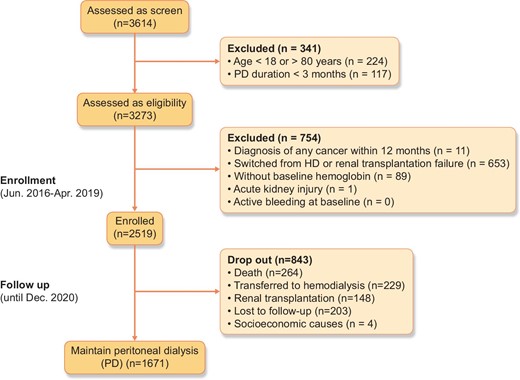
Flow chart of the study.
Clinical characteristics of total cohort and patients with baseline Hb <100 g/l or ≥100 g/l.
| Variables | Total cohort (N = 2519) | Baseline Hb <100 g/l (n = 1254) | Baseline Hb ≥100 g/l (n = 1265) | P-value |
|---|---|---|---|---|
| Clinical characteristics | ||||
| Age (years), mean ± SD | 50.2 ± 13.8 | 49.9 ± 13.6 | 50.5 ± 14.1 | .249a |
| Female, n (%) | 1068 (42.4) | 561 (44.7) | 507 (40.1) | .018b |
| Height (cm), mean ± SD | 165.5 ± 8.1 | 165.4 ± 8.0 | 165.5 ± 8.2 | .793a |
| Weight (kg), mean ± SD | 63.7 ± 12.4 | 64.0 ± 12.3 | 63.5 ± 12.5 | .321a |
| BMI (kg/m2), mean ± SD | 23.2 ± 3.6 | 23.3 ± 3.6 | 23.0 ± 3.5 | .105a |
| Education level, n (%) | <.001b | |||
| ≤Primary school | 631 (25.1) | 337 (26.9) | 294 (23.3) | |
| Middle school | 850 (33.8) | 444 (35.4) | 406 (32.1) | |
| High school | 538 (21.4) | 265 (21.1) | 273 (21.6) | |
| >High school | 499 (19.8) | 208 (16.6) | 291 (23.0) | |
| Annual income (per 10 000¥), n (%) | .015b | |||
| <2 | 758 (30.1) | 388 (30.9) | 370 (29.3) | |
| 2–5 | 1026 (40.8) | 533 (42.5) | 493 (39.0) | |
| 5–10 | 516 (20.5) | 244 (19.5) | 272 (21.5) | |
| >10 | 217 (8.6) | 89 (7.1) | 128 (10.1) | |
| Health insurance, n (%) | .001b | |||
| Medical insurance for urban residents | 1251 (49.7) | 574 (45.8) | 677 (53.5) | |
| New rural cooperative medical care | 1195 (47.4) | 641 (51.1) | 554 (43.8) | |
| Other | 73 (2.9) | 39 (3.1) | 34 (2.7) | |
| Residence, n (%) | .002b | |||
| Urban | 1109 (44.0) | 512 (40.8) | 597 (47.2) | |
| Rural | 1091 (43.3) | 585 (46.7) | 506 (40.0) | |
| Other | 319 (12.7) | 157 (12.5) | 162 (12.8) | |
| DM, n (%) | 733 (29.1) | 353 (28.1) | 380 (30.0) | .297b |
| CVD, n (%) | 629 (25.0) | 293 (23.4) | 336 (26.6) | .064b |
| Primary kidney disease, n (%) | .229b | |||
| Hypertensive nephrosclerosis | 371 (14.7) | 197 (15.7) | 174 (13.8) | |
| Diabetic nephropathy | 474 (18.8) | 219 (17.5) | 255 (20.2) | |
| Glomerular disease | 980 (38.9) | 486 (38.8) | 494 (39.1) | |
| Other | 694 (27.6) | 352 (28.1) | 342 (27.0) | |
| Charlson comorbidity index, median (IQR) | 2 (2–4) | 2 (2–4) | 2 (2–4) | .027b |
| SBP (mmHg), mean ± SD | 142.9 ± 18.5 | 143.8 ± 18.3 | 142.1 ± 18.6 | .023a |
| DBP (mmHg), mean ± SD | 87.9 ± 13.4 | 87.9 ± 12.6 | 87.8 ± 14.2 | .998a |
| Laboratory variables | ||||
| Serum albumin (g/l), mean ± SD | 35.5 ± 5.3 | 34.4 ± 5.2 | 36.5 ± 5.3 | <.001a |
| Hb (g/l), mean ± SD | 100.0 ± 16.6 | 86.7 ± 9.8 | 113.2 ± 10.2 | NA |
| hs-CRP (mg/l), median (IQR) | 2.1 (0.7–5.2) | 2.5 (0.8–6.2) | 1.8 (0.6–4.8) | <.001c |
| CRP (mg/l), median (IQR) | 5.0 (3.0–8.0) | 5.0 (4.0–11.3) | 5.0 (1.9–5.7) | .006c |
| Inflammation status*, n (%) | 799 (33.8) | 448 (38.5) | 351 (29.3) | <.001b |
| Blood glucose (mmol/l), mean ± SD | 5.9 ± 2.3 | 5.8 ± 2.4 | 5.9 ± 2.2 | .177a |
| Urea nitrogen (mmol/l), mean ± SD | 21.5 ± 7.1 | 22.5 ± 7.6 | 20.4 ± 6.4 | <.001a |
| Serum creatinine (μmol/l), mean ± SD | 756.3 ± 252.2 | 803.6 ± 266.5 | 709.6 ± 227.9 | <.001a |
| Uric acid (μmol/l), mean ± SD | 410.9 ± 93.3 | 419.7 ± 97.0 | 402.2 ± 88.8 | <.001a |
| Serum calcium (mmol/l), mean ± SD | 2.13 ± 0.22 | 2.08 ± 0.22 | 2.17 ± 0.20 | <.001a |
| Serum phosphorus (mmol/l), mean ± SD | 1.60 ± 0.42 | 1.66 ± 0.44 | 1.54 ± 0.38 | <.001a |
| Serum sodium (mmol/l), mean ± SD | 140.1 ± 3.1 | 140.0 ± 3.4 | 140.1 ± 2.8 | .347a |
| Serum potassium (mmol/l), mean ± SD | 4.26 ± 0.64 | 4.26 ± 0.67 | 4.25 ± 0.62 | .510a |
| Total cholesterol (mmol/l), mean ± SD | 4.8 ± 1.3 | 4.7 ± 1.3 | 4.8 ± 1.3 | .024a |
| Triglycerides (mmol/l), median (IQR) | 1.48 (1.09–2.00) | 1.43 (1.06–1.94) | 1.53 (1.13–2.08) | <.001c |
| Bicarbonate (mmol/l), mean ± SD | 25.4 ± 3.7 | 25.1 ± 3.9 | 25.6 ± 3.5 | .004a |
| iPTH (pg/ml), median (IQR) | 289.1 (162.4–444.7) | 310.3 (187.0–482.3) | 266.5 (146.2–404.2) | <.001c |
| TIBC (μmol/l), mean ± SD | 45.2 ± 9.8 | 44.2 ± 9.8 | 46.1 ± 9.7 | <.001a |
| Ferritin (ng/ml), median (IQR) | 168.3 (78.6–337.5) | 189.0 (84.4–377.0) | 155.8 (72.7–307.0) | <.001c |
| Serum iron (μmol/l), median (IQR) | 11.0 (8.3–14.6) | 10.5 (7.8–14.3) | 11.5 (8.8–14.8) | <.001c |
| TSAT (%), median (IQR) | 25.2 (18.5–33.6) | 24.6 (17.9–33.6) | 25.7 (19.4–33.5) | .078c |
| Total CrCl (l/w/1.73 m2), median (IQR) | 66.7 (52.5–83.5) | 64.5 (51.1–79.5) | 69.3 (53.9–86.9) | <.001c |
| Renal CrCl (l/w/1.73 m2), median (IQR) | 29.3 (15.7–47.6) | 26.1 (13.1–42.8) | 32.3 (18.0–52.1) | <.001c |
| Peritoneal CrCl (l/w/1.73 m2, median (IQR) | 36.6 (27.5–44.0) | 37.7 (27.9–44.7) | 35.5 (26.9–43.2) | .001c |
| Total Kt/V, median (IQR) | 2.06 (1.69–2.46) | 1.97 (1.64–2.37) | 2.12 (1.77–2.55) | <.001c |
| Renal Kt/V, median (IQR) | 0.72 (0.43–1.07) | 0.66 (0.36–0.98) | 0.80 (0.49–1.17) | <.001c |
| Peritoneal Kt/V, median (IQR) | 1.30 (1.02–1.63) | 1.32 (1.05–1.64) | 1.29 (1.01–1.61) | .297c |
| RRF (ml/min), median (IQR) | 2.86 (1.52–4.70) | 2.56 (1.29–4.24) | 3.14 (1.75–5.12) | <.001c |
| Anaemia-related medicine | ||||
| Iron supplementation, n (%) | 1360 (54.0) | 706 (56.3) | 654 (51.7) | .021b |
| Total iron element (mg/day), median (IQR) | 75.0 (23.5–140.0) | 71.0 (25.0–135.0) | 76.3 (22.4–150.0) | .583c |
| ESA administration, n (%) | 1981 (78.6) | 992 (79.1) | 989 (78.2) | .571b |
| Epoetin dosage (U/kg/week), median (IQR) | 130.7 (93.6–169.5) | 143.6 (111.6–186.9) | 114.9 (78.2–152.0) | <.001c |
DBP, diastolic blood pressure; hs-CRP, high-sensitivity C-reactive protein; SBP, systolic blood pressure; total Kt/V: total urea clearance.
*Inflammation status at baseline was defined as baseline CRP >5 mg/l or hs-CRP >3 mg/l.
aIndependent t-test.
bχ2 test.
cMann–Whitney U test.
During the median follow-up period of 27.0 months (IQR 20.0–36.0), 264 patients (10.48%) died, 229 (9.09%) were transferred to HD, 148 (5.88%) underwent kidney transplantation and 1671 (66.34%) were maintained on PD at the end of the study (31 December 2020).
Hb, clinical and treatment characteristics
By spline regression analysis, approximately L-shaped associations were observed for baseline and time-averaged Hb and clinical outcomes. Patients with baseline Hb <102 g/l, 104 g/l and 105 g/l were significantly associated with all-cause mortality, MACE and MACE+, respectively (P < .05 for all-cause mortality and MACE+). Time-averaged Hb <108 g/l, 109 g/l and 111 g/l was significantly associated with all-cause mortality, MACE and MACE+, respectively (P < .001 for all) (Fig. 2). Given that both baseline and time-averaged Hb <100 g/l showed significantly predictive values in the outcomes, we used the same cut-off point, i.e. 100 g/l, for further analyses.
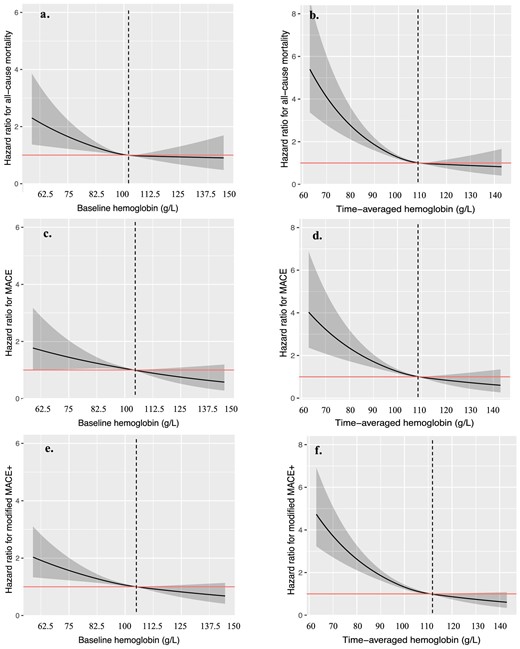
Association between baseline Hb (a, c, e), time-averaged hemoglobin (b, d, f) and clinical outcomes. Models were performed using spline regression analysis with knots at the 25th, 50th and 75th percentiles. Solid line represents estimated HR, shadow part represents the 95% CI. MACE includes myocardial infarction, unstable angina, stroke and cardiovascular deaths; MACE+ includes all-cause mortality, myocardial infarction, unstable angina, stroke and heart failure.
All subjects were then divided by the baseline Hb (≥100 g/l or <100 g/l) and time-averaged Hb (≥100 g/l or <100 g/l), respectively (Tables 1 and 2). The median baseline Hb in the total cohort, <100 g/l and >100 g/l was 100.0 g/l (IQR 88.8–111.0), 88.6 g/l (IQR 80.5–94.8) and 111.0 g/l (IQR 105.3–118.6), respectively, while the time-averaged Hb in the total cohort, <100 g/l and >100 g/l was 107.0 g/l (IQR 95.5–115.3), 90.0 g/l (IQR 82.4–95.2) and 112.3 g/l (IQR 116.9–118.3), respectively. A total of 1254 (49.8%) patients had baseline Hb levels <100 g/l and 823 (32.7%) patients had time-averaged Hb levels <100 g/l. They were more likely to be female, low-educated, with low-income, with less medical insurance for urban residents and living in urban areas compared with those with higher Hb levels (P < .001–.1). In terms of laboratory variables, patients with lower baseline or time-averaged Hb levels had significantly worse nutritional indices, represented by lower values of serum albumin, calcium, total cholesterol and triglycerides, and more inflammation, as reflected by hs-CRP or CRP values (P < .001–.05). These patients also showed lower total Kt/V and CrCl due to worse RRF (P < .001). Accordingly, serum phosphorus and iPTH levels were higher and bicarbonate levels were lower (P < .001–.05). In terms of iron indices, patients with lower baseline or time-averaged Hb levels had increased ferritin (storage) and decreased TIBC and TSAT values (usage) (P < .001–.1). Patients with lower Hb levels had lower total iron supplementation and higher daily epoetin dosage (P < .001–.05).
Clinical characteristics of total cohort and patients with time-averaged Hb <100 g/l or ≥100 g/l.
| Variables | Total cohort (N = 2519) | Time-averaged Hb <100 g/l (n = 823) | Time-averaged Hb ≥100 g/l (n = 1696) | P-value |
|---|---|---|---|---|
| Clinical characteristics | ||||
| Age (years), mean ± SD | 50.2 ± 13.8 | 48.7 ± 14.3 | 50.9 ± 13.5 | <.001a |
| Female, n (%) | 1068 (42.4) | 360 (43.7) | 708 (41.7) | .341b |
| Height (cm), mean ± SD | 165.5 ± 8.1 | 165.8 ± 8.0 | 165.3 ± 8.2 | .205a |
| Weight (kg), mean ± SD | 63.7 ± 12.4 | 64.2 ± 12.2 | 63.5 ± 12.4 | .150a |
| BMI (kg/m2), mean ± SD | 23.2 ± 3.6 | 23.3 ± 3.6 | 23.1 ± 3.6 | .237a |
| Education level, n (%) | .026b | |||
| ≤Primary school | 631 (25.1) | 232 (28.2) | 399 (23.5) | |
| Middle school | 850 (33.8) | 280 (34.0) | 570 (33.6) | |
| High school | 538 (21.4) | 169 (20.5) | 369 (21.8) | |
| >High school | 499 (19.8) | 142 (17.3) | 357 (21.1) | |
| Annual income (10 000¥), n (%) | .293b | |||
| <2 | 758 (30.1) | 249 (30.3) | 509 (30.0) | |
| 2–5 | 1026 (40.8) | 348 (42.3) | 678 (40.0) | |
| 5–10 | 516 (20.5) | 167 (20.3) | 349 (20.6) | |
| >10 | 217 (8.6) | 59 (7.2) | 158 (9.3) | |
| Health insurance, n (%) | <.001b | |||
| Medical insurance for urban residents | 1251 (49.7) | 352 (42.8) | 899 (53.0) | |
| New rural cooperative medical care | 1195 (47.4) | 445 (54.1) | 750 (44.2) | |
| Other | 73 (2.9) | 26 (3.2) | 47 (2.8) | |
| Residence, n (%) | <.001b | |||
| Urban | 1109 (44.0) | 315 (38.3) | 794 (46.8) | |
| Rural | 1091 (43.3) | 390 (47.4) | 701 (41.3) | |
| Other | 319 (12.7) | 118 (14.3) | 201 (11.9) | |
| DM, n (%) | 733 (29.1) | 245 (29.8) | 488 (28.8) | .606b |
| CVD, n (%) | 629 (25.0) | 194 (23.6) | 435 (25.6) | .259b |
| Primary kidney disease, n (%) | 0.177b | |||
| Hypertensive nephrosclerosis | 371 (14.7) | 136 (16.5) | 235 (13.9) | |
| Diabetic nephropathy | 474 (18.8) | 158 (19.2) | 316 (18.6) | |
| Glomerular disease | 980 (38.9) | 299 (36.3) | 681 (40.2) | |
| Other | 694 (27.6) | 230 (27.9) | 464 (27.4) | |
| Charlson comorbidity index, median (IQR) | 2 (2–4) | 2 (2–4) | 2 (2–4) | .496b |
| Time-averaged SBP (mmHg), mean ± SD | 141.7 ± 14.0 | 145.6 ± 14.0 | 139.9 ± 13.7 | <.001a |
| Time-averaged DBP (mmHg), mean ± SD | 87.6 ± 11.1 | 89.4 ± 11.7 | 86.7 ± 10.8 | <.001a |
| Laboratory variables (time averaged) | ||||
| Serum albumin (g/l), mean ± SD | 35.9 ± 4.9 | 33.9 ± 5.1 | 36.8 ± 4.6 | <.001a |
| Hb (g/l), mean ± SD | 105.1 ± 15.0 | 87.9 ± 9.4 | 113.4 ± 8.9 | NA |
| hs-CRP (mg/l), median (IQR) | 2.44 (0.96–5.57) | 2.98 (1.08–8.34) | 2.31 (0.92–5.03) | <.001c |
| CRP (mg/l), median (IQR) | 5.00 (2.16–8.23) | 5.00 (2.62–16.98) | 5.00 (1.98–7.60) | .0133c |
| Inflammation status*, n (%) | 644 (34.0) | 231 (40.0) | 413 (31.4) | <.001b |
| Blood glucose (mmol/l), mean ± SD | 6.0 ± 2.9 | 6.1 ± 4.1 | 6.0 ± 2.1 | .456a |
| Urea nitrogen (mmol/l), mean ± SD | 20.7 ± 6.2 | 21.9 ± 6.3 | 20.2 ± 6.0 | <.001a |
| Serum creatinine (μmol/l), mean ± SD | 804.5 ± 256.9 | 876.4 ± 281.2 | 769.7 ± 236.6 | <.001a |
| Uric acid (μmol/l), mean ± SD | 395.3 ± 75.6 | 405.4 ±8 1.4 | 390.3 ± 72.1 | <.001a |
| Serum calcium (mmol/l), mean ± SD | 2.16 ± 0.19 | 2.09 ± 0.20 | 2.20 ± 0.18 | <.001a |
| Serum phosphorus (mmol/l), mean ± SD | 1.58 ± 0.36 | 1.70 ± 0.41 | 1.53 ± 0.32 | <.001a |
| Serum sodium (mmol/l), mean ± SD | 139.8 ± 2.5 | 139.8 ± 2.9 | 140.1 ± 2.5 | .010a |
| Serum potassium (mmol/l), mean ± SD | 4.25 ± 0.55 | 4.29 ± 0.62 | 4.24 ± 0.52 | .031a |
| Total cholesterol (mmol/l), mean ± SD | 4.8 ± 1.2 | 4.7 ± 1.1 | 4.8 ± 1.3 | .041a |
| Triglycerides (mmol/l), median (IQR) | 1.49 (1.13–2.04) | 1.39 (1.06–1.93) | 1.53 (1.19–2.11) | <.001c |
| Bicarbonate (mmol/l), mean ± SD | 25.8 ± 3.3 | 25.5 ± 3.8 | 25.9 ± 3.0 | .002a |
| iPTH (pg/ml), median (IQR) | 280.4 (170.4–425.6) | 299.1 (191.6–457.0) | 271.8 (164.7–411.2) | <.001c |
| TIBC (μmol/l), mean ± SD | 45.6 ± 8.5 | 43.8 ± 8.9 | 46.5 ± 8.2 | <.001a |
| Ferritin (ng/ml), median (IQR) | 190.0 (99.0–352.5) | 220.4 (112.6–418.3) | 178.5 (91.9–312.0) | <.001c |
| Serum iron (μmol/l), median (IQR) | 12.8 (10.2–15.7) | 12.1 (9.1–15.4) | 13.0 (10.6–15.8) | <.001c |
| TSAT (%), median (IQR) | 28.4 (22.6–35.9) | 28.1 (21.3–37.7) | 28.6 (23.1–35.1) | .581c |
| Total CrCl (l/w/1.73 m2), median (IQR) | 63.3 (52.0–78.4) | 61.2 (51.6–75.0) | 65.0 (52.1–79.6) | .001c |
| Renal CrCl (l/w/1.73 m2), median (IQR) | 24.4 (12.5–40.6) | 20.2 (9.6–35.4) | 26.6 (13.5–42.7) | <.001c |
| Peritoneal CrCl (l/w/1.73 m2), median (IQR) | 38.3 (31.0–45.1) | 39.9 (31.4–47.2) | 37.8 (30.7–44.4) | <.001c |
| Total Kt/V, median (IQR) | 2.01 (1.71–2.37) | 1.87 (1.60–2.24) | 2.07 (1.76–2.41) | <.001c |
| Renal Kt/V, median (IQR) | 0.61 (0.34–0.95) | 0.48 (0.25–0.84) | 0.67 (0.41–1.00) | <.001c |
| Peritoneal Kt/V, median (IQR) | 1.37 (1.11–1.63) | 1.37 (1.11–1.66) | 1.37 (1.12–1.63) | .966c |
| RRF (ml/min), median (IQR) | 2.43 (1.24–4.03) | 2.01 (0.95–3.51) | 2.64 (1.34–4.23) | <.001c |
| Anaemia-related medicine (time averaged variables) | ||||
| Iron supplementation (%), median (IQR) | – | – | – | |
| Total iron element (mg/day), median (IQR) | 66.0 (22.5–20.0) | 60.0 (16.6–120.0) | 71.7 (27.5–122.5) | .029c |
| ESA administration (%), median (IQR) | – | – | – | |
| Epoetin dosage (U/kg/week), median (IQR) | 110.1 (76.1–154.1) | 142.9 (104.0–190.2) | 96.1 (67.9–137.5) | <.001c |
DBP: diastolic blood pressure; SBP: systolic blood pressure; total Kt/V: total urea clearance.
*Inflammation status during follow-up was defined as more than half of the time points for CRP >5 mg/l or hs-CRP >3 mg/l.
aIndependent t-test.
bχ2 test.
cMann–Whitney U test.
Primary and secondary outcomes
A total of 264 deaths (4.56/100 person-years), 197 episodes of CVD (3.40/100 person-years), 218 MACE (3.77/100 person-years), 397 MACE+ (6.86/100 person-years), 1251 hospitalizations (21.61/100 person-years) and 420 first-episode peritonitis (7.26/100 person-years) occurred during the study period. The most common causes of death were cardiovascular events, infections and tumours. Compared with patients with higher baseline or time-averaged Hb levels, patients with lower Hb levels had significantly worse clinical outcomes, with higher risks for all-cause mortality, CVD deaths, CVD events, MACE, MACE+ and hospitalizations (P < .001). No predictive value of baseline or time-averaged Hb level for first-episode peritonitis and permanent transfer to HD was observed (Table 3).
Outcomes (events/100 person-years) among PD patients.
| Outcome | Total cohort (N = 2519), n (%) | Hb <100 g/l (n = 1254), n (%) | Hb ≥100 g/l (n = 1265), n (%) | P-value | Time-averaged Hb <100 g/l (n = 529), n (%) | Time-averaged Hb ≥100 g/l (n = 1318), n (%) | P-value |
|---|---|---|---|---|---|---|---|
| Death | 264 (4.56) | 143 (5.08) | 121 (4.07) | .070 | 55 (4.31) | 65 (1.86) | <.001 |
| Cardiovascular events | 181 (3.13) | 98 (3.48) | 83 (2.79) | .132 | 38 (2.98) | 46 (1.31) | <.001 |
| Infection | 22 (0.38) | 11 (0.39) | 11 (0.37) | .881 | 4 (0.31) | 7 (0.20) | .410 |
| Tumour | 14 (0.24) | 8 (0.28) | 6 (0.20) | .523 | 3 (0.24) | 3 (0.09) | .156 |
| Severe malnutrition | 12 (0.21) | 6 (0.21) | 6 (0.20) | .932 | 3 (0.24) | 2 (0.06) | .074 |
| Multi-organ failure | 7 (0.12) | 5 (0.18) | 2 (0.07) | .231 | 1 (0.08) | 1 (0.03) | .478 |
| Gastrointestinal haemorrhage | 5 (0.09) | 2 (0.07) | 3 (0.10) | .686 | 1 (0.08) | 1 (0.03) | .372 |
| Unknown or miscellaneous | 23 (0.40) | 13 (0.46) | 10 (0.34) | .443 | 5 (0.39) | 5 (0.14) | .071 |
| MACE | 218 (3.77) | 115 (4.08) | 103 (3.47) | .225 | 42 (3.29) | 52 (1.49) | <.001 |
| Stroke | 24 (0.41) | 13 (0.46) | 11 (0.37) | .597 | 4 (0.31) | 4 (0.11) | .127 |
| Unstable angina | 15 (0.26) | 8 (0.28) | 7 (0.24) | .738 | 2 (0.16) | 2 (0.06) | .219 |
| Myocardial infarction | 12 (0.21) | 3 (0.11) | 9 (0.30) | .094 | 0 (0) | 5 (0.14) | .234 |
| Cardiovascular death | 181 (3.13) | 98 (3.48) | 83 (2.79) | .132 | 38 (2.98) | 46 (1.31) | <.001 |
| MACE+ | 397 (6.86) | 217 (7.71) | 180 (6.06) | .012 | 72 (5,65) | 86 (2.46) | <.001 |
| Heart failure | 123 (2.13) | 74 (2.63) | 49 (1.65) | .011 | 17 (1.33) | 20 (0.57) | .005 |
| Stroke | 24 (0.41) | 13 (0.46) | 11 (0.37) | .597 | 4 (0.31) | 4 (0.11) | .127 |
| Unstable angina | 15 (0.26) | 8 (0.28) | 7 (0.24) | .738 | 2 (0.16) | 2 (0.06) | .219 |
| Myocardial infarction | 12 (0.21) | 3 (0.11) | 9 (0.30) | .094 | 0 (0) | 5 (0.14) | .234 |
| All-cause death | 264 (4.56) | 143 (5.08) | 121 (4.07) | .070 | 55 (4.31) | 65 (1.86) | <.001 |
| Hospitalization | 1252 (21.63) | 650 (23.08) | 602 (20.26) | .034 | 230 (18.03) | 448 (12.81) | <.001 |
| Infection | 439 (7.58) | 216 (7.67) | 223 (7.50) | .880 | 57 (10.35) | 124 (3.54) | <.001 |
| Cardiovascular disease | 183 (3.16) | 105 (3.73) | 78 (2.62)x | .023 | 33 (4.47) | 45 (1.29) | <.001 |
| Catheter-related non-infectious complications | 154 (2.66) | 71 (2.52) | 83 (2.79) | .502 | 27 (2.91) | 68 (1.94) | .003 |
| Transfer to HD | 229 (3.96) | 119 (4.23) | 110 (3.70) | .485 | 36 (2.82) | 68 (1.94) | .088 |
| Severe fluid overload | 89 (1.54) | 52 (1.85) | 37 (1.25) | .063 | 18 (1.41) | 30 (0.86) | .119 |
| PD-related infection | 74 (1.28) | 38 (1.35) | 36 (1.21) | .635 | 9 (0.71) | 20 (0.57) | .657 |
| Complications related to increased intra-abdominal pressure | 19 (0.33) | 8 (0.28) | 11 (0.37) | .576 | 1 (0.08) | 8 (0.29) | .281 |
| Socio-economic causes | 14 (0.24) | 4 (0.14) | 10 (0.34) | .134 | 2 (0.16) | 4 (0.11) | .578 |
| Inadequate solute clearance | 13 (0.22) | 4 (0.14) | 9 (0.30) | .210 | 5 (0.39) | 1 (0.03) | .019 |
| Catheter-related non-infectious complications | 12 (0.21) | 8 (0.28) | 4 (0.13) | .227 | 1 (0.08) | 1 (0.03) | .513 |
| Unknown or other | 8 (0.14) | 5 (0.18) | 3 (0.10) | .428 | 0 (0) | 4 (0.11) | .271 |
| First-episode peritonitis | 420 (7.26) | 206 (7.32) | 214 (7.20) | .850 | 31 (2.49) | 111 (3.27) | .106 |
MACE includes myocardial infarction, unstable angina, stroke and cardiovascular deaths.
Hb, primary and secondary outcomes
All subjects were divided by the baseline Hb of 100 g/l to explore the relationship between baseline Hb value and outcomes. The variables associated with each clinical outcome by proportional hazards models were listed in Supplement Table 1 and Supplement Table 2. The predictive value of baseline Hb level <100 g/l was significant for higher modified MACE+ and hospitalization risk among all primary and secondary outcomes in the unadjusted models, however, the predictive value disappeared after multivariable adjustment, which was the same for all subgroups (Fig. 3 and Table 4).
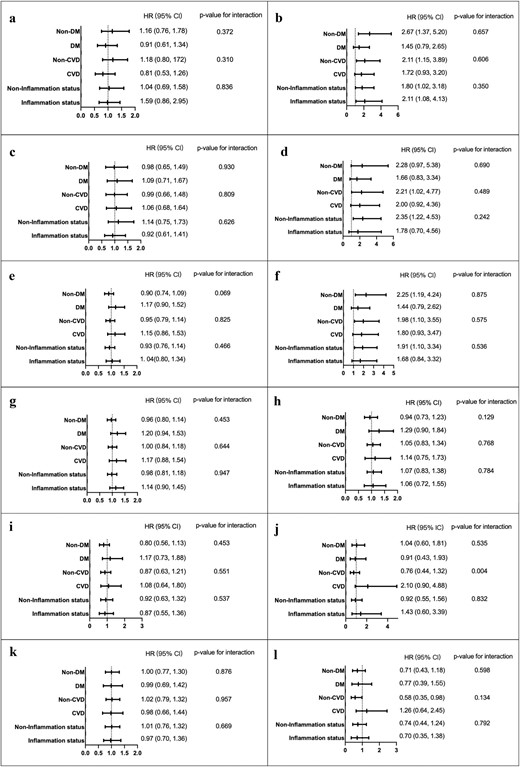
Long-term clinical outcomes between baseline Hb ≥ 100 g/l (reference group) and <100 g/l (a, c, e, g, i, k) or between time-averaged Hb ≥110 g/l (reference group) and <110 g/l (b, d, f, h, j, l). Outcomes: all-cause mortality (a, b), MACE (c, d), MACE+ (e, f), all-cause hospitalization (g, h), transfer to HD (i, j) and first episode of peritonitis (k, l). MACE includes myocardial infarction, unstable angina, stroke and cardiovascular deaths. Multivariable analysis adjusting for age, gender, annual income and serum albumin. *Inflammation status at baseline was defined as the baseline CRP >5 mg/l or hs-CRP >3 mg/l and inflammation status during follow-up was defined as more than half the time points for CRP >5 mg/l or hs-CRP >3 mg/l.
Association between Hb and clinical outcomes.
| Unadjusted | Adjusted | ||||
|---|---|---|---|---|---|
| Variable | HR (95% CI) | P-value | HR (95% CI) | P-value | |
| All-cause mortality | Baseline Hb | 1.25 (0.98–1.59) | .070 | 1.00 (0.76–1.33) | .994 |
| Time-averaged Hb | 2.45 (1.71–3.51) | <.001 | 183 (1.19–2.81) | .006 | |
| MACE | Baseline Hb | 1.18 (0.90–1.54) | .225 | 1.02 (0.76–1.38) | .874 |
| Time-averaged Hb | 2.33 (1.55–3.50) | <.001 | 1.99 (1.16–3.40) | .012 | |
| MACE+ | Baseline Hb | 1.29 (1.06–1.57) | .012 | 0.99 (0.76–1.28) | .283 |
| Time-averaged Hb | 2.44 (1.78–3.34) | <.001 | 1.77 (1.15–2.73) | .010 | |
| Hospitalization | Baseline Hb | 1.16 (1.01–1.33) | .034 | 0.98 (0.84–1.15) | .832 |
| Time-averaged Hb | 1.39 (1.16–1.67) | <.001 | 1.13 (0.93–1.37) | .220 | |
| Transfer to HD | Baseline Hb | 1.09 (0.84–1.41) | .529 | 0.90 (0.69–1.19) | .470 |
| Time-averaged Hb | 1.42 (0.95–2.12) | .088 | 1.03 (0.66–1.59) | .912 | |
| First-episode peritonitis | Baseline Hb | 0.98 (0.80–1.20) | .850 | 1.00 (0.80–1.23) | .965 |
| Time-averaged Hb | 0.72 (0.48–1.07) | .106 | 0.73 (0.48–1.09) | .124 | |
MACE includes myocardial infarction, unstable angina, stroke and cardiovascular deaths.
Multivariable analysis, adjusting for the variables associated with each clinical outcome identified by proportional hazards models (Supplementary Tables 1 and 2).
Next, all subjects were divided by the time-averaged Hb of 100 g/l. In univariate analyses, patients with time-averaged Hb <100 g/l had significantly higher risks for all-cause mortality, MACE and MACE+ in all subgroups and higher hospitalizations in all subgroups except the non-DM subgroup. The risk for transfer to HD was also higher in the CVD subgroup and the risk for first-episode peritonitis seemed to be lower in the non-CVD subgroup (Fig. 3 and Table 4).
We further analysed the independent role of time-averaged Hb for all clinical outcomes, adjusting for variables associated with each clinical outcome. Time-averaged Hb <100 g/l still significantly predicted a higher all-cause mortality in the total cohort [HR 1.83 (95% CI 1.19–2.81), P = .006], non-DM subgroup [HR 2.67 (95% CI 1.37–5.20), P = .004], non-CVD subgroup [HR 2.11 (95% CI 1.15–3.89), P =.017] and non-inflammation subgroup [HR 1.80 (95% CI 1.02–3.18), P = .041]. Similarly, time-averaged Hb <100 g/l showed a significantly higher risk for MACE+ in the total cohort [HR 1.77 (95% CI 1.15–2.73), P = .010], non-DM subgroup [HR 2.25 (95% CI 1.19–4.24), P = .013], non-CVD subgroup [HR 1.98 (95% CI 1.10–3.55), P = .023] and non-inflammation subgroup [HR 1.91 (95% CI 1.10–3.34), P = .023]. The risk for MACE was also higher in the total cohort [HR 1.99 (95% CI 1.16–3.40), P = .012], non-CVD subgroup [HR 2.21 (95% CI 1.02–4.77), P = .044] and non-inflammation subgroup [HR 2.35 (95% CI 1.22–4.53), P = .011]. The predictive value of time-averaged Hb level <100 g/l for transfer to HD and hospitalizations disappeared after multivariable adjustment, which was the same for all subgroups. The risk for first-episode peritonitis was lower in patients with time-averaged Hb <100 g/l in the non-CVD subgroup (Fig. 3 and Table 4).
Incidence and predictors of uncontrolled anaemia (Hb <100 g/l)
During the follow-up, a total of 764 first-episode Hb <100 g/l occurred in 1265 patients (25.71/100 patient-years) with baseline Hb ≥100 g/l. The time to the first episode was 13.5 months (IQR 6.7–25.0). After multivariable analysis, female [HR 1.26 (95% CI 1.09–1.47), P = .002] and the use of iron supplementation [HR 1.31 (95% CI 1.13–1.52), P < .001] significantly predicted the risk for the occurrence of Hb <100 g/l and older age [HR 0.99 (95% CI 0.98–0.99), P < .001], higher serum albumin [HR 0.98 (95% CI 0.96–0.99), P = .012] and renal Kt/V levels [HR 0.78 (95% CI 0.65–0.92), P = .004] were protective factors against the occurrence of Hb <100 g/l (Table 5).
Predictors of first-episode Hb <100 g/l among patients with Hb ≥100 g/l at baseline.
| Univariable analysis | Multivariable analysis | |||
|---|---|---|---|---|
| Variable | HR (95% CI) | P-value | HR (95% CI) | P-value |
| Age (years) | 0.99 (0.99–0.99) | .001 | 0.99 (0.98–0.99) | <.001 |
| Female | 1.25 (1.08–1.44) | .003 | 1.25 (1.06–1.48) | .008 |
| Serum albumin (g/l) | 0.98 (0.97–0.99) | .008 | 0.98 (0.96–0.99) | .012 |
| Use iron supplementation | 1.30 (1.12–1.51) | <.001 | 1.28 (1.08–1.51) | .005 |
| Renal Kt/V | 0.76 (0.65–0.90) | .001 | 0.78 (0.65–0.92) | .004 |
| Urea nitrogen (mmol/l) | 1.02 (1.01–1.03) | .001 | ||
| Serum phosphorus (mmol/l) | 1.39 (1.15–1.68) | .001 | ||
| Epoetin dosage (U/kg/week) | 1.001 (1.00–1.002) | .022 | ||
Renal Kt/V: renal urea clearance.
DISCUSSION
In our multicentre prospective PD cohort, baseline and time-averaged Hb values were 100.0 ± 16.6 g/l and 105.1 ± 15.0 g/l, respectively, which is comparable to the latest data from the US-PDOPPS Practice Monitor [23]. Only time-averaged Hb <100 g/l, rather than baseline Hb <100 g/l, was significantly associated with increased all-cause mortality, MACE and MACE+, following multivariable adjustment for patients and treatment characteristics.
The 2012 KDIGO Clinical Practice Guideline for anaemia in CKD recommends that ESA therapy should be initiated to avoid a Hb level decrease <90 g/l for adults with CKD stage 5D and not used to maintain Hb levels >115 g/l [4]. Subsequently, the European Renal Best Practice group and Japanese guidelines suggested a target Hb level of 100–120 g/l in patients with CKD [24, 25]. In real-world clinical settings, more studies have shown inconsistent findings in terms of Hb cut-off values to predict lower quality of life, mortality risk and CVD-related deaths over the past 10 years, i.e. <80 g/l, <100 g/l or <120 g/l among non-dialysis CKD, HD or PD populations [17, 26–29]. These findings indicate that the selection of the Hb value at which ESA therapy is initiated and adjusted may vary across different populations.
Of note, current recommendations are not specific to PD populations [4, 24, 25]. Evidence on the value of anaemia and clinical outcomes from national-level datasets remains lacking. The US Medicare system reported that baseline Hb levels <110 g/l were associated with increased mortality risk and hospitalization rates among PD populations [15]. According to DaVita dialysis data, a time-dependent Hb level <100 g/l was associated with mortality and CVD-associated death among patients with ESA-treated PD [16]. More recently, Taiwan Renal Registry data showed that a Hb level <100 g/l was significantly associated with higher all-cause and cardiovascular mortality risk [17]. Our present findings are aligned with results from DaVita dialysis data and Taiwan Renal Registry data and support less intensive therapy with lower Hb targets according to the 2012 KDIGO Clinical Practice Guideline [4]. Furthermore, due to conflicting findings from the limited evidence available for PD populations, we support an individualized policy for the selection of Hb for anaemia treatment, considering the potential benefits and harms [4].
Our data indicate that patients with lower Hb levels had poorer socio-economic status, reduced RRF and worse nutritional indices and inflammation status. Their iron storage was also higher, with lower iron usage and higher dose of ESAs, which is partly consistent with previous data [14, 16, 17]. The mean dose of iron supplementation was relatively low in our cohort compared with previous data [14, 30], i.e. 60 mg of iron, which is equal to two tablets of ferrous succinate per day or 60 mg of iron sucrose per week. This may explain the relatively low ferritin (196 mg) and TSAT (28.9%) in our cohort compared with the DOPPS Practice Monitor, the latter of which showed a gradual increase in ferritin and TSAT but a decrease in weekly ESA dose since 2010 [11, 23]. The gastrointestinal symptoms of oral iron are very common in patients with PD [31, 32] and are often suspected to be side effects of oral iron supplementation [33]. This is a possible cause for patients’ poor compliance and doctors’ concern regarding the prescription of oral iron [30, 34]. Intravenous iron sucrose is safe and tolerable [35], but inconvenient for PD, particularly as a home therapy modality. Thus there is an urgent need to develop more palatable and convenient iron supplements for PD populations.
Associations between lower Hb levels and poorer outcomes were more pronounced in subgroups with non-DM, CVD, non-CVD or non-inflammation in terms of different outcomes. Similarly, different associations of Hb and outcomes between the DM and non-DM groups have been suggested previously in the national dialysis registry in Japan [15, 27], the US Medicare data [15], the Japan-DOPPS study [36] and the Korean nationwide HD cohort [29]. These findings indicate that different targets of Hb levels should be set for patients with varied conditions.
As shown in our data, even among patients with Hb ≥ 100 g/l at baseline, 60.4% developed the first episode of Hb <100 g/l with a median 13.5 months of follow-up. Younger age, female sex, use of iron supplementation, lower serum albumin and renal Kt/V levels independently predicted the incidence of Hb <100 g/l during the follow-up. Our findings remind us to carefully monitor individuals with clinical characteristics relevant to nutritional status and residual renal function. In addition, although a higher dose of ESAs did not predict the risk for Hb <100 g/l by univariable analysis, we still need to pay more attention to the potential for ESA hyporesponsiveness. Previous studies have indicated that the inability to achieve target Hb levels, greater variation in Hb and the use of high-dose ESA were associated with poorer outcomes [29, 37, 38].
Compared with previous studies, the present one provides complete data on patients’ characteristics, dialysis prescriptions and treatment information [15–17]. All variables were adjusted as potential confounders of the association between Hb levels and clinical outcomes. Subgroup analyses included individuals with DM, CVD and inflammation at a higher risk for worse outcomes. Our study enrolled subjects 18–80 years of age with PD vintage >3 months, thus being more representative than previous national-level datasets [15–17]. We previously reported the core outcomes identified by the Standardized Outcomes in Nephrology–Peritoneal Dialysis [39], including all-cause and cause-specific mortality, CVD, transfer to HD, hospitalization and peritonitis, which have not been entirely explored in previous studies of PD [15–17]. Moreover, the exploration of potential predictors of anaemia incidence during follow-up among patients without anaemia at baseline is also a merit.
The present study had some limitations. First, we could not determine the cause–effect relationship between Hb levels and worse clinical outcomes due to the characteristics of observational studies. Potential confounders and mediators were excluded from the analysis. Although it is challenging to conduct randomized controlled trials that set different Hb targets for initiating and tailoring anaemia therapy, there is still a need for more robust evidence in different PD populations. Third, owing to different anaemia management strategies, our findings cannot be generalized to populations that apply different formulations of iron supplementation and ESAs. Lastly, all patients enrolled in this study used short-acting ESAs, which differed from their counterparts in western countries. The mean dosages of ESAs were also lower than those recommended in the guidelines [4]. This may limit the generalizability of our data.
In summary, our study indicated an independent value of time-averaged Hb <100 g/l in predicting mortality, MACE and MACE+ in the PD population, thus providing a real-world evidence on the Hb target for anaemia therapy. More interventional trials are needed to verify the potential benefits of anaemia correction with this target on clinical prognosis.
ACKNOWLEDGEMENTS
The authors express their appreciation to the patients, doctors and nursing staff of the PD centres of Peking University First Hospital, Second Hospital of Hebei Medical University, Xinqiao Hospital of Army Medical University, Peking University Shenzhen Hospital, First Affiliated Hospital of Zhengzhou University, Third Hospital of Hebei Medical University, Handan Central Hospital, Peking Haidian Hospital, People's Hospital of Qinghai Province, Cangzhou Central Hospital, Second Affiliated Hospital of Harbin Medical University, Shengjing Hospital of China Medical University, Second Affiliated Hospital of Anhui Medical University, First Affiliated Hospital of BaoTou Medical College, People's Hospital of Chuxiong, Peking University People's Hospital, Beijing Miyun District Hospital, Second Hospital of Shanxi Medical University, People's Hospital of Gansu, Pingdingshan First People's Hospital, first People's Hospital of Xining, First Hospital of Jilin University, Cangzhou People's Hospital, Taiyuan Central Hospital, People's Hospital of Langfang, Beijing Charity Hospital and Beijing Dongzhimen Hospital. This study protocol was reviewed and approved by the Ethics Committee of Peking University First Hospital (approval number 2018-100).
FUNDING
This study is supported by Scientific Research Project of Capital Health Development (2020-2-4079), CAMS Innovation Fund for Medical Sciences (2019-I2M-5-046), National High Level Hospital Clinical Research Funding (Scientific and Technological Achievements Transformation Incubation Guidance Fund Project of Peking University First Hospital 2022CR82); National High Level Hospital Clinical Research Funding (High Quality Clinical Research Project of Peking University First Hospital 2022CX09).
AUTHORS’ CONTRIBUTIONS
J.D. was responsible for the research idea and study design. X.X., Z.Y., H.P., Y.L., J.X., Q.L., L.D., S.G., Y.L., N.Z., T.J., R.Y., G.L., L.D., L.L., H.Z., Y.Z., Y.Y., Y.L., X.W., X.G., L.Z., C.Z., H.L., S.C., Y.W. and J.L. were responsible for data acquisition. X.X., Z.Y., Y.Z., J.W. and J.D. were responsible for statistical analysis. S.L., J.Z., Z.X., Z.Z., Y.L., Z.Z., G.F., W.H., F.S., Q.W., B.Z., L.H., C.W., H.C., L.Z., Y.S., L.W., Z.M., X.Z., Y.L., Z.X., S.D., X.C., Y.Y., Y.M., J.Z., M.Z. and J.D. were responsible for supervision or mentorship. Each author contributed important intellectual content during manuscript drafting or revision and accepts accountability for the overall work by ensuring that questions pertaining to the accuracy or integrity of any portion of the work are appropriately investigated and resolved. J.D. takes responsibility that this study has been reported honestly, accurately and transparently, that no important aspects of the study have been omitted and that any discrepancies from the study as planned (and, if relevant, registered) have been explained.
DATA AVAILABILITY STATEMENT
Data described in the manuscript, code book and analytic code will not be made available because the management of China's Human Genetic Resources does not allow sharing the information.
CONFLICT OF INTEREST STATEMENT
The authors have no conflicts of interest to declare.


Comments