


ABSTRACT
Cognitive impairment is often present shortly after transplantation in kidney transplant recipients (KTR). To date, it is unknown whether these impairments persist in the
long term, to what extent they are associated with disease-related variables and whether they affect societal participation and quality of life (QoL) of KTR.
This study was part of the TransplantLines Biobank & Cohort Study in the University Medical Center Groningen. A total of 131 KTR, with a mean age of 53.6 years (SD = 13.5) transplanted ≥1 year ago (M = 11.2 years, range 1–41.7 years), were included and compared with 306 healthy controls (HC). KTR and HC were well matched; there were no significant differences regarding age, sex and education. All participants were assessed with neuropsychological tests measuring memory, mental speed, attention and executive functioning, and with questionnaires examining societal participation and QoL.
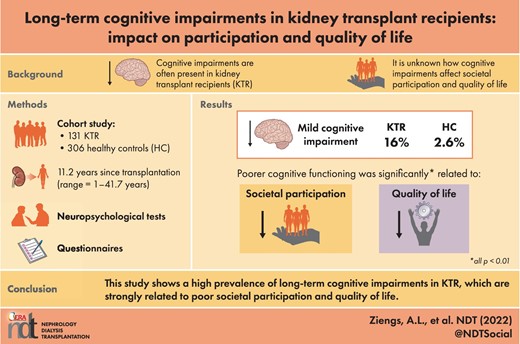
Compared with HC, KTR performed significantly worse on memory, mental speed and measures of executive functioning (all P-values <0.05). Moreover, 16% of KTR met the criteria for mild cognitive impairment (MCI), compared with 2.6% of the HC. MCI in KTR was not significantly correlated with age- and disease-related variables. Poorer cognitive functioning was significantly related to lower levels of societal participation and to lower QoL (all P-values <0.01).
This study shows long-term cognitive impairments in KTR, which are not related to disease-related variables. Neuropsychological assessment is important to timely signal these impairments, given their serious negative impact on societal participation and QoL.
What is already known about this subject?
Cognitive impairments are often present shortly after transplantation in kidney transplant recipients (KTR). To date, it is unknown whether these impairments persist in the long term and to what extent they affect societal participation and quality of life (QoL) of KTR.
What this study adds?
KTR scored significantly lower in all measured cognitive domains, at on average 11 years after transplantation. Furthermore, worse neuropsychological performances were related to lower levels of participation and QoL.
In total, 16% of the KTR met the criteria for mild cognitive impairment (MCI) compared with 2.6% of the HC. No significant correlations have been found between MCI with age- and disease-related variables.
What impact this may have on practice or policy?
Cognitive functions are not assessed routinely in KTR. Administering neuropsychological assessment in KTR could allow timely counseling or treatment regarding cognitive impairment, preventing decreased levels of participation and QoL.
INTRODUCTION
Patients suffering from end-stage kidney disease (ESKD) receive renal replacement therapy, either by dialysis or via transplantation. Kidney transplantation is the treatment of choice to increase survival chance and quality of life (QoL) compared with dialysis [1, 2]. However, QoL often remains suboptimal, as there is still a substantial burden of disease [3].
In patients with ESKD, cognitive impairments are frequently present, with attention, memory and executive functioning as the most affected domains [4–6]. Studies suggest that cognitive functioning improves with kidney transplantation compared with dialysis; however, most of these studies only focused on neuropsychological test performance in the first months after transplantation [7–10]. To our knowledge, only three studies have evaluated cognitive functioning a few years after kidney transplantation. Results are ambiguous; some studies found evidence for cognitive deficits at on average 5–7 years after kidney transplantation [11, 12], while others do not [13]. Importantly, all these studies compared results of patients with normative means, rather than with a matched healthy control (HC) group.
Impairments in cognitive functions can result in patients experiencing problems in everyday life situations. Cognitive impairments could therefore result in decreased self-management capacities, which are necessary for maintaining good overall health and well-being. Adherence to medication prescriptions and doctors’ recommendations, timely communication of medical problems with healthcare professionals and adopting a healthy lifestyle all depend on these self-management capacities. In current clinical practice, the potential presence of cognitive deficits in KTR is usually not evaluated. As a consequence, the impact of cognitive deficits on social participation and QoL in KTR is unknown.
Regarding the cause of cognitive impairments in KTR, there are multiple disease factors that may influence cognition post-transplantation. Several studies have shown a significant association between lower rates of estimated glomerular filtration rate (eGFR) and cognitive impairment in patients with chronic kidney disease [4, 6, 14]. However, the impact of eGFR in KTR is uncertain. Troen et al. [12] found that worse kidney function was associated with worse executive functioning in KTR, whereas others [15] did not find an association between eGFR and cognition. Further, duration of dialysis before transplantation can be considered as a potentially important predictor for cognitive impairment. Various studies have shown the negative impact of dialysis on cognitive functioning before and after transplantation [13, 16]. Cerebrovascular disease is highly prevalent in patients receiving dialysis and is significantly correlated with cognitive impairments [16]. Also, years since transplantation may affect cognitive functioning. Some studies suggest that cognitive impairments are reversible after transplantation [8–10], while other studies do not [15, 17]. To date, it is uncertain to what extent these kidney disease factors are related to cognitive functioning in the long term.
The aim of the present study was to investigate long-term cognitive functioning in KTR by comparing performances on neuropsychological tests with data of HC. Results were also analysed from a clinical perspective to indicate whether patients with lower cognitive performance met the criteria for ‘mild cognitive impairment’ (MCI), which is an internationally accepted classification for objective cognitive impairment [18]. Also, we examined the correlations between the kidney disease factors eGFR, duration of dialysis before transplantation and years since transplantation on one hand, and cognitive functioning on the other hand. Moreover, we aimed to investigate whether patients with cognitive deficits experienced more difficulties in societal participation and QoL.
MATERIALS AND METHODS
Participants
For this study, we used data from the TransplantLines Biobank & Cohort study (ClinicalTrials.gov Identifier: NCT03272841). From June 2015, all KTR (transplanted ≥1 year ago) and donors (aged ≥18 years) of the University Medical Center Groningen (UMCG, the Netherlands) were invited to participate. All participants gave written informed consent on enrollment. A detailed description of the study design, inclusion and exclusion criteria has been described previously [19]. The study protocol has been approved by the local Institutional Review Board (METc 2014/077), adheres to the UMCG Biobank Regulation, and is in accordance with the WMA Declaration of Helsinki and the Declaration of Istanbul [19].
To compare results of the patients, combined data of HC participants from two subsamples were used. HC1 (N = 55) were potential living kidney donors. HC2 data (N = 251) had been collected previously in the context of different studies at the Division of Neuropsychology, Department of Neurology, UMCG. Exclusion criteria for HC were insufficient comprehension of the Dutch language, severe neurological and psychiatric conditions or substance abuse, and age younger than 18 years.
Measurement instruments
Memory
The Digit Span Forward (Digit Span FW) measures immediate auditory memory span [20]. The participant is asked to repeat a series of numbers. The score is the total strings repeated, with a maximum of 16.
The 15 Words Test (15WT) measures verbal memory [21]. A set of 15 unrelated words is presented to the participant, consecutively over five trials. Participants are asked to recall as many words as possible immediately after each trial (Immediate Recall; IR) and after 20 min (Delayed Recall; DR). The score is the total words recalled in five trials, with a maximum of 75 (IR). For DR, the maximum score is 15.
Word Fluency is a verbal task measuring semantic memory [22]. Participants have to name as many words as possible within a certain category (i.e. animals) within 1 min, and total score is calculated.
Mental speed
Trail Making Test part A (TMT-A) measures mental speed and involves connecting 25 numbers in an ascending order, as quickly as possible [23]. Completion of the tests is timed in number of seconds.
Attention and executive functioning
Trail Making Test part B (TMT-B) is a measure of cognitive flexibility [23]. In this condition, numbers as well as letters have to be connected in an alternating ascending order (1-A-2-B- etc.). Completion of the tests is timed in number of seconds.
The Controlled Oral Word Association Test (COWAT) is a verbal task measuring executive control [24]. Participants have to name as many words as possible that start with a specific letter within 1 min, while adhering to several rules. Total score is the total words of three different starting letters (D-A-T).
The Digit Span Backward (Digit Span BW) measures working memory, which is considered an aspect of executive functioning [20]. The participant is asked to repeat a series of numbers in reversed order. The score is the total strings repeated, with a maximum of 16.
Questionnaires
The Utrecht Scale for Evaluation of Rehabilitation-Participation (USER-P) is a valid measure to rate both objective and subjective participation in everyday life [25]. The USER-P consists of 31 items concerning domestic, occupational and recreational activities. The items assess three aspects of participation:
USER-P Frequency: how much time is spent on working, studying and attending to household duties, and how often patients undertake these activities.
USER-P Restrictions: to what extent patients experience any limitations in everyday life functioning.
USER-P Satisfaction: how satisfied patients are with their life.
The sum scores are converted to scores on a 0–100 scale, with higher scores indicating better participation in everyday life. There is no USER-P total score.
The Medical Outcomes Study Short-Form 36 (SF-36) is a self-assessment measuring QoL [26]. The SF-36 consists of 36 items and contains eight subscales, specifically physical function, role limitations physical, bodily pain, vitality, general health perceptions, role limitations emotional, social function and mental health. All scores combined provide two summary scores, specifically the Physical Component Summary (SF-36 PCS) and Mental Component Summary (SF-36 MCS). Physical function, bodily pain, general health perceptions and physical effect on role function form the SF-36 PCS score, whereas mental health, social function, vitality and emotional effect on role function form the SF-36 MCS score. Higher scores indicate better QoL.
Mild cognitive impairment
Performances of KTR on neuropsychological tests were also analysed from a clinical perspective and therefore compared with normative data. The results were compared with reference groups of similar age, sex and education. Overall performance was classified as ‘MCI’ if performance on two or more neuropsychological tests falls ≤1.5 SD below corrected normative means, applying the internationally accepted criteria for objective impairment [18].
Disease-related variables
KTR characteristics that can potentially influence cognition were included. eGFR is a creatinine-based index of kidney function, which is estimated with the Chronic Kidney Disease Epidemiology Collaboration equation [27]. eGFR, years since transplantation (years since Tx), duration of dialysis before transplantation and type of immunosuppressant drugs was determined at the start of the neuropsychological assessment. The duration of the dialysis period was given in months. Also, pre-transplantation health status has been determined at the start of the neuropsychological assessment and includes medical history that may affect cognitive functioning (i.e. history of myocardial infarction, a history of cerebrovascular disease and diabetes).
Statistical analyses
SPSS version 23.0 was used for analyzing data. To examine demographic differences between KTR and HC, chi-squared tests for categorical data and Mann–Whitney U tests for ordinal data were conducted. Neuropsychological test scores were checked for normal distribution and non-parametric alternatives were applied in case of not normally distributed scores. Mean scores on the different tests were compared between KTR and HC using independent t tests and Mann–Whitney U tests. Effect sizes for group differences were calculated (Cohen's d). Effect sizes were considered ‘low’ if d < 0.5, ‘moderate’ if d = 0.5–8 and ‘large’ if d > 0.8. The overall alpha level (P) was set at 0.05, two-sided. Spearman's rho correlations were calculated to determine the relation between performance on neuropsychological tests, MCI, KTR disease-related factors, societal participation (USER-P) and QoL (SF-36); here, Bonferroni corrections were used to correct for multiple comparisons.
RESULTS
Participants
A total of 131 KTR and in total 306 HC were included. The two control groups (HC1 and HC2) were each separately compared with KTR. KTR and both HC groups were well matched: no significant differences with regard to sex, age and education were found (all P-values >0.05). Further demographics and KTR characteristics are shown in Table 1.
Participant characteristics
| KTR | HC1a | HC2b | ||||
|---|---|---|---|---|---|---|
| (n = 131) | (n = 55) | (n = 251) | ||||
| Mean (SD) | Range | Mean (SD) | Range | Mean (SD) | Range | |
| Sex, female (%) | 52 (39.7%) | 29 (52.7%) | 123 (49%) | |||
| Age (years) | 53.6 (13.5) | 19–79 | 55.9 (11.2) | 27–83 | 50.5 (15.7) | 19–84 |
| Education | 5 (1.1) | 2–7 | 5.3 (1) | 2–7 | 5 (1.3) | 2–7 |
| BMI (kg/m2) | 26.9 (4.2) | 17.7–40 | — | — | — | — |
| eGFR (mL/min/1.73 m2) | 51.4 (19.3) | 12.7–106.6 | ||||
| Time since Tx (years) | 11.2 (8.9) | 1–41.7 | ||||
| Received dialysis (%) | 56.5% | |||||
| Dialysis duration (months) | 31.6 (21.2) | 1–76 | ||||
| Type of dialysis (%) | ||||||
| Haemodialysis | 24.4% | — | — | — | — | — |
| Peritoneal dialysis | 31.3% | — | — | — | — | — |
| Unknown | 0.8% | — | — | — | — | — |
| No dialysis | 43.5% | |||||
| Immunosuppressant | ||||||
| medications (%) | ||||||
| Prednisone/prednisolone | 96.9% | — | — | — | — | — |
| Tacrolimus | 51.1% | — | — | — | — | — |
| Mycophenolate | 71% | — | — | — | — | — |
| Cyclosporine | 17.6% | — | — | — | — | — |
| Azathiprine | 13.7% | — | — | — | — | — |
| Everolimus | 3.1% | — | — | — | — | — |
| History of (%) | ||||||
| Diabetes mellitus | 14.5% | — | — | — | — | — |
| Cerebrovascular accident | 2.3% | — | — | — | — | — |
| Myocardial infarction | 3.8% | — | — | — | — | — |
| Dementia | 0% | — | — | — | — | — |
KTR, kidney transplant recipients; HC, healthy controls; education = Verhage 7-point scale ranging from 1 (primary school) to 7 (university); dialysis duration = months of dialysis before transplantation; time since Tx = time since transplantation in years.
HC1 = living kidney donors.
HC2 = data collected at the Subdepartment of Neuropsychology, UMCG.
Neuropsychological performance
Table 2 shows results of the Mann–Whitney U tests or t tests for differences in mean scores on neuropsychological tests of KTR and HC. KTR performed significantly lower than HC on most neuropsychological measures, specifically 15WT IR, Word Fluency, TMT-A, TMT-B and Letter Fluency. Effect sizes were low to moderate (Cohen's d between 0.23 and 0.70).
Comparisons of performance on neuropsychological tests of kidney transplant recipients and HCs
| KTR | HC | |||||||
|---|---|---|---|---|---|---|---|---|
| Cognitive domain | Cognitive measure | N | Mean (SD) | N | Mean (SD) | t/z | P | da |
| Memory | Digit Span FW | 131 | 8.7(2.0) | 55 | 9.2 (1.9) | z = −1.6 | 0.12 | 0.23 |
| 15WT IR | 131 | 40.6 (9.8) | 175 | 43.2 (10.2) | t = −2.2 | 0.03 | 0.26 | |
| 15WT DR | 131 | 8.8 (2.8) | 175 | 9.0 (3.0) | z = −0.8 | 0.40 | 0.10 | |
| Word Fluency | 131 | 23.2 (5.9) | 55 | 26.9 (4.7) | z = −4.5 | <0.001 | 0.69 | |
| Mental speed | TMT-A | 131 | 34.2 (12.7) | 196 | 30.9 (10.4) | z = −2 | 0.04 | 0.23 |
| Attention, executive functioning | TMT-B | 131 | 76.4 (30.2) | 196 | 66.7 (29.3) | z = −3.4 | 0.001 | 0.38 |
| Letter Fluency | 131 | 33.5 (10.4) | 164 | 41.1 (11.3) | t = −6 | <0.001 | 0.70 | |
| Digit Span BW | 131 | 7.9 (2.0) | 55 | 8.1 (1.8) | z = −0.7 | 0.44 | 0.06 | |
KTR = kidney transplant recipients; HC = healthy controls; Digit Span FW = Digit Span Forward; 15WTIR = 15 Words Test Immediate Recall; 15 WT DR = 15 Words Test Delayed Recall; TMT-A = Trail Making Test part A; TMT-B = Trail Making Test part B; Digit Span BW = Digit Span Backward.
Cohen's d, effect size.
In total, 16% of the KTR with a mean age of 55.3 years fulfilled the internationally accepted criteria for MCI, compared with 2.6% (M = 51.5 years) of the HC. The difference between the two groups is significant (P < 0.001). The mean time since transplantation for the MCI group was 13 years (SD = 9.9 years), mean eGFR 51.4 mL/min/1.73 m2 (SD = 19.3) and mean duration of dialysis before transplantation was 23.8 (SD = 25.9) months. There was no a significant correlation between either MCI and age at the start of the neuropsychological assessment (r = 0.05, P = 0.60), or MCI and disease-related factors, including time since transplantation in years (r = 0.10, P = 0.28), eGFR (r = 0.01, P = 0.92), duration of dialysis before transplantation (r = 0.12, P = 0.16) and pre-transplantation health status (r = −0.04, P = 0.68). Further, there was no significant correlation between MCI and any use of immunosuppressant drugs (tacrolimus, r = −0.15, P = 0.09, prednisone/prednisolone, r = 0.08, P = 0.38, mycophenolate, r = −0.04, P = 0.64, cyclosporine, r = 0.07, P = 0.42, azathioprine, r = 0.01, P = 0.94, everolimus, r = 0.16, P = 0.06).
Societal participation and QoL
Considering societal participation, KTR scored significantly lower on all aspects of the USER-P, respectively USER-P frequency (M = 32.9, SD = 9.7; z = −3.4, P = 0.001), USER-P restrictions (M = 87.5, SD = 16.2; z = −4.1, P < 0.001) and USER-P satisfaction (M = 77.8, SD = 14.5; z = −2.2, P = 0.03), compared with HC (respectively, M = 39.0, SD = 9.9; M = 92.5, SD = 25.1; M = 83.5, SD = 12.1). The same applies to QoL. KTR scored significantly lower on the two component scores, specifically PCS (M = 69.4, SD = 22.2; z = −7.6, P < 0.001) and MCS (M = 77.3, SD = 17.0; z = −5.1, P < 0.001), compared with HC (PCS; M = 90.7, SD = 10.4, MCS; M = 88.6, SD = 8.7).
Table 3 shows Spearman's rho correlations between performance on neuropsychological tests and measures for societal participation and QoL. All measures for societal participation correlated significantly, moderate to strong, with Word Fluency, TMT-A and TMT-B. This indicates a relation between reduced societal participation and poor performance on tests for semantic memory, mental speed and cognitive flexibility.
Spearman's rho correlations between neuropsychological test performance and everyday life participation and quality of life in kidney transplant recipients
| USER-P | SF-36 | |||||
|---|---|---|---|---|---|---|
| Cognitive domain | Cognitive measure | Frequency (n = 128) | Restrictions (n = 120) | Satisfaction (n = 126) | PCS (n = 131) | MCS (n = 131) |
| Memory | Digit Span FW | 0.13 | 0.19 | 0.13 | 0.03 | −0.04 |
| 15WT IR | 0.32a | 0.13 | 0.17 | 0.05 | 0.05 | |
| 15WT DR | 0.24a | 0.01 | 0.02 | −0.02 | 0.01 | |
| Word Fluency | 0.33a | 0.26a | 0.29a | 0.21 | 0.27a | |
| Mental speed | TMT-A | −0.34a | −0.31a | −0.34a | −0.32a | −0.21 |
| Attention, executive functioning | TMT-B | −0.40a | −0.32a | −0.24a | −0.28a | −0.25a |
| Letter Fluency | 0.38a | 0.22 | 0.18 | 0.13 | 0.1 | |
| Digit Span BW | 0.19 | 0.22 | 0.18 | 0.07 | 0.05 | |
USER-P = Utrecht Scale for Evaluation of Rehabilitation—Participation; SF-36 = Medical Outcomes Study Short-From 36; PCS = Physical Component Score (physical function, role limitations—physical, bodily pain, general health); MCS = Mental Component Score (social function, role limitation—emotional, mental health, vitality); Digit Span FW = Digit Span Forward; 15WT IR = 15 Words Test Immediate Recall; 15 WT DR = 15 Words Test Delayed Recall; TMT-A = Trail Making Test part A; TMT-B = Trail Making Test part B; Digit Span BW = Digit Span Backward.
Significant after adjusted alpha
Significant according to adjusted P < 0.0125.
Further, USER-P frequency correlated significantly, moderately to strongly, with 15WT IR and 15WT DR; reduced frequencies of everyday life activities were related with poorer verbal memory. With regard to QoL, both measures, PCS and MCS, correlated significantly and moderately with TMT-B, indicating a relation between reduced physical and mental QoL and reduced cognitive flexibility. PCS correlated significantly and strongly with TMT-A. This indicates a relation between reduced physical QoL and slower mental speed. Also, MCS correlated significantly and moderately with Word Fluency; reduced mental QoL is related to poorer performance on semantic memory measures.
DISCUSSION
The main objective of the present study was to examine neurocognitive functioning of KTR in the long term (on average 11 years) after transplantation and to investigate whether cognitive impairments were related to KTR disease-related factors, lower societal participation and lower QoL. Our results showed that compared with HC, KTR ‘patients’ scored significantly lower in all measured cognitive domains, i.e. memory, mental speed, attention and executive functioning. Moreover, compared with normative data, a substantial proportion of KTR (16%) scored 1.5 SD below corrected normative means on two or more neuropsychological tests and therefore met the criteria for MCI, which was a significantly higher proportion than in the HC (2.6%). Also, we found no significant relation between MCI and age or between MCI and KTR disease-related variables such as time since transplantation, duration of dialysis before transplantation, eGFR, pre-transplant health status and immunosuppressant drugs. Furthermore, societal participation and QoL were reduced in KTR, with poor neuropsychological performances related to lower levels of participation and QoL. As far as we know, this is the first study to show such a relation between cognitive deficits in societal participation and QoL in KTR in the chronic stage post-transplantation.
Our study showed that KTR in the chronic stage post-transplantation (1–41.7 years after transplantation) were impaired in multiple cognitive domains compared with HC: memory, mental speed, attention and executive functions. Previous research in KTR has mainly focused on cognitive functioning in the first months after transplantation [10, 15, 17, 28]. Some studies found that cognitive deficits may recover after transplantation to a level comparable to pre-transplantation [8–10]. Although in the present study comparison with cognitive performance in an early stage post-transplantation was not possible, the fact that we found no significant relationship between time since transplantation and the presence of neuropsychological deficits suggests that cognitive impairments in KTR are relatively stable.
Our study showed that almost one-sixth of the KTR, with a mean age of 55 years, met the criteria for MCI. In a prior study in KTR, a conversion over time to dementia was found for 17% of these patients [29]. Given that there are multiple risk factors for cognitive impairments that may occur in patients with a kidney disease, such as hypertension, diabetes and vascular damage, we could not unravel the exact cause of cognitive impairments in our patient group of KTR that met the criteria for MCI. However, we analysed a specific set of KTR disease-related factors, i.e. eGFR, duration of dialysis before transplantation, years since transplantation, immunosuppressant drugs and pre-transplant health status, in order to find out to what extent these were related to MCI, as overall measure for cognitive impairment. Our results show no significant correlations between MCI and KTR disease-related factors. Previous research regarding kidney function shows no direct effect of reduced kidney function on cognitive impairments [15]. As for duration of dialysis before transplantation, no significant relation has been found with MCI. Although the prevalence of cognitive impairments in patients receiving dialysis has been previously reported [30, 31], the effects of dialysis in KTR with regard to cognitive functioning has shown mixed results [8, 10, 30, 32]. Previous studies have found improvements in cognitive functioning after patients stopped receiving dialysis and received their transplantation, suggesting that preexisting cognitive impairments are reversible after transplantation [10–12]. However, our results show no significant relation between time since transplantation and the group that met the criteria for MCI. Therefore, our findings imply that the cognitive impairments at on average 11 years after transplantation can be considered as stable and are highly unlikely to have recovered compared with early stages post-transplantation.
The second aim of our study was to examine to what extent cognitive deficits were related with societal participation and QoL. Concerning participation, our results showed significant correlations between lower scores on neurocognitive tasks measuring memory, mental speed, attention and executive functions, and reductions in different aspects of societal participation. This implies that cognitively impaired KTR are likely to encounter difficulties with fulfilling social and vocational roles and with undertaking activities, as well as to experience lower satisfaction with their participation in life. This is the first study to demonstrate such a relationship. Previous research has mainly focused on examining to what extent cognitive functioning is affected after kidney transplantation [5, 33], without investigating the possible consequences. Apparently, successfully receiving a kidney transplant does not imply that patients are able to resume their previous level of social functioning and can return to their premorbid role in the community. Our findings suggest that the absence of cognitive impairment, indicating brain health, may be a decisive factor in societal participation and QoL in KTR.
As for QoL, significant correlations were found between reduced QoL and lower scores on neurocognitive tasks measuring memory, mental speed, attention and executive functions. This suggests that cognitively impaired KTR may experience lower QoL. A few studies examined QoL in KTR [3, 34–36]; however, to date, we are the first to link the presence of cognitive deficits with QoL in KTR. The results of our study show that cognitive functioning is important to QoL in KTR. As such, identifying strategies that can improve cognition in KRT should be a priority in the rehabilitation process. Therefore, it is imperative to identify patients with cognitive impairment in a timely fashion via a neuropsychological assessment, given their risk of lower participation and QoL.
There are some limitations to this study. First, due to the design of our study, cognitive measures from pre-transplantation and from the subacute stage post-transplantation were not examined. As a result, the time course of cognitive functioning is unknown. Our findings suggest that cognitive functioning can be considered as stable in the post-transplantation phase. However, longitudinal data, preferably starting measurement of cognition already before transplantation, are necessary to confirm whether this is indeed the case. Furthermore, for KTR, the exact disease duration was not reported in this study. The possible influence of disease duration on test performance could therefore not be analysed.
In conclusion, cognitive deficits were found in KTR patients in the chronic phase after transplantation. Moreover, 16% of the KTR met the criteria for MCI. Despite the relevance for everyday life functioning and well-being of patients, cognitive functions are not assessed routinely after kidney transplantation. Administering neuropsychological assessment in KTR could allow timely counselling or treatment regarding cognitive impairment. Moreover, more attention, preferably starting before transplantation, but most certainly in the rehabilitation process, should be paid to restrictions in social participation and QoL.
ACKNOWLEDGEMENTS
We thank all the participants and all members of the TransplantLines Biobank & Cohort Study for their support and effort.
FUNDING
No funding was received for this research.
AUTHORS’ CONTRIBUTIONS
A.L.Z. conducted the study for transplant recipients, analysed the data, wrote the manuscript and was responsible for final content of the manuscript. J.M.S. and A.M.B. designed the cognitive study and contributed to the analysis of the results and to the writing of the manuscript. J.M.S and T.V. provided the HC data. L.S., M.F.E, A.W.G.N, C.A., G.J.N. and S.P.B. provided input from their field of knowledge when designing the study and revised the manuscript. S.J.L.B. designed the study and was the principal investigator and project leader of TransplantLines. All collaborators revised the manuscript and approved the final version of the manuscript.
CONFLICT OF INTEREST STATEMENT
None declared.


Comments