


ABSTRACT
Immunosuppression in kidney transplant recipients with decreased graft function and histological vascular changes can be particularly challenging. The impact of a late rescue conversion to belatacept on kidney graft survival in this context has never been studied.
We report a bicentric retrospective cohort study comparing a calcineurin inhibitor (CNI) to belatacept switch versus CNI continuation in 139 kidney transplant recipients with histological kidney vascular damage (cv ≥2, g + cpt ≤1, i + t ≤1) and low estimated glomerular filtration rate (≤40 mL/min/1.73 m²). Primary outcome was death-censored graft survival.
During the study follow-up, 10 graft losses (14.5%) occurred in the belatacept group (n = 69) versus 26 (37.1%) in the matched CNI group (n = 70) (P = .005). Death-censored graft survival was significantly higher in the belatacept group (P = .001). At 3 years, graft survival was 84.0% in the belatacept group compared with 65.1% in the control group. Continuing CNI was an independent risk factor for graft loss [hazard ratio (HR) 3.46; P < .005]. The incidence of cellular rejection after the conversion was low (4.3% in both groups) and not significantly different between groups (P = .84). Patients switched to belatacept developed significantly less donor-specific antibodies de novo. Belatacept was an independent risk factor for the occurrence of opportunistic infections (HR 4.84; P < .005).
The replacement of CNI with belatacept in patients with decreased allograft function and vascular lesions is associated with an improvement in graft survival and represents a valuable option in a context of organ shortage. Caution should be exercised regarding the increased risk of opportunistic infection.

What is already known about this subject?
To our knowledge, the impact of a late rescue conversion to belatacept on kidney graft survival for kidney transplant recipients with decreased graft function and histological vascular changes has never been studied.
In order to determine whether a calcineurin inhibitor (CNI)-to-belatacept conversion may improve graft survival in patients with chronic vascular lesions, we conducted a bicentric retrospective cohort study comparing the effects of CNI and CNI-to-belatacept strategies on graft function and survival.
What this study adds?
Compared with CNI continuation, late belatacept conversion in kidney transplant recipients (KTRs) with graft vascular lesions is associated with an improvement of graft survival.
The risk of acute rejection was low and not significantly increased after conversion to belatacept and occurrence of de novo donor-specific antibodies was less frequent.
Belatacept appears as an independent risk factor for developing opportunistic infections.
What impact this may have on practice or policy?
In practice, KTRs with graft vascular lesions and decreased graft function may benefit from belatacept conversion with an improvement of graft survival, leading to a delay in the time for dialysis in a context of organ shortage.
Caution should be exercised regarding the risk of opportunistic infection.
INTRODUCTION
Belatacept is an immunosuppressive drug that blocks the costimulation pathway, preventing T cell activation. With this different mechanism of action, belatacept represents an alternative to calcineurin inhibitors (CNIs) after kidney transplantation. The Belatacept Evaluation of Nephroprotection and Efficacy as First-Line Immunosuppression Trial (BENEFIT), reported by Vincenti et al. [1], demonstrates an improved estimated glomerular filtration rate (eGFR) and patient and graft survival in de novo belatacept‐treated kidney transplant recipients (KTRs) compared with cyclosporine. Although the BENEFIT–Extended Criteria Donors (BENEFIT-EXT) failed to show differences in renal allograft survival and patient survival [2], there is growing evidence that CNI to belatacept conversion is a valuable option as a rescue therapy in patients with low graft function [3–5]. Nevertheless, most of the published studies are retrospective, with no control group, and focused mainly on short-term evolution of eGFR but not on graft survival. The increase in the use of belatacept as a conversion in patients with chronic vascular lesions of the graft and reduced kidney function can be explained by two main reasons. First, transplantations of kidneys from extended criteria donors (ECDs) have increased in the context of organ shortage and an ageing population on the waiting list. Second, chronic vascular changes are particularly frequent long-term after kidney transplantation [6]. The use of belatacept avoids short-term renal hemodynamic effects of CNI linked to afferent vascular constriction and long-term CNI-induced vascular and tubulointerstitial fibrosis [7]. Therefore we hypothesized that a conversion from CNI to belatacept in selected populations will rapidly improve graft function, providing prolonged graft survival and delaying time to dialysis.
In this context we conducted a bicentric retrospective cohort study comparing the effects of CNI and CNI-to-belatacept strategies on graft function and survival in KTRs with chronic vascular lesions.
MATERIALS AND METHODS
Study design: flow charts (Fig. 1) and patients
We conducted a retrospective study in which all the KTRs who fulfilled the following eligibility criteria were included:
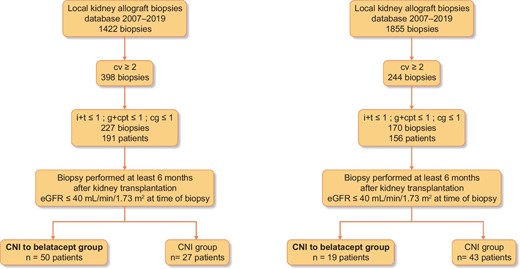
Flow charts. Banff scores: ah, arteriolar hyalinosis; cg, chronic glomerulopathy score; ci, interstitial fibrosis; ct, tubular atrophy; cv, vascular fibrous intimal thickening; g, glomerulitis score; i, interstitial inflammation; ptc, peritubular capillaritis score; v, arteritis score.
Kidney graft biopsy beyond 6 months after kidney transplantation.
Histological features from the kidney allograft biopsies database from two centers (Rouen University Hospital and Henri Mondor Hospital), including all the biopsies performed between 2007 and 2019 associating (transplant biopsies were scored according to the Banff classification [8]): a chronic vascular score (cv) ≥2, the sum of the interstitial inflammation (i) and tubulitis (t) scores (i + t) was ≤1 and the sum of the glomerulitis (g) and peritubular capillaritis (ptc) scores (g + ptc) was ≤1 and chronic glomerulopathy (cg) was ≤1.
eGFR by the Modification of Diet in Renal Disease formula (MDRD) [8] was <40 mL/min/1.73 m².
The patient was on CNI therapy at the time of biopsy.
All biopsies were performed for cause. Date of inclusion was defined as the date of kidney graft biopsy.
Local management of the patients was different between the two centers: in Rouen University Hospital, most of the KTRs included were converted to belatacept (50/77), whereas in Henri Mondor Hospital, the majority of KTRs continued CNI [43/62 (69.3%)]. Two groups were thus compared: a ‘belatacept group’ in which KTRs were converted from CNI to belatacept after the kidney biopsy and a ‘CNI group’ in which KTRs continued on CNI.
According to French law (loi Jardé), since this was an anonymous retrospective study, institutional review board approval was not required. The clinical and research activities being reported are consistent with the principles of the Declaration of Istanbul as outlined in the Declaration of Istanbul on Organ Trafficking and Transplant Tourism.
Treatment
In the CNI-to-belatacept conversion group, 5 mg/kg belatacept was administered intravenously on days 1, 15, 29, 43 and 57 and then 28 days thereafter [9]. CNIs were tapered as follows: 100% on day 1, 50% on day 2, 25% on day 15 and 0 from day 29 onwards. Other immunosuppressive medications, including corticosteroids, were maintained at existing doses unless modification was necessary. All the patients were Epstein–Barr virus (EBV) seropositive before the conversion. In the control group, CNIs were continued after graft biopsy, along with other immunosuppressive medications. Since January 2019, all patients converted to belatacept have received pneumocystis prophylaxis.
Primary outcome: death-censored graft survival
The primary endpoint was the comparison of death-censored graft survival between the two groups. We defined graft failure as a return to chronic dialysis. Causes of graft loss were reported according to the last biopsy performed or the conclusion noted in the medical charts.
Evaluation of eGFR 12 months after inclusion
We evaluated kidney graft function by eGFR (MDRD) [8] at inclusion (day 0 = date of kidney graft biopsy for the control group and date of belatacept conversion for the CNI-to-belatacept group) and 1 year (M12) after inclusion. For patients with graft loss, we considered eGFR as 5 mL/min/1.73 m².
Patient survival
Deaths, causes of death and a comparison of patient survival between the two groups were reported.
Opportunistic infections (OPIs)
We considered OPIs as described by Fishman in 2007 [10]: pneumocystis pneumonia; infection with herpesviruses (herpes simplex virus, varicella zoster virus, cytomegalovirus (CMV), EBV and others); infection with listeria, nocardia, toxoplasma, strongyloides, leishmania or Trypanosoma cruzi; polyomavirus BK nephropathy; Cryptococcus neoformans infection; Mycobacterium tuberculosis or atypical mycobacteria infection; infection with aspergillus, atypical moulds or mucorspecies; and infection with nocardia and JC polyomavirus (progressive multifocal leukoencephalopathy). CMV disease was defined [11] as evidence of CMV replication [with virus isolation or detection of viral proteins (antigens) or nucleic acid in any body fluid or tissue specimen] associated with attributable symptoms. CMV disease was further categorized as a viral syndrome (i.e. fever, malaise, leukopenia and/or thrombocytopenia) or as tissue-invasive (end organ) disease. Pneumocystis pneumonia was defined as the association of clinical and radiological presentation and the finding of Pneumocystis jirovecii, or the positivity of polymerase chain reaction, in the bronchoalveolar lavage.
Safety profile
The safety profile was reported in the two groups, including biopsy-confirmed acute rejection (AR), de novo DSA occurrence [determined with a single-antigen beads assay (One Lambda, West Hills, CA, USA) and considered positive if mean fluorescence intensity was >1000] and cancer diagnosis.
Statistical methods
Quantitative data were presented as mean [standard deviation (SD)] or median [interquartile range (IQR)] when data were not normally distributed. Qualitative data were presented as percentages. The nonparametric Wilcoxon (quantitative data) and Mann–Whitney tests (qualitative data) were used to compare baseline characteristics and mean eGFR observed during the follow-up in the two groups. The Kaplan–Meier method was used to assess patient and graft survival and the log-rank test to compare the groups (P < .05 was considered statistically significant). Univariate and multivariable Cox regression analyses were performed to determine independent covariates associated with graft loss and OPIs. These covariates included the following for graft loss: age, gender, donor type (living donor or deceased donor), ECD, eGFR on day 0, transplant department, interval between biopsy, tacrolimus before switch or biopsy, mycophenolate mofetil (MMF) before switch or biopsy, azathioprine (AZA) before switch or biopsy, steroids before switch or biopsy, MMF after switch or biopsy, AZA after switch or biopsy, steroids after switch or biopsy, Banff scores (g, ptc, i, t, ci, ct cv, cg, ah), belatacept use, OPI after switch or biopsy, cancer after switch or biopsy and rejection after switch or biopsy. These covariates included the following for OPI: age, gender, ECD, eGFR on day 0, transplant department, interval between biopsy, tacrolimus before switch or biopsy, MMF before switch or biopsy, steroids before switch or biopsy, MMF after switch or biopsy, steroids after switch or biopsy, belatacept use, cancer after switch or biopsy and rejection after switch or biopsy. All factors with P < .1 in the univariate analysis were included in the multivariate model. P < .05 was considered statistically significant in the multivariate model. Results were presented as a hazard ratio (HR) and a 95% confidence interval (CI). For the Cox models, we checked the validity of the proportional hazards assumption using scaled Schoenfeld versus time graph for each variable. There was no violation of the proportional hazards assumption (Supplementary data, Figure S1). We tested the interaction between the variables of the final model using a parameter covariance matrix to show how much each parameter is correlated with an other parameter (Supplementary data, Figure S2). All analyses were performed using StatView version 5.0 (SAS Institute, Cary, NC, USA) and GraphPad Prism version 8.0 (GraphPad Software, San Diego, CA, USA).
RESULTS
Baseline characteristics
During the study period, 69 KTRs were in the belatacept group and 70 in the CNI group. The baseline characteristics of these patients are presented in Table 1. In the CNI group, after the biopsy, patients remained on tacrolimus therapy [65.7%; median through level: 5.6 ng/mL (IQR 4.4–6.8)] or cyclosporine therapy [34.3%; median through level: 110 ng/mL (IQR 84–132)]. There was no statistical difference between these two groups at the time of inclusion except for the proportion of patients on MMF.
Baseline characteristics at the time of inclusion
| Characteristics | CNI group (n = 70) | Belatacept group (n = 69) | P-value |
|---|---|---|---|
| M/F, n (%) | 41 (58.6)/29 (41.4) | 45 (65.2)/24 (34.8) | .42 |
| Age (years), mean ± SD | 58.0 ± 13.3 | 61.7 ± 11.1 | .11 |
| eGFR (mL/min/1.73 m²) mean ± SD | 27.7 ± 8.1 | 25.3 ± 6.1 | .03 |
| ECD, n (%) LKD, n (%) Donor age (years), median (IQR) | 41 (58.6) 4 (5.7) 64.5 (52.5–70) | 47 (68.1) 2 (2.9) 64 (58.5–70) | .24 .41 .64 |
| Tacrolimus, n (%) | 46 (65.7) | 42 (60.9) | .55 |
| Cyclosporine, n (%) | 24 (34.3) | 27 (39.1) | .55 |
| IT associated before conversion or biopsy, n (%) | |||
MMF AZA mTOR-I Steroids | 49 (70) 8 (11.4) 6 (8.6) 54 (77.1) | 60 (87) 3 (4.3) 3 (4.3) 44 (63.8) | .01 .12 .31 .08 |
| IT associated after conversion or biopsy, n (%) | |||
MMF AZA mTOR-I Steroids | 49 (70) 8 (11.4) 3 (4.3) 50 (71.4) | 59 (85.5) 4 (5.8) 1 (1.4) 42 (60.9) | .01 .12 .31 .08 |
| Interval between biopsy and kidney transplantation (months), mean ± SD | 34.6 ± 32.6 | 37.9 ± 42.2 | .35 |
| Follow-up (months), mean ± SD | 33.4 ± 28.3 | 33.8 ± 22.3 | .52 |
Bold values are statistically significant result. M/F: male/female; LKD: living kidney donor; IT: immunosuppressive therapy; mTOR-I: mammalian target of rapamycin inhibitor.
The histological features of graft biopsies are reported in Table 2. There was no diagnosis of chronic antibody-mediated rejection at baseline.
Histological patients’ characteristics at time of inclusion
| Banff score | cg | ci | ct | cv | ah | ptc | t | i | g | v |
|---|---|---|---|---|---|---|---|---|---|---|
| CNI group (n = 70) | ||||||||||
| 0 | 64 (91.4) | 2 (2.9) | 6 (8.6) | 0 (0) | 17 (24.3) | 68 (97.1) | 62 (88.6) | 63 (90) | 64 (91.4) | 70 (100) |
| 1 | 6 (8.6) | 26 (37.1) | 43 (61.4) | 0 (0) | 25 (35.7) | 2 (2.9) | 8 (11.4) | 7 (10) | 6 (8.6) | 0 (0) |
| 2 | 0 (0) | 27 (36.6) | 11 (15.7) | 45 (64.3) | 17 (24.3) | 0 (0) | 0 (0) | 0 (0) | 0 (0) | 0 (0) |
| 3 | 0 (0) | 15 (21.4) | 10 (14.3) | 25 (35.7) | 11 (15.7) | 0 (0) | 0 (0) | 0 (0) | 0 (0) | 0 (0) |
| Median (IQR) | 0 | 2 | 1 | 2 | 1 | 0 | 0 | 0 | 0 | 0 |
| Belatacept group (n = 69) | ||||||||||
| 0 | 66 (95.6) | 2 (2.9) | 8 (11.6) | 0 (0) | 12 (17.4) | 64 (92.8) | 66 (95.7) | 63 (91.3) | 62 (89.9) | 69 (100) |
| 1 | 3 (4.4) | 23 (33.3) | 35 (50.7) | 0 (0) | 28 (40.6) | 5 (7.2) | 3 (4.3) | 6 (8.7) | 7 (10.1) | 0 (0) |
| 2 | 0 (0) | 33 (47.8) | 17 (24.6) | 45 (65.2) | 12 (17.4) | 0 (0) | 0 (0) | 0 (0) | 0 (0) | 0 (0) |
| 3 | 0 (0) | 11 (16.0) | 9 (13.1) | 24 (34.8) | 17 (24.6) | 0 (0) | 0 (0) | 0 (0) | 0 (0) | 0 (0) |
| Median (IQR) | 0 (0–0) | 2 (1–2) | 1 (1–2) | 2 (2–3) | 1 (0.75–2) | 0 (0–0) | 0 (0–0) | 0 (0–0) | 0 (0–0) | 0 (0–0) |
| P-value* | .66 | .96 | .72 | .92 | .36 | .65 | .47 | .89 | .87 | .99 |
Banff scores: ah, arteriolar hyalinosis; cg, chronic glomerulopathy; ci, interstitial fibrosis; ct, tubular atrophy; cv, vascular fibrous intimal thickening; g, glomerulitis score; i, interstitial inflammation; ptc, peritubular capillaritis score; v, arteritis score.
Primary outcome: death-censored graft survival
After a median follow-up of 26.6 months (IQR 13.9–46.9) in the CNI group and 26.3 months (IQR 16.2–51.8) in the belatacept group, we observed 36 graft losses, 26/70 (37.1%) in the CNI group and 10/69 (14.5%) in the belatacept group (P = .005). Causes of graft loss in the CNI group were secondary to chronic vascular and/or interstitial lesions in the graft in 15 cases, due to de novo DSA chronic active humoral rejection in 7 cases, following an acute T cell–mediated rejection in 3 cases and secondary to an acute pyelonephritis with abscess in 1 case. Causes of graft loss in the belatacept group were secondary to chronic vascular and/or interstitial lesions in the graft in eight cases and after a belatacept discontinuation for severe infectious adverse event in four cases, in one case following an acute T cell–mediated rejection, in one case secondary to a mixed cellular and preformed DSA humoral rejection with tacrolimus conversion.
Death-censored graft survival was statistically superior in the belatacept group [HR 2.66 (95% CI 1.31–4.84); P = .005] (Figure 2). After 3 years, graft survival was 84.0% in the belatacept group compared with 65.1% in the control group. In multivariate analysis (Table 2), the two independent factors associated with graft loss were CNI versus belatacept treatment and eGFR at inclusion.
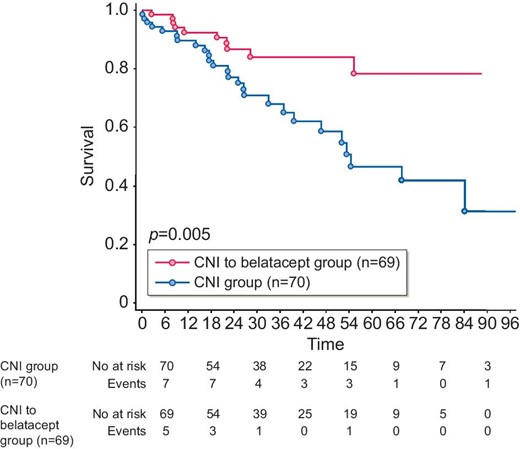
Death-censored graft survival. The Kaplan–Meier method was used to assess graft survival from the time of inclusion. P-value measured is from the logrank test. X-axis: months postinclusion.
Evolution of eGFR 12 months after inclusion
In the belatacept group, eGFR improved significantly after the conversion from 25.5 ± 6.1 to 28.6 ± 9.6 mL/min/1.73 m² (P = .003), whereas eGFR significantly decreased in the control group from 27.7 ± 8.1 to 25.5 ± 12.5 mL/min/1.73 m² (P = .01) (Table 4A). The increase of eGFR was more pronounced in the belatacept group after exclusion of patients with graft loss during the first year of follow-up (Table 4B).
Patient survival
During the follow-up, 21 patients died, 11/70 (15.7%) in the CNI group and 10/69 (14.5%) in the belatacept group (P = .84). Patient survival was not statistically different between the two groups [HR 1.09 (95% CI 0.49–2.38); P = .75] (Figure 3). Causes of death in the CNI group were cancer (four cases), major cardiovascular events (four cases), infections (two cases) and chronic respiratory insufficiency (one case). Causes of death in the belatacept group were infections (five cases), cancer (two cases), major cardiovascular events (two cases) and suicide (one case).
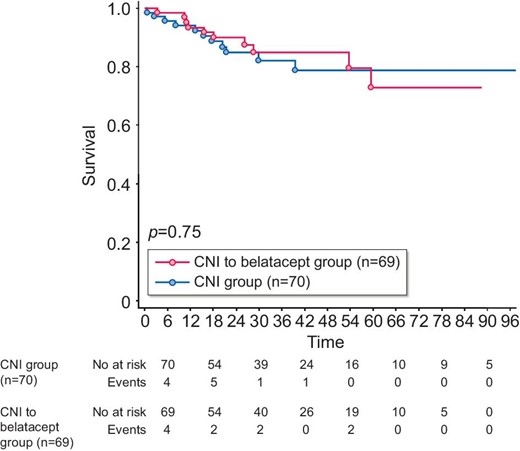
Patient survival. The Kaplan–Meier method was used to assess survival from the time of inclusion. P-value measured is from the logrank test. x-axis: months postinclusion.
Belatacept discontinuation
During the follow-up, belatacept was stopped in 20 KTRs (28.9%) after a median of 12.7 months of treatment (IQR 8.6–26.8). In 15 cases (75%), kidney graft function was preserved at the time of discontinuation. Causes of belatacept discontinuation were graft loss in four cases (20%); acute rejection in two cases (10%); an infectious event in seven cases (35%), of which six were OPIs; cancer in five cases (25%) and 2 for other reasons (one KTR retransplanted and one for deterioration of general condition).
OPIs
During the study period, KTRs in the CNI group presented 2 OPIs (2.9%) and patients in the belatacept group had 14 OPIs (20.3%) (P = .002) (Table 3). The incidences of OPIs are depicted in Fig. 4. The latter was significantly more important in the belatacept group compared with the CNI group (P = .005). The multivariate analysis reported in Table 4 pointed to belatacept conversion and age as independent risk factors associated with the occurrence of OPIs.
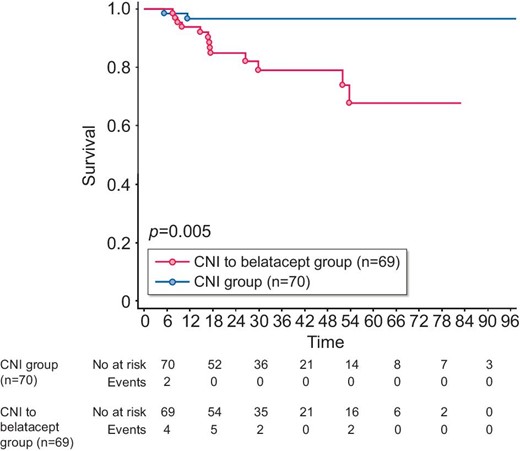
Opportunistic infection-free survival. The Kaplan–Meier method was used to assess OPI-free survival from the time of inclusion. P-value measured is from the logrank test. X-axis: months postinclusion.
Univariate and multivariate Cox analysis for determining factors associated with death-censored graft survival
| Variables | HR | 95% CI | P-value | HR | 95% CI | P-value |
|---|---|---|---|---|---|---|
| Age | 0.99 | 0.97–1.02 | .76 | |||
| Female | 1.26 | 0.65–2.44 | .49 | |||
| Deceased donor | 1.80 | 0.24–13.2 | .56 | |||
| ECD | 0.96 | 0.49–1.89 | .90 | |||
| eGFR on day 0 | 0.89 | 0.84–0.94 | <.0001 | 0.89 | 0.84–0.94 | <.0001 |
| Transplant department | 1.5 | 0.78–2.91 | .22 | |||
| Interval between biopsy and kidney transplantation | 1.01 | 0.99–1.02 | .67 | 1005 | 0.99–1.02 | .26 |
| Tacrolimus before switch or biopsy | 1.53 | 0.75–3.16 | .24 | |||
| MMF before switch or biopsy | 0.56 | 0.26–1.21 | .14 | |||
| AZA before switch or biopsy | 2.7 | 1.04–7.1 | .04 | 1.08 | 0.29–4.07 | .91 |
| Steroids before switch or biopsy | 1.59 | 0.75–3.39 | .23 | |||
| MMF after switch or biopsy | 0.52 | 0.25–1.09 | .08 | 0.54 | 0.20–1.47 | .23 |
| AZA after switch or biopsy | 2.12 | 0.74–6.16 | .16 | |||
| Steroids after switch or biopsy | 1.16 | 0.56–2.23 | .76 | |||
| g | 1.76 | 0.62–5.02 | .29 | |||
| ptc | 1.64 | 0.50–5.36 | .41 | |||
| i | 1.76 | 0.73–4.25 | .21 | |||
| t | 0.75 | 0.18–3.14 | .69 | |||
| ci | 1.31 | 0.85–2.01 | .21 | |||
| ct | 1.40 | 0.96–2.04 | .07 | 1.06 | 0.70–1.61 | .78 |
| cg | 3.56 | 1.14–8.59 | .0005 | 1.01 | 0.35–2.95 | .98 |
| cv | 1.88 | 0.96–3.67 | 0,06 | 1.75 | 0.87–3.53 | .12 |
| ah | 1.17 | 0.84–1.65 | .35 | |||
| No belatacept switch | 2.69 | 1.29–5.59 | .0008 | 3.46 | 1.60–7.48 | .0016 |
| OPI after switch or biopsy | 1.17 | 0.56–2.43 | .67 | |||
| Cancer after switch or biopsy | 0.33 | 0.08–1.41 | .15 | |||
| Rejection after switch or biopsy | 1.55 | 0.59–4.01 | .37 |
Bold values are independent risk factors for death-censored graft survival. Italicized values are statistically significant result in univariate analysis. Banff scores: ah, arteriolar hyalinosis; cg, chronic glomerulopathy score; ci, interstitial fibrosis; ct, tubular atrophy; cv, vascular fibrous intimal thickening; g, glomerulitis score; i, interstitial inflammation; ptc, peritubular capillaritis score; v, arteritis score.
eGFR evolution (MDRD, mL/min/1.73 m2): evaluation 12 months after inclusion
| Study population | MDRD M0 | MDRD M12 | P-value | Change in M0–M12 |
|---|---|---|---|---|
| Entire study population | ||||
| CNI group (n = 68) | 27.7 ± 8.1 | 25.5 ± 12.5 | P = .01 | –2.2 ± 7.2 |
| CNI to belatacept group (n = 64) | 25.5 ± 6.1 | 28.6 ± 9.6 | P = .0003 | +3.2 ± 8.4 |
| P = .05 | P = .15 | P < .0001 | ||
| Study population after exclusion of patients with graft loss between M0 and M12 | ||||
| CNI group (n = 60) | 29.2 ± 7.3 | 28.2 ± 10.7 | P = .0281 | 0.9 ± 6.6 |
| CNI to belatacept group (n = 60) | 25.7 ± 6.1 | 30.2 ± 79.6 | P < .0001 | +4.6 ± 6.3 |
| P = .0004 | P = .31 | P < .0001 | ||
Characteristics of OPIs during the follow-up
| Characteristics | CNI group (n = 70) | Belatacept group (n = 69) | P-value |
|---|---|---|---|
| Cumulative months of treatment exposure | 2343 | 2200 | |
| Pneumocystis pneumonia, n (%) | 0 (0) | 4 (5.8) | .04 |
| Cryptococcus neoformans infection n (%) | 0 (0) | 1 (1.4) | .31 |
| Aspergillosis, n (%) | 0 (0) | 1 (1.4) | .31 |
| Varicella zoster, n (%) | 1 (1.4) | 5 (7.2) | .07 |
| EBV-positive PTLD, n (%) | 1 (1.4) | 0 | .43 |
| CMV disease, n (%) | 0 (0) | 3 (4.3) | .08 |
| Total OPIs, n (%) OPIs/month of exposure OPI/100 person-years | 2 (2.9) .0001 1.0 | 14 (20.3) .0006 7.6 | .0002 |
| OPI related deaths, n (%) | 1 (1.4) | 3 (4.3) | .10 |
PTLD: posttransplant lymphoproliferative disease.
Univariate and multivariate Cox analysis for determining factors associated with OPIs
| Varaibles | HR | 95% CI | P-value | HR | 95% CI | P-value |
|---|---|---|---|---|---|---|
| Age | 1.08 | 1.02–1.14 | .01 | 1.08 | 1.01–1.14 | .02 |
| Female | 2.08 | 0.76–5.76 | .15 | |||
| ECD | 1.13 | 0.40–3.20 | .82 | |||
| eGFR on day 0 | 0.94 | 0.87–1.01 | .09 | 0.94 | 0.86–1.03 | .15 |
| Transplant department | 1.15 | 0.41–3.25 | .79 | |||
| Interval between biopsy and kidney transplantation | 1.01 | 0.99–1.02 | .14 | |||
| Tacrolimus before switch or biopsy | 0.48 | 0.17–1.33 | .16 | |||
| MMF before switch or biopsy | 0.87 | 0.24–3.07 | .82 | |||
| Steroids before switch or biopsy | 2.12 | 0.60–7.53 | .24 | |||
| MMF after switch or biopsy | 1.50 | 0.34–6.67 | .59 | |||
| Steroids after switch or biopsy | 1.51 | 0.56–2.23 | .48 | |||
| Belatacept switch | 6.31 | 1.42–27.95 | .01 | 4.84 | 1.09–21.51 | .04 |
| Rejection after switch or biopsy | 1.50 | 0.34–6.71 | .59 | |||
| Cancer after switch or biopsy | 2.48 | 0.79–7.80 | .12 |
Bold values are independent risk factors for opportunistic infections. Italicized values are statistically significant result in univariate analysis.
T cell–mediated rejection and DSA de novo occurrence
In the belatacept group, three patients (4.3%) experienced a biopsy-proven T cell–mediated rejection with acute renal failure early after the conversion (1.5, 1.6 and 2.1 months). Graft biopsies revealed one grade Ib, one grade IIa and one grade IIb rejections according to the Banff classification. One patient lost his graft after the rejection, despite intravenous steroid therapy and antithymocyte globulins, while the other patients recovered with steroids and belatacept continuation. In the CNI group, three (4.3%) KTRs had a grade Ia biopsy-proven cellular rejection associated with a de novo DSA chronic active antibody-mediated rejection (ABMR) during the follow-up (6.3, 34 and 56 months after the inclusion). The incidence of cellular rejection after the conversion was not significantly different between groups (P = .84).
In addition, one patient (1.4%) presented a mixed rejection (grade Ia T cell-mediated rejection + preformed chronic active ABMR) in the belatacept group and two patients (2.9%) had an active ABMR in the CNI group. Only one patient in the belatacept group had a DSA before the conversion and none in the CNI group. Patients converted to belatacept developed significantly less de novo DSA compared with the CNI group [5/68 (7.4%) in the belatacept group versus 15/64 (23.4%) in the CNI group; P = .01].
Cancer occurrence
The occurrence of cancer in the two groups is reported in Table 7. There was no statistical difference between the groups. A single case of EBV-induced post-transplant lymphoproliferative disease was reported during follow-up, in the CNI group.
Characteristics of cancer during the follow-up
| Characteristics | CNI group (n = 70) | Belatacept group (n = 69) | P-value |
|---|---|---|---|
| Cutaneous squamous cell carcinoma, n (%) | 4 (5.7) | 3 (4.3) | .64 |
| Pancreatic adenocarcinoma, n (%) | 0 (0) | 3 (4.3) | .08 |
| Bronchial adenocarcinoma, n (%) | 1 (1.4) | 1 (1.4) | .98 |
| Prostatic adenocarcinoma, n (%) | 0 | 1 (1.4) | .39 |
| Colonic adenocarcinoma, n (%) | 1 (1.4) | 0 | .43 |
| Bladder cancer, n (%) | 0 | 1 (1.4) | .39 |
| EBV-positive PTLD, n (%) | 1 (1.4) | 0 | .43 |
| Kaposi sarcoma, (%) | 1 (1.4) | 0 | .43 |
| Noncutaneaous cancer, n (%) | 4 (5.7) | 6 (8.7) | .49 |
| Total cancer, n (%) | 8 (11.4) | 9 (13.0) | .59 |
PTLD: posttransplant lymphoproliferative disease.
DISCUSSION
This study demonstrates, for the first time, an improvement in graft survival associated with a CNI-to-belatacept conversion performed as a rescue strategy in KTRs with vascular lesions. A randomized controlled study [9] was performed comparing belatacept conversion to CNI continuation in KTRs with stable graft function (eGFR 35–75 mL/min/1.73 m2). The results at 3 years post-conversion showed an improvement of eGFR but no significant effect on graft survival [12]. Similarly, most of the available studies on belatacept conversion in KTRs with precarious kidney graft function have reported an increase in eGFR after the conversion, either without [3, 4, 13, 14] (which limits interpretation) or with matched control groups [5, 15]. In the context of organ shortage, the improvement of graft survival after belatacept conversion we report here seems to be highly important, because it may afford prolonged graft survival when graft function is precarious and vascular injury severe. Our results are in line with a recently published phase 3 trial [16] that evaluated the efficacy/safety of conversion from CNI-based to belatacept-based maintenance immunosuppression in CNI-intolerant KTRs with an eGFR of 30–75 mL/min/1.73 m2. Overall, 446 renal transplant recipients were randomized to belatacept conversion (n = 223) or CNI continuation (n = 223). The 24-month eGFR was higher with belatacept than CNI (55.5 versus 48.5 mL/min/1.73 m2) but the 24-month rates of survival with graft function were 98% and 97% in the belatacept and CNI groups, respectively, which was not statistically different. This was probably due to a lack of sufficient follow-up for this outcome given the eGFR at inclusion. Earlier conversion could result in better graft survival if the eGFR is higher at the time of conversion, but this hypothesis has to be tested and proved.
BENEFIT [1] reported an improvement of patient survival in KTRs from non-ECD receiving belatacept as a de novo immunosuppressive therapy. BENEFIT-EXT [2] failed to demonstrate such a result in KTRs from ECD. In contrast, published studies on belatacept conversion did not report on patient survival after the conversion. The present study showed there was no difference in patient survival between the groups analyzed. Importantly, causes of death were different between the two groups. Indeed, in the belatacept group, the first cause of death was infectious [5/10 (50%)], whereas cardiovascular events and cancer were the leading causes in the CNI group. This observation needs to be confirmed in prospective studies, because until now, belatacept was not associated with a significant risk of major cardiovascular events reduction in KTRs at high cardiovascular risk [17]. The occurrence of OPIs was significantly greater in the belatacept group than the CNI group. Belatacept conversion as a rescue strategy is independently associated with the occurrence of OPIs in our study, which are in turn accountable for important morbidity (hospitalization, belatacept discontinuation, graft losses) and mortality. We recently reported [18, 19] a high occurrence of OPIs in this context, particularly after an early conversion in patients with very low graft function, with special attention on CMV and pneumocystis infections. Very recently, Chavarot et al. [20] reported in a large cohort of KTRs converted to belatacept a 7-fold higher incidence of CMV disease and atypical presentations compared with a matched cohort of KTRs on CNI. Thus, it might be useful to prescribe prophylaxis for CMV and pneumocystis infections in KTRs, with precarious graft function converted to belatacept, but the duration remains to be defined and guidelines are needed because of the increasing prescription of belatacept in this context. Within the follow-up reported, the risk of cancer after conversion seems to be comparable in the belatacept and CNI groups, but data in the literature are very scarce. Furthermore, we did not report a higher incidence of EBV-induced posttransplant lymphoproliferative disease, as mentioned initially in the princeps study, but in EBV seronegative KTRs.
The occurrence of T cell–mediated rejection after de novo belatacept use was a significant concern in the princeps BENEFIT [1] (17–24% at 1 year) and BENEFIT-EXT [2] (18% at 1 year) studies. In this context, some refractory allograft rejections and resistance to steroids justified being very cautious with the use of belatacept. The proportion of acute cellular rejection when belatacept is used as a conversion protocol [3, 4, 12] varies between 4.6% and 11.4% postconversion and is probably higher in early conversion (<6 months) [18, 19]. In our study, conversion was performed at least 6 months posttransplantation and we report 3/69 cases of severe T cell–mediated rejection, with acute renal failure, of which one caused graft loss. The occurrence of cellular rejection and attributable graft loss was not significantly different compared with the CNI group, in which rejection might be due to nonadherence to CNI treatment or to a medical decision to minimize exposure to CNI. Moreover, the proportion of KTRs who developed a de novo DSA was significantly lower after belatacept conversion, as reported in de novo studies [21], and the number of graft failures due to chronic ABMR was higher in the CNI group.
The retrospective nature of the study raises the concern of substantial bias. We acknowledge that some patients meet the criteria but were not transitioned to belatacept. This point is partly explained by the different strategies of belatacept conversion in the two centers: in Rouen University Hospital, most of the KTRs included were converted to belatacept (50/77), whereas in Henri Mondor Hospital, the majority of KTRs continued on CNI [43/62 (69.3%)]. Difficulty obtaining belatacept due to the absence of reimbursement of the treatment in France (2011–2019) and problems with the drug supply from the laboratory were two other potential explanations. The other limitation of our study is the relatively small number of KTRs in each group. Nevertheless, our population was very homogeneous and well phenotyped, and for the first time we compared the evolution to a control group. Future randomized studies including this particular population of KTRs is highly needed to avoid potential bias.
In summary, late belatacept conversion in KTRs with graft vascular lesions is associated with an improvement of graft survival, leading to a delay in the time for dialysis in a context of organ shortage. The risk of acute rejection was low and not significantly increased after conversion to belatacept. Nevertheless, belatacept appears as an independent risk factor for developing aggressive opportunistic infections. In light of these findings, we want to emphasize that a benefit–risk balance should be considered when converting KTRs with low graft function to belatacept. We believe that patients at high risk of OPIs, particularly based on a history of severe infections, are generally not good candidates for conversion to belatacept. If converted, prophylaxis against pneumocystis and CMV have to be started, with cautious monitoring for the other OPIs. Others studies assessing which KTRs could benefit from an improvement in graft survival have to be done in order to help clinicians determine this benefit–risk balance.
FUNDING
The authors declare no funding was received for this work.
AUTHORS’ CONTRIBUTIONS
D.B. designed the study. M.M., A. Morel, A. Moktefi and D.B. collected data. D.B. and M.M. analyzed the data and wrote the paper. All authors provided feedback and critical review.
CONFLICT OF INTEREST STATEMENT
The authors have no conflicts of interest to disclose related to the work reported here.
DATA AVAILABILITY STATEMENT
All relevant data are within the article.


Comments