


ABSTRACT
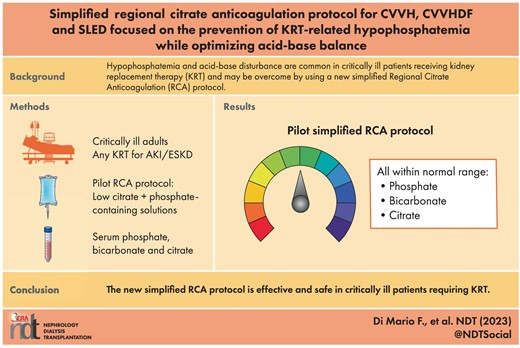
Hypophosphatemia is a common electrolyte disorder in critically ill patients undergoing prolonged kidney replacement therapy (KRT). We evaluated the efficacy and safety of a simplified regional citrate anticoagulation (RCA) protocol for continuous venovenous hemofiltration (CVVH), continuous venovenous hemodiafiltration (CVVHDF) and sustained low-efficiency dialysis filtration (SLED-f). We aimed at preventing KRT-related hypophosphatemia while optimizing acid-base equilibrium.
KRT was performed by the Prismax system (Baxter) and polyacrylonitrile AN69 filters (ST 150, 1.5 m2, Baxter), combining a 18 mmol/L pre-dilution citrate solution (Regiocit 18/0, Baxter) with a phosphate-containing solution (HPO42− 1.0 mmol/L, HCO3− 22.0 mmol/L; Biphozyl, Baxter). When needed, phosphate loss was replaced with sodium glycerophosphate pentahydrate (Glycophos™ 20 mmol/20 mL, Fresenius Kabi Norge AS, Halden, Norway). Serum citrate measurements were scheduled during each treatment. We analyzed data from three consecutive daily 8-h SLED-f sessions, as well as single 72-h CVVH or 72-h CVVHDF sessions. We used analysis of variance (ANOVA) for repeated measures to evaluate differences in variables means (i.e. serum phosphate, citrate). Because some patients received phosphate supplementation, we performed analysis of covariance (ANCOVA) for repeated measures modelling phosphate supplementation as a covariate.
Forty-seven patients with acute kidney injury (AKI) or end stage kidney disease (ESKD) requiring KRT were included [11 CVVH, 11 CVVHDF and 25 SLED-f sessions; mean Acute Physiology and Chronic Health Evaluation II (APACHE II) score 25 ± 7.0]. Interruptions for irreversible filter clotting were negligible. The overall incidence of hypophosphatemia (s-P levels <2.5 mg/dL) was 6.6%, and s-P levels were kept in the normality range irrespective of baseline values and the KRT modality. The acid-base balance was preserved, with no episode of citrate accumulation.
Our data obtained with a new simplified RCA protocol suggest that it is effective and safe for CVVH, CVVHDF and SLED, allowing to prevent KRT-related hypophosphatemia and maintain the acid-base balance without citrate accumulation.
NCT03976440 (registered 6 June 2019)
INTRODUCTION
Hypophosphatemia, commonly defined as a serum phosphate (s-P) level < 2.5 mg/dL (0.81 mmol/L), is a frequent electrolyte disorder in critically ill patients [1]. Its incidence can reach as high as 80% in patients undergoing continuous kidney replacement therapy (CKRT), especially when high dialysis doses are delivered, and standard dialysis solutions are adopted [2–5]. Also, an incidence between 20% and 30% has been reported in patients undergoing prolonged intermittent kidney replacement therapy (PIKRT), primarily depending on patients’ age, baseline s-P level and the duration of kidney replacement therapy (KRT) session [2, 6–9]. Based on the s-P level, hypophosphatemia is commonly categorized as mild (<2.5 to 1.9 mg/dL; <0.81 to 0.61 mmol/L), moderate (<1.90 to 1.0 mg/dL; <0.61 to 0.32 mmol/L) or severe (<1.0 mg/dL; <0.32 mmol/L) [10]. When patients are treated with prolonged KRT modalities, a substantial phosphate removal occurs through the effluent fluid, leading to high daily phosphate clearance [11]. Hence, given the low redistribution kinetics between the intra- and extracellular compartments, the duration of KRT represents the main determinant of phosphate clearance [12]. In patients with critical illness the reduction of s-P levels has been associated with respiratory muscle weakness and worsening respiratory failure, leading to difficult weaning from mechanical ventilation, increased risk of cardiac arrhythmias, prolonged intensive care unit (ICU) stay and death [9, 13–17]. As hypophosphatemia impacts negatively on hard patient outcomes, a great degree of attention is required to avoid the development of phosphate depletion during KRT [17]. In this regard, a safe and effective approach to overcome the risk of KRT-induced hypophosphatemia should implement strategies aimed at tailoring both dialysis prescriptions and the composition of KRT fluids. On these grounds, commercially available phosphate-containing KRT solutions have been introduced in clinical practice in the last recent years and have been successfully tested in different KRT modalities, including those performed with regional citrate anticoagulation (RCA) [16, 18–23]. However, notwithstanding the development of accurately designed and simplified RCA protocols, issues still remain regarding potential electrolyte and acid-base derangements. Indeed, 3 mmol of bicarbonate are generated for each 1 mmol of citrate by citrate metabolism into the Krebs cycle, with a relevant impact on buffer supply [24]. In fact, on one hand, mild to severe forms of metabolic acidosis may develop from impaired citrate metabolism and consequent inadequate buffer supply; on the other hand, an excessive citrate load may lead to metabolic alkalosis, especially if the citrate solution used for RCA is inappropriately combined with high bicarbonate concentrations in the dialysis/replacement fluids [24]. Unfortunately, most of the available published RCA protocols do not report patients’ serum citrate levels, and the accumulation and toxicity of citrate are excluded only by biochemical surrogates.
Thus, we performed a pilot study, which also included the measurement of serum citrate levels, to evaluate the efficacy and safety of a new RCA protocol for CKRT and PIKRT. This protocol was specifically designed to reduce the incidence of KRT-related hypophosphatemia and to optimize the acid-base balance in critically ill patients with acute kidney injury (AKI) or end-stage kidney disease (ESKD) treated in the ICU.
MATERIALS AND METHODS
Patients’ characteristics
We conducted a clinical non-interventional study on a cohort of critically ill renal patients who underwent 72-h CKRT or three consecutive PIKRT sessions with RCA at the Renal Intensive Care Unit of the Parma University Hospital between January 2019 and January 2021. Our study population included all consecutive critically ill patients aged ≥18 years with severe AKI requiring KRT according to KDIGO criteria [25], or ESKD previously on maintenance dialysis treatment (intermittent hemodialysis or peritoneal dialysis). The key inclusion criteria were (i) critical illness and (ii) AKI or ESKD requiring continuous or prolonged intermittent KRT in the ICU due to hemodynamic instability. Patients aged <18 years or with an ICU stay <72 h were excluded. Each enrolled patient participated in the study for a total of 72 h. As this was a pilot study, no control group was included. Demographic, clinical and laboratory data were extracted from the medical records and the administrative database of Parma University hospital.
Study protocols
Kidney replacement therapy (KRT) was performed with Prismax System (Baxter, Italy) machines equipped with polyacrylonitrile AN69 filters (ST 150, 1.5 m2, Baxter, Italy). Vascular access was obtained by cannulation of the internal jugular, subclavian or femoral vein with 12-Fr double lumen central venous catheters. At the discretion of the attending nephrologist, treatment modality was selected among continuous venovenous hemofiltration (CVVH), continuous venovenous hemodiafiltration (CVVHDF) or sustained low-efficiency dialysis filtration (SLED-f). Regional citrate anticoagulation was adopted as the standard anticoagulation strategy in all KRT modalities. Continuous KRT was prescribed as CVVH or CVVHDF by using a 18 mmol/L trisodium citrate solution (Regiocit 18/0, Baxter, Italy) in pre-dilution combined with calcium-free and phosphate-containing solution serving as dialysate and/or post-dilution replacement fluid (HPO42– 1.0 mmol/L, HCO3− 22.0 mmol/L; Biphozyl, Baxter, Italy) (Fig. 1A and B). Prolonged intermittent kidney replacement therapy was prescribed as 8-h SLED-f by using the same solutions combined with a standard KRT solution serving as post-dilution replacement fluid (HCO3− 32 mmol/L; Prismasol 4, Baxter, Italy) (Fig. 1C). The citrate solution flow rate was set in relation to the blood flow rate to obtain a roughly estimated target circuit citrate concentration of 2.5–3 mmol/L in plasma water and a post-filter circuit Ca2+ (c-Ca2+) <0.5 mmol/L. For CKRT the prescribed dialysis dose, corrected for pre-dilution, was 30–35 mL/kg/h; for SLED-f sessions the effluent volume was set at 100 mL/min. In each modality, calcium chloride (10%) was infused in a separate central venous line to maintain a target systemic Ca2+ (s-Ca2+) of 1.1–1.25 mmol/L. Activated coagulation time (ACT) and blood gas analysis were measured at KRT start and during each treatment session.
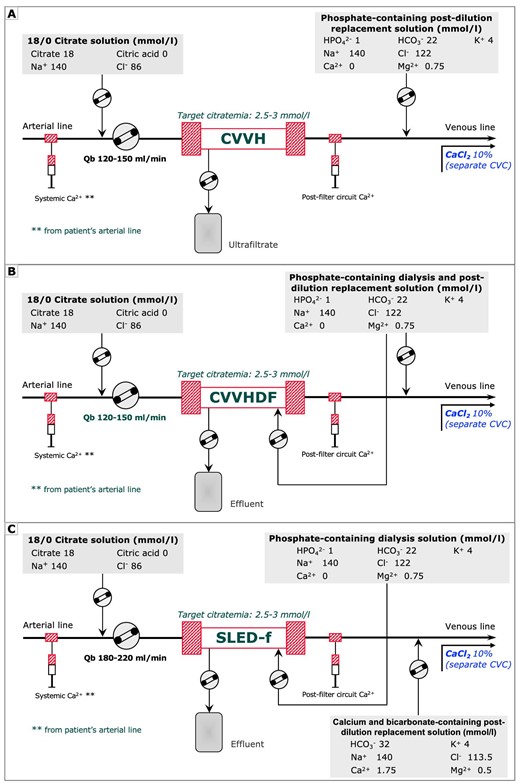
A simplified KRT circuit with RCA for CVVH, CVVHDF and SLED. The low concentration citrate solution is infused in pre-dilution in proportion to Qb, aiming at a target estimated citrate concentration in the hemofilter of 2.5–3 mmol/L. In CKRT modalities, a calcium-free and bicarbonate and phosphate containing solution acting as post-dilution (A) and/or dialysis fluid (B) was adopted and set to prescribed dialysis dose of 30–35 mL/kg/h. In PIKRT, as SLED-f, the same solution was used as dialysis fluid and combined with a standard KRT solution for post-dilution replacement fluid (C) for a prescribed effluent volume of 100 mL/min. In all KRT modalities, an infusion of calcium chloride (10% solution) in a central venous line was scheduled to maintain the systemic ionized calcium (s-Ca2+) within the normal range. Qb, blood flow rate.
A solution of trisodium citrate (3.8%) was used as the standard solution to fill each central venous catheter (CVC) lumen at the end of the dialysis session.
Nutritional support was provided by enteral or parenteral nutrition with energy and protein intake targets of 25 kcal/kg/day and 1.5–1.7 g/kg/day, respectively, and phosphorus intake of 20–30 mmol/day. Potassium, phosphate and magnesium losses with KRT were replaced, when needed, by intravenous administration of potassium chloride, sodium glycerophosphate pentahydrate (Glycophos™ 20 mmol/20 mL, Fresenius Kabi Norge AS, Halden, Norway) and magnesium sulphate, respectively. Specifically, administration of sodium glycerophosphate pentahydrate was scheduled in the case of s-P levels <2.5 mg/dL.
Detailed RCA protocols for CVVH, CVVHDF and SLED-f are reported in the Supplementary data.
Laboratory examinations
Complete laboratory workup was performed daily. A total calcium/s-Ca2+ ratio (calcium ratio) >2.5 was considered an indirect sign of citrate accumulation [26]; in addition, blood sampling for the measurement of serum citrate levels was scheduled during each KRT treatment session. Specifically, blood sampling for citrate measurement was performed at the beginning and every 2 h for the first 8 h and then every 24 h for CKRT, and at the beginning and every 2 h during SLED-f sessions. Blood samples for citrate measurement were collected at the same circuit sampling points on the arterial line, stored at –80°C and subsequently measured by commercially available ultraviolet test kits for enzymatic spectrophotometric analysis (Enzyplus EZA785+; Biocontrol Systems, Rome, Italy). Hypophosphatemia was defined as a s-P level <2.5 mg/dL (0.81 mmol/L), while hyperphosphatemia was defined as a s-P level >5.5 mg/dL (1.77 mmol/L).
Study endpoints
The primary endpoints of the study were the occurrence of hypophosphatemia, acid-base derangements (metabolic acidosis or metabolic alkalosis) and citrate accumulation during 72-h CKRT or three consecutive 8-h SLED-f sessions. The secondary endpoints were the efficacy of RCA in terms of circuit lifetime and filter efficiency, the occurrence of other electrolyte derangements (specifically calcium, sodium, potassium and magnesium) and the need for external supplementations (calcium and potassium chloride, magnesium sulphate, blood transfusion) during 72-h CKRT or three consecutive 8-h SLED-f sessions.
The study was conducted in compliance with the Declaration of Helsinki and informed consent was obtained from either the patient or a close relative. The study was approved by the local Ethics Committee (AVEN no. 3655, 22 January 2019).
Statistical analysis
Data are expressed as mean and standard deviation (SD) for continuous variables with normal distribution, or median and range for non-normally distributed data, and as frequencies for categorical variables. Normality was assessed by the Kolmogorov–Smirnov test. We used analysis of variance (ANOVA) for repeated measures to evaluate differences in variables means (i.e. serum phosphate, bicarbonate, ionized calcium, calcium chloride and citrate) between days on KRT for each dialysis modality. Because some patients received phosphate supplementation, we performed analysis of covariance (ANCOVA) for repeated measures modeling phosphate supplementation as a covariate. The effect on s-P level was also evaluated in two subgroups defined on the basis of baseline s-P (i.e. hypophosphatemia and hyperphosphatemia). As part of a safety study, serum citrate concentrations were also separately analyzed in the subgroup of patients with severe liver failure [Model for End-stage Liver Disease (MELD) score ≥25]. All analyses were performed using IBM Statistical Package for Social Sciences version 28.0 (IBM SPSS Statistics Inc., Chicago, IL, USA). Statistical significance was set at P < .05 (two-sided).
RESULTS
Forty-seven patients were treated with our new RCA protocol; 11 underwent 72-h CVVHDF, 11 72-h CVVH and 25 three consecutive 8-h SLED sessions. The demographic and clinical characteristics at KRT start are reported in Table 1. The mean (SD) age was 70.0 (10.5) years, and the mean (SD) Acute Physiology and Chronic Health Evaluation II (APACHE II) score was 25.1 (7). Thirty-two out of 47 (68%) patients were mechanically ventilated; 21/47 patients (44.6%) had undergone recent surgery, mostly as major heart surgery (10/21, 47.6%). Twenty-nine (61.7%) patients required vasopressors due to severe hemodynamic instability. Thirty-six patients (76.6%) met sepsis criteria. Oliguria was present in most patients (44/47, 93.6%) at KRT start. Thirty-two patients (68.1%) had a history of chronic kidney disease (CKD), of whom 23 (48.9%) were receiving conservative care and 9 (19.1%) were previously on maintenance dialysis treatment (intermittent hemodialysis or peritoneal dialysis). Among other chronic comorbidities, chronic liver disease was present in 6/47 (12.8%) patients, while 10/47 (21.3%) patients had acute liver dysfunction, primary due to acute decompensated heart failure and multiorgan failure secondary to sepsis. Hepatorenal syndrome was detected in one patient (2.1%).
Demographic and clinical characteristics at KRT start.
| Variable | Values |
|---|---|
| Age, years | 70 (10.5) |
| Male sex, n (%) | 30 (63.8) |
| APACHE II score | 25.1 (7.0) |
| Serum creatinine, mg/dL | 3.5 (2–5) |
| SUN, mg/dL | 59 (29–75) |
| Oliguria, n (%) | 44 (93.6) |
| Platelets, ×103/μL | 202 (156.80) |
| White blood cells, ×103/μL | 13.9 (6.29) |
| Hb, g/dL | 9.6 (1.9) |
| Glucose, mg/dL | 133 (48) |
| Sodium, mmol/L | 138 (4.0) |
| Potassium, mmol/L | 4.6 (0.7) |
| Bicarbonate, mmol/L | 22.5 (4.99) |
| Calcium, mg/dL | 8.07 (0.95) |
| Phosphorus, mg/dL | 5.5 (2.3) |
| Magnesium, mg/dL | 2.1 (0.6) |
| Lactate, mmol/dL | 1.48 (0.91) |
| Total bilirubin, mg/dL | 1.29 (0.78) |
| Serum albumin, g/dL | 2.6 (0.4) |
| INR, prothrombin time | 1.40 (0.53) |
| aPTT ratio | 1.06 (0.25) |
| MELD score | 23 (20–25) |
| Mechanical ventilation, n (%) | 32 (68) |
| Non-invasive, n (%) | 17 (53.1) |
| Invasive, n (%) | 15 (46.9) |
| Postoperative status, n (%) | 21 (44.6) |
| Abdominal surgery, n (%) | 7 (33.3) |
| Heart surgery, n (%) | 10 (47.6) |
| Vascular, n (%) | 3 (14.3) |
| Other, n (%) | 1 (4.8) |
| Vasopressors use for hemodynamic instability, n (%) | 29 (61.7) |
| Sepsis, n (%) | 36 (76.6) |
| Artificial nutrition, n (%) | 32 (68.1) |
| Enteral, n (%) | 21 (65.6) |
| Parenteral, n (%) | 11 (34.4) |
| Chronic comorbidities, n (%) | |
| Diabetes mellitus | 23 (48.9) |
| CAD | 18 (38.3) |
| Heart failure | 18 (38.3) |
| Chronic liver disease | 6 (12.8) |
| CKD | 32 (68.1) |
| ESKD on hemodialysis or peritoneal dialysis | 9 (19.1) |
| ICU mortality | 8/47 (17) |
Categorical variables are presented as n (%), and continuous variable as mean (SD) or median (range).
SUN, serum urea nitrogen; Hb, hemoglobin; CAD, coronary artery disease; aPTT, activated partial thromboplastin time.
According to the Kidney Disease: Improving Global Outcomes (KDIGO) definitions [25], a diagnosis of stage III AKI was made in 38/47 (80.8%) patients, occurring as a first severe AKI episode in 15/38 (39.5%) patients and as an incident AKI (AKI on CKD) in 23/38 (60.5%) patients. In most patients, AKI was detected at ICU admission (28/38, 73.7%), and only in a few cases it occurred during the ICU stay (10/38, 26.3%). With respect to the pathophysiological conditions hypothesized as being linked to AKI, sepsis was observed in most patients (28/38, 74%), followed by post-surgical state (17/38, 44%) and hemodynamic instability requiring vasopressors (21/38, 55%). In AKI patients, the main indication for starting KRT was progressive fluid overload associated with stage 3 oliguric AKI refractory to diuretic therapy (35/38, 92%). Among them, according to the attending nephrologist's prescription, 8/38 (21%) underwent CVVH, 9/38 CVVHDF (24%) and 21/38 (55%) three consecutive 8-h SLED sessions.
In the case of CVVH, the mean (SD) prescribed dialysis dose was 36.7 (5.9) mL/kg/h; 14 extracorporeal circuits were used in 11 patients with a mean (SD) filter life of 71.9 (0.2) h, for a total running time of 575.5 h. Considering both scheduled and unscheduled CKRT interruptions, down-time periods accounted for 0.4% of the total CVVH treatment period. As to CVVHDF, mean (SD) prescribed dialysis dose was 30.3 (4.1) mL/kg/h; 16 CKRT circuits were used in 11 patients with a mean (SD) filter life of 45.7 (26.3) h, for a total running time of 731.5 h. Considering both scheduled and unscheduled CKRT interruptions, down-time periods accounted for 7.6% of the total CVVHDF treatment period. With respect to SLED-f, overall, three consecutive SLED sessions were carried out in 25 patients, for a total of 75 SLED-f sessions. Of the 75 sessions performed, three (4%) were prematurely interrupted with irreversible clotting occurring in one session (1.3%).
Acid-base and electrolyte balance
No episode of clinically relevant metabolic acidosis or metabolic alkalosis occurred. The trend of the main laboratory variables related to RCA during CKRT and PIKRT is shown in Tables 2 and 3, respectively. Analysis of variance showed showed no significant differences in plasma bicarbonate levels across dialysis days in patients undergoing CVVHDF and SLED-f; on the other hand, plasma bicarbonate concentration was significantly higher after 72 h of treatment than at baseline (P = .016) in patients undergoing CVVH.
Intradialytic variables related to RCA during CKRT.
| Variable | CKRT start | CKRT 2 h | CKRT 8 h | CKRT 12 h | CKRT 24 h | CKRT 48 h | CKRT 72 h | ANOVA | P |
|---|---|---|---|---|---|---|---|---|---|
| CVVH | |||||||||
| ACT, s | 117.1 (17.0) | 123.7 (20.0) | 122.3 (21.3) | 123.0 (28.5) | 114.7 (24.0) | 114.3 (17.3) | 109.6 (17.4) | F(2.51, 20.12) = 2.38 | .108 |
| s-Ca2+, mmol/L* | 1.07 (0.17) | 0.99 (0.15) | 1.15 (0.12) | 1.24 (0.13) | 1.28 (0.12) | 1.17 (0.06) | 1.19 (0.09) | F(6, 54) = 7.08 | <.001 |
| c-Ca2+, mmol/L | NA | 0.38 (0.08) | NA | NA | NA | NA | NA | NA | NA |
| CaCl2, mL/h* | 5.43 (0.34) | 6.90 (1.12) | 8.22 (2.67) | 7.79 (2.75) | 5.81 (1.67) | 5.87 (0.98) | 5.86 (1.41) | F(2.08, 18.70) = 5.33 | .014 |
| HCO3−, mmol/L* | 20.7 (4.2) | 21.0 (3.6) | 21.6 (3.2) | 22.3 (3.1) | 22.8 (2.0) | 24.0 (1.8) | 24.8 (2.3) | F(1.46, 13.11) = 5.46 | .026 |
| Lactate, mmol/L | 0.95 (0.37) | 1.03 (0.42) | NA | NA | NA | NA | NA | NA | .458 |
| Citrate, mmol/L* | 0.65 (0.30) | 0.75 (0.22) | 0.90 (0.37) | 1.07 (0.46) | 1.02 (0.46) | 0.82 (0.31) | 0.96 (0.35) | F(6, 30) = 2.902 | .024 |
| CVVHDF | |||||||||
| ACT, s | 114.2 (14.6) | 109.8 (7.8) | 113.3 (12.5) | 109.3 (16.5) | 116.7 (12.8) | 110.8 (5.8) | 113.7 (8.4) | F(6, 30) = 0.576 | .747 |
| s-Ca2+, mmol/L* | 1.10 (0.08) | 1.06 (0.09) | 1.15 (0.07) | 1.20 (0.08) | 1.18 (0.08) | 1.12 (0.06) | 1.17 (0.07) | F(6, 48) = 4.128 | .002 |
| c-Ca2+, mmol/L | NA | 0.41 (0.11) | NA | NA | NA | NA | NA | NA | NA |
| CaCl2, mL/h | 5.49 (1.86) | 6.21 (2.00) | 7.30 (2.11) | 6.52 (1.83)** | 6.00 (1.07) | 5.64 (1.26) | 5.44 (0.60) | F(6, 48) = 3.027 | .014 |
| HCO3−, mmol/L | 25.5 (4.9) | 24.5 (4.5) | 24.2 (4.9) | 24.3 (4.2) | 25.0 (3.4) | 24.9 (3.0) | 25.3 (2.8) | F(1.76, 14.05) = 0.506 | .59 |
| Lactate, mmol/L | 1.08 (0.42) | 1.13 (0.43) | NA | NA | NA | NA | NA | NA | .839 |
| Citrate, mmol/L | 0.42 ± 0.14 | 0.52 ± 0.24 | 0.53 ± 0.19 | 0.52 ± 0.17 | 0.63 ± 0.24 | 0.63 ± 0.23 | 0.56 ± 0.37 | F(2.44, 14.6) = 1.5 | .257 |
*No difference between time points at the pairwise analysis; **P < .05 in comparison with baseline
Data are presented as mean (SD). Values are intended as measured on patients’ blood if not otherwise indicated. P-values refer to test for trend across all the available sample times.
ACT, activated clotting time; s-Ca2+, systemic ionized calcium; c-Ca2+, circuit ionized calcium; CaCl2, calcium chloride infusion; HCO3−, bicarbonate; NA, not available.
Intradialytic variables related to RCA during PIKRT.
| Variable | SLED start | SLED 2 h | SLED 4 h | SLED 6 h | SLED 8 h | ANOVA | P |
|---|---|---|---|---|---|---|---|
| ACT, s | 115.6 (13.5) | 118.0 (13.1) | 117.1 (12.1) | 116.5 (15.0) | 119.2 (15.9) | F(2.94, 70.65) = 0.991 | .401 |
| s-Ca2+, mmol/L | 1.13 (0.09) | 1.14 (0.07) | 1.16 (0.08)** | 1.20 (0.05)*,***,**** | 1.20 (0.06) | F(1.77, 42.49) = 8.823 | <.001 |
| c-Ca2+, mmol/L | NA | 0.40 (0.04) | NA | NA | NA | NA | NA |
| CaCl2, mL/h | 11.1 (0.5) | 11.7 (1.4) | 11.9 (2.2) | 11.5 (2.2) | 11.4 (2.1) | F(1.49, 35.67) = 2.207 | .137 |
| HCO3−, mmol/L | 21.9 (2.2) | 21.3 (1.8) | 21.6 (1.8) | 21.5 (1.6) | 21.4 (1.8) | F(1.70, 40.88) = 1.826 | .178 |
| Lactate, mmol/L | 1.19 (0.64) | 1.27 (0.50 | NA | NA | NA | NA | .177 |
| Citrate, mmol/L | 0.58 ± 0.19 | NA | 0.70* ± 0.23 | 0.72* ± 0.27 | 0.74* ± 0.22 | F(3, 57) = 18.42 | <.001 |
*P < .01 in comparison with baseline; **P < .05 in comparison with 2 h; ***P < .01 in comparison with 2 h; ****P < .05 in comparison with 4 h.
Data are presented as mean (SD). Values are intended as measured on patients’ blood if not otherwise indicated. P-values refer to test for trend across all the available sample times.
ACT, activated clotting time; s-Ca2+, systemic ionized calcium; c-Ca2+, circuit ionized calcium; CaCl2, calcium chloride infusion; HCO3−, bicarbonate; NA, not available.
Focusing on calcium balance, no episodes of hypo- or hypercalcemia were observed during treatment and s-Ca2+ levels were steadily maintained in a narrow normality range. However, s-Ca2+ tended to increase in patients undergoing CVVH and CVVHDF. While this increase was statistically significant, it could be hardly regarded as being clinically significant. Similarly, in patients undergoing SLED-f, s-Ca2+ increased in comparison with baseline, and was significantly higher at 24 h and 48 h compared with the value at the start of the first dialysis session (P = .004). However, again this increase in s-Ca2+ was not clinically significant.
Finally, citrate serum levels were measured along KRT in 83 sessions (10 CVVH, 8 CVVHDF, 65 SLED-f). As mirrored by the negligible incidence of ionized hypocalcemia, by the unmodified need for calcium chloride supplementation and by the absence of episodes of acid-base imbalance, no clinically relevant changes were observed in plasma citrate concentration, with mean values remaining steadily below 1 mmol/L (Tables 2 and 3). While no statistically significant differences were detected during CVVHDF (P = .26), in patients undergoing CVVH and SLED serum citrate concentration were slightly increased, though without any citrate accumulation. No effect on patients’ coagulation was observed, as confirmed by the absence of statistically significant differences between systemic ACT measured at different times during KRT and the absence of major hemorrhagic events during KRT days.
With the aim of assessing the safety of our RCA protocol also in patients with severe liver dysfunction, who are at high risk of citrate accumulation, we analyzed separately citrate serum levels in a subgroup of patients with MELD score ≥25 (Fig. 2). Also, in these patients serum citrate concentration values steadily remained on average below 1 mmol/L, showing a wide margin of safety of RCA also in these high-risk patients. Moreover, an ANOVA model including MELD score ≥25 as a covariate showed no effect of worse liver function on serum citrate concentration [F(4, 152] = 1.238, P = .30].
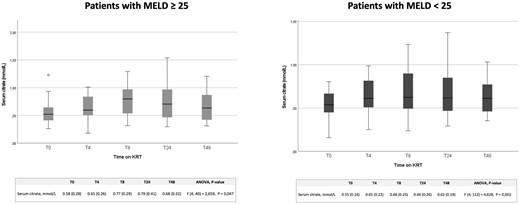
Trend of serum citrate levels in critically ill patients with different MELD scores undergoing CVVH, CVVHDF and SLED. Serum citrate levels at 0, 4, 8, 24 and 48 h of KRT in patients with a MELD score ≤25 and ≥25.
Serum phosphate levels
All modalities
Mean serum phosphate values over KRT time are illustrated in Fig. 3A. Considering the whole treatment period, mild or moderate hypophosphatemia was observed in 6.6% of s-P determinations, while severe hypophosphatemia never occurred. Parenteral supplementation with sodium glycerophosphate pentahydrate was scheduled after or during 6 out of a total of 97 KRT sessions (6.2%) with a mean (SD) daily supplementation of 1.81 (7.24), 0.45 (3.01) and 0.53 (3.24) mmol during CVVH, CVVHDF and SLED-f, respectively (Table 4). Notwithstanding a remarkable variability in baseline s-P levels, s-P concentration was gradually corrected and/or steadily maintained within the normal range throughout KRT days. Between-day differences in s-P levels were significant [F(1.62, 67.91) = 14.61, P < .001], with baseline s-P (i.e. before KRT start) level being significantly higher compared with days 3 {i.e. 48 h after the beginning of KRT, mean difference 1.31 [standard error (SE) 0.34], P = .003} and 4 [i.e. 72 h after the beginning of dialysis, mean difference 1.58 (SE 0.36), P < .001]. Serum phosphate level on day 2 (i.e. 24 h after the beginning of dialysis) was also higher compared with day 3 [mean difference 0.71 (SE 0.19), P = .004] and day 4 [mean difference 0.99 (SE 0.23), P < .001]. A sensitivity analysis performed by including five patients who received phosphate supplementation showed that between-day differences in s-P concentration were still statistically significant [F(1.62, 66.45) = 10.82, P < .001].
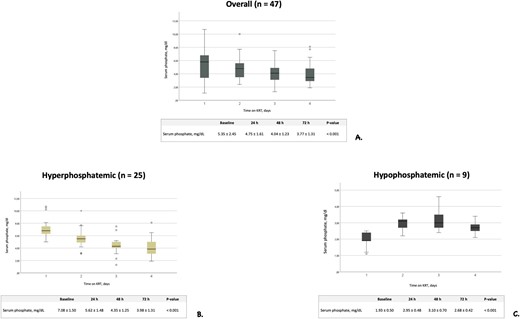
Serum phosphate levels trend during KRT treatment period in all patients and in subgroups of patients stratified according to baseline values. Trend of serum phosphate levels in all patients undergoing CVVH, CVVHDF and SLED (A), in baseline hyperphosphatemic patients (B) and in hypophosphatemic patients (C). Data are reported as mean and SD.
Laboratory data at start and during KRT treatment.
| Variable | Baseline | 24 h | 48 h | 72 h | P |
|---|---|---|---|---|---|
| CVVH | |||||
| Hb, g/dL | 8.5 (1.1) | 8.4 (0.9) | 8.2 (0.9) | 8.7 (0.8) | .324 |
| sCr, mg/dL | 3.9 (3.6) | 2.7 (2.2) | 1.5 (0.9) | 1.1 (0.4) | .017 |
| SUN, mg/dL | 104.5 (83.6) | 77.6 (52.5) | 44.0 (24.1) | 35.7 (16.9) | .011 |
| Glucose, mg/dL | 126 (40) | 116 (38) | 125 (47) | 119 (38) | .755 |
| Sodium, mmol/L | 137.3 (3.2) | 136.5 (2.0) | 135.0 (1.7) | 135.0 (2.2) | .046 |
| Potassium, mmol/L | 4.2 (0.6) | 3.7 (0.6) | 3.8 (0.4) | 3.6 (0.3) | .048 |
| Total calcium, mg/dL | 7.8 (1.0) | 9.7 (1.4) | 9.4 (1.4) | 9.7 (0.7) | <.001 |
| Calcium ratio | 1.8 (0.1) | 1.9 (0.3) | 2.0 (0.2) | 2.0 (0.2) | .206 |
| Phosphorus, mg/dL | 5.0 (2.3) | 4.6 (2.1) | 3.3 (1.6) | 2.6 (0.8) | <.001 |
| Magnesium, mg/dL | 1.9 (0.4) | 2.0 (0.9) | 1.7 (0.7) | 1.7 (0.6) | .423 |
| Supplementations needs for the whole CKRT period | |||||
| Phosphate supplementation, mmol/day | 1.81 (7.24) | ||||
| Potassium chloride infusion, mmol/day | 47.56 (59.10) | ||||
| Magnesium sulphate, g/day | 1.91 (2.18) | ||||
| Blood transfusion, units/day | 0.09 (0.36) | ||||
| CVVHDF | |||||
| Hb, g/dL | 8.9 (1.7) | 8.7 (1.8) | 8.8 (2.2) | 8.8 (2.1) | .077 |
| sCr, mg/dL | 3.6 (1.6) | 2.5 (1.0) | 1.7 (0.5) | 1.5 (0.8) | <.001 |
| SUN, mg/dL | 137.4 (82) | 92.9 (42.2) | 62.2 (21.2) | 55.2 (20.5) | .007 |
| Glucose, mg/dL | 157 (63) | 138 (33) | 133 (23) | 153 (61) | .165 |
| Sodium, mmol/L | 137.8 (2.4) | 136.2 (2.1) | 135.3 (1.7) | 134.5 (1.9) | .002 |
| Potassium, mmol/L | 4.2 (0.7) | 3.8 (0.6) | 3.7 (0.5) | 3.6 (0.5) | .022 |
| Total calcium, mg/dL | 8.1 (0.6) | 9.4 (0.8) | 9.1 (0.6) | 8.8 (0.4) | .001 |
| Calcium ratio | 1.8 (0.1) | 2.0 (0.2) | 2.0 (0.1) | 1.9 (0.1) | .017 |
| Phosphorus, mg/dL | 5.7 (2.6) | 5.0 (1.4) | 3.9 (0.7) | 3.8 (0.9) | .026 |
| Magnesium, mg/dL | 2.1 (0.5) | 1.9 (0.3) | 1.7 (0.3) | 1.9 (0.2) | .049 |
| Supplementations needs for the whole CKRT period | |||||
| Phosphate supplementation, mmol/day | 0.45 (3.01) | ||||
| Potassium chloride infusion, mmol/day | 16.36 (34.30) | ||||
| Magnesium sulphate, g/day | 1.37 (1.48) | ||||
| Blood transfusion, units/day | 0.20 (0.55) | ||||
| SLED | |||||
| Hb, g/dL | 9.7 (1.1) | 9.6 (1.2) | 9.4 (1.1) | 9.6 (1.2) | .469 |
| sCr, mg/dL | 3.9 (1.8) | 2.8 (1.3) | 2.5 (1.1) | 2.5 (1.2) | <.001 |
| SUN, mg/dL | 55.1 (35.1) | 39.6 (21.1) | 33.6 (17.9) | 33.0 (19.1) | .002 |
| Glucose, mg/dL | 131 (43) | 124 (51) | 124 (49) | 144 (72) | .108 |
| Sodium, mmol/L | 137.6 (4.7) | 136.6 (3.4) | 135.8 (3.5) | 136.0 (2.9) | .111 |
| Potassium, mmol/L | 4.4 (0.6) | 4.3 (0.5) | 4.2 (0.5) | 4.3 (0.6) | .221 |
| Total calcium, mg/dL | 8.2 (0.9) | 8.9 (0.9) | 8.9 (0.5) | 8.9 (0.7) | <.001 |
| Calcium ratio | 1.90 (0.13) | 1.94 (0.21) | 1.93 (0.13) | NA | .515 |
| Phosphorus, mg/dL | 5.3 (2.5) | 4.6 (1.6) | 4.4 (1.2) | 4.3 (1.5) | .057 |
| Magnesium, mg/dL | 2.2 (0.8) | 1.9 (0.3) | 1.9 (0.4) | 1.9 (0.5) | .233 |
| Supplementations needs for the whole PIKRT period | |||||
| Phosphate supplementation, mmol/day | 0.53 (3.24) | ||||
| Potassium chloride infusion, mmol/day | 0 | ||||
| Magnesium sulphate, g/day | 0.67 (1.61) | ||||
| Blood transfusion, units/day | 0.04 (0.19) | ||||
Data are presented as mean (SD). Values are intended as measured on patients’ blood if not otherwise indicated. P-values refer to test for trend across all the available sample times.
SUN, serum urea nitrogen; Hb, hemoglobin; sCr, serum creatinine.
In the patients who were hyperphosphatemic at baseline (n = 25) s-P levels tended to normalize during KRT treatment time, with a significant difference between days on dialysis [F(2.23, 53.45) = 46.51, P < .001]. Baseline s-P level was higher in comparison with all measurements during the first 3 days on KRT [baseline vs day 1: mean difference 1.46 (SE 0.29), P < .001; baseline vs day 2: mean difference 2.72 (SE 0.33), P < .001; baseline vs day 3: mean difference 3.10 (SE 0.36), P < 0.001] (Fig. 3B). After adjusting for phosphate supplementation, differences were still statistically significant [F(2.226, 51.205) = 39.919, P < .001]. A normalization of s-P values was also observed in the patients who were hypophosphatemic at baseline (n = 9) [F(3, 24) = 9.14, P < .001]. The value of s-P at baseline was lower compared with measurements performed 24 h [mean difference –1.02 (SE 0.22), P = .009] and 48 h [mean difference –1.16 (SE 0.31), P = .036] after the beginning of KRT. After adjusting for phosphate supplementation, differences were still statistically significant [F(3, 21) = 7.009, P = .002] (Fig. 3C).
CVVH
Looking at phosphate balance in each different KRT modality, in patients undergoing CVVH the change in s-P level across days on dialysis was significant [F(1.96, 19.55) = 8.35, P = .003]. Serum phosphate levels 24 h after the beginning of CVVH were significantly higher than those measured at 48 h [mean difference –1.33 (SE 0.36), P = .044] and 72 h [mean difference –1.96 (SE 0.46), P = .016] after the beginning of KRT. After adjusting for phosphate supplementation, differences in s-P levels across days on dialysis were still significant [F(1.981, 17.826) = 5.693, P = .012].
CVVHDF
Regarding CVVHDF modality, changes in s-P levels across days on dialysis did not reach statistical significance [F(1.41, 11.35) = 3.56, P = .074]. However, after adjusting for phosphate supplementation (one patient), differences in s-P concentration across different time points were statistically significant [F(1.431, 10.019) = 4.920, P = .041].
SLED-f
In patients who underwent three consecutive PIKRT sessions, the change in s-P values across days on SLED-f did not reach statistical significance [F(1.51, 31.82) = 3.41, P = .057]. Only two patients received phosphate supplementation; after adjusting for phosphate supplementation the results were unchanged [F(1.501, 30.028) = 2.123, P = .147].
Other biochemical parameters
Table 4 summarizes the trend of laboratory findings during KRT days, and reports the amount of phosphate and magnesium given by parenteral supplementation, together with blood transfusion needs, for each KRT modality. As shown, by combining this new KRT solution with an early supplementation strategy, no electrolyte and metabolic derangements occurred during dialysis days.
DISCUSSION
The main finding of this study is that a new simplified RCA protocol using a low-citrate solution coupled with new phosphate-containing solution as dialysis/replacement fluid allows an effective and safe treatment of critically ill patients with renal failure by different KRT modalities. Using this approach, we were able to prevent the onset of KRT-related hypophosphatemia and indeed to normalize s-P levels during treatment, irrespective of the KRT modality chosen by the attending nephrologist and patients’ baseline s-P levels. We also provide evidence of a lack of clinically relevant citrate accumulation even in patients with severe liver dysfunction. To our knowledge, this is the first study evaluating the efficacy and safety of a new simplified RCA protocol combining the use of a low-concentration citrate solution with a recently marketed phosphate-containing solution in both continuous and prolonged intermittent KRT modalities also by direct serum citrate measurements.
In patients with critical illness, the start of prolonged KRT represents a significant risk factor for hypophosphatemia, especially when delivering high dialysis doses with standard dialysis solutions [2–9]. In this regard, a safe and effective approach to overcome the risk of KRT-hypophosphatemia should implement strategies with tailored dialysis prescriptions and composition of KRT fluids. Based on this premise, we developed a new RCA protocol, adapted for the most commonly used KRT modalities in the ICU, trying to minimize the incidence of KRT-induced hypophosphatemia and acid-base derangements. To this purpose, we combined a recently introduced, commercially available, phosphate-containing KRT solution, which we used as both a dialysis and a post-dilution replacement fluid, with a low-concentration, isotonic in sodium, citrate solution for RCA. The effectiveness and safety of commercially available phosphate-containing solutions has been reported and successfully tested in different KRT modalities and with different anticoagulation settings [16, 18–23]. However, no previous studies tested the use of these new phosphate-containing KRT solutions in patients undergoing PIKRT, which is widely considered a safe and effective alternative to CKRT in critically ill patients with AKI and hemodynamic instability [27–30]. Using this protocol, we observed a significant decrease in the incidence of KRT-induced hypophosphatemia which minimized the need for parenteral supplementations. Moreover, an analysis of the time-course of s-P concentration during all KRT modalities showed that, regardless of the baseline s-P values, s-P levels were progressively corrected and/or steadily maintained in a narrow normality range; importantly, normalization of s-P levels occurred irrespective of exogenous phosphate supplementation. In fact, the difference in s-P concentrations between dialysis days observed in patients who did not receive phosphate supplementation remained statistically significant after including five patients who received phosphate supplementation. These data strongly support the preeminent role of dialysis in conditioning phosphate balance and s-P levels in patients undergoing prolonged KRT, independent of exogenous intravenous supplementations. During the whole treatment period, mild and moderate hypophosphatemia was observed in only 6.6% of s-P determinations, while severe hypophosphatemia never occurred. Parenteral supplementation with sodium glycerophosphate pentahydrate was scheduled after/during 6 out of 97 KRT sessions (6.2%), and the amount of parenteral phosphate supplementation needed was substantially negligible in all KRT modalities (Table 4). Moreover, we did not detect any case of KRT-related hyperphosphatemia. Indeed, in 25 patients who had hyperphosphatemia before KRT start, s-P levels progressively decreased and finally normalized across dialysis days (Fig. 3). On the other hand, nine patients who were hypophosphatemic before the start of KRT, probably due to several factors common in critically ills (e.g. sepsis, refeeding syndrome, acid-base derangements, high-dose diuretic therapy), had s-P values normalized during KRT thanks to the phosphate mass transfer.
Regional citrate anticoagulation is now recommended as the first-choice anticoagulation modality in patients with AKI undergoing CKRT, since it allows a longer filter lifespan as well as lower bleeding rates and transfusion needs compared with other anticoagulation strategies [24, 25, 31]. Our data confirm the efficacy of RCA in terms of circuit lifetime and filter efficiency, with down-time periods accounting for less than 10% of the total treatment period. Nevertheless, issues still remain regarding potential acid-base derangements. Interestingly, optimization of acid-base status was also achieved by adopting of our protocol. In a recent randomized trial comparing RCA-CKRT with systemic heparin anticoagulation, patients in the RCA group more frequently developed severe metabolic alkalosis (2.4% vs 0.3%), defined as pH higher than 7.50 and bicarbonate concentration greater than 30 mmol/L [31], due to citrate overload. Among strategies aimed at preventing buffer overload, the combination of the citrate solution with dialysis and/or post dilution replacement fluids with a low bicarbonate concentration (HCO3− 22 mmol/L, Biphozyl) has been shown to be effective in preserving the acid-base balance during CVVH [32]. In line with those data, in our study plasma bicarbonate levels were steadily maintained within the normal range, and no episodes of relevant metabolic alkalosis or acidosis were observed (Tables 2 and 3). In fact, a moderate increase of plasma bicarbonate occurred during CVVH and CVVHDF, while during SLED-f sessions the final bicarbonate plasma concentration was comparable to the baseline value. The latter finding is not unexpected, as most of the dialysis dose was delivered by using this new solution as the dialysis fluid (Fig. 1C). An increase in the citrate infusion rate and/or a decrease of citrate and bicarbonate losses by reducing the dialysis dose may also represent sound strategies to avoid severe acid-base derangements [24]. Furthermore, based on the values of calcium ratio and s-Ca2+ levels, no citrate accumulation was observed during KRT sessions, with serum citrate concentrations remaining constantly below 1 mmol/L along all treatments (Tables 2 and 3). However, because almost the whole dialysis dose was delivered by using calcium-free solutions, 10% calcium chloride was infused continuously in a separate central venous line from the beginning of each KRT session with the aim of preventing the onset of systemic hypocalcemia. Although a mild increase of s-Ca2+ was detected during all KRT sessions (Tables 2 and 3), s-Ca2+ values always remained within the normal range and hypercalcemia never occurred, and thus the slight increase in s-Ca2+ was not clinically significant.
Also, due to the high daily solute clearance typically occurring during prolonged KRT, particularly when using RCA protocols with low concentration dialysis solution [33, 34], we scheduled parenteral supplementations potassium chloride and magnesium sulphate to minimize the risk of hypokalemia and hypomagnesemia (Table 4).
Finally, we measured serum citrate levels in the subgroup of patients with severe liver dysfunction (MELD score ≥25), and we observed a good safety profile of our new RCA protocol also in these high-risk patients (Fig. 2). Hepatic clearance represents the main metabolic pathway of citrate metabolism and the extensive use of RCA in patients with liver failure has been limited due to the risk of citrate accumulation with consequent electrolyte and acid-base derangements [24]. Despite these concerns, there is increasing evidence of the safety and efficacy of citrate in patients with severe liver failure undergoing continuous and prolonged intermittent KRT [28, 35–37]. Indeed, in a recent meta-analysis the use of RCA in CKRT in patients with liver failure was safe and effective, by ensuring a filter lifespan comparable to patients without liver dysfunction [38]. As our data confirmed, also in this specific clinical setting, the increased risk of citrate accumulation can be well addressed by the implementation of strategies aimed at reducing the citrate load and by a careful laboratory monitoring [24].
Citrate spilling in the systemic circulation may have occurred in our patients due to the locking procedure of CVC lumens at the end of the dialysis session. Based on the in vitro and in vivo measurements obtained by Polaschegg et al. [39–41], it can be expected that ∼25% of the lock volume injected in the CVC lumen is spilled. While a very concentrated trisodium citrate solution (46.7%) was used in the experiments reported by those investigators, we used a 12-fold more diluted (3.8%, i.e. 129 mmol/L, or 0.129 mmol/mL) trisodium citrate solution. Assuming a lock volume of 1.5 mL in each lumen of a bilumen dialysis CVC, about 0.193 mmol of citrate were injected to lock each CVC lumen. If 25% of this volume were spilled from each lumen in the patient circulation, then about 0.097 mmol of citrate (i.e. 25% of 0.387 mmol of trisodium citrate in the two lumens) would mix with the patient's blood. Assuming a blood volume of 5 L, this would increase by 0.019 mmol/L blood citrate levels, a negligible amount if compared with the serum citrate levels measured in our patients on SLED (0.58–0.74 mmol/L at the different time points along the SLED session). Thus, we believe that citrate-based locking solutions could not have significantly affected serum citrate levels in our patients.
We acknowledge some limitations of this study. First, this was a single-center pilot study, and our results need to be confirmed in a larger patient population. In addition, we enrolled a heterogenous admixture of critically ill patients, with roughly half presenting with a post-surgical status. Besides, about 75% of patients experienced sepsis, which can interfere with the acid-base and electrolyte balance, particularly in the presence of chronic comorbidities such as diabetes mellitus, heart failure and CKD. Specifically, sepsis-related AKI may promote and exacerbate the onset of metabolic acidosis. However, by measuring serum citrate levels directly, we could confirm unequivocally the absence of citrate accumulation and related acid-base derangements also in high-risk critically ill patients. Moreover, as shown by the close laboratory monitoring during and after the dialysis sessions, the new phosphate-containing, low-bicarbonate (22 mmol/L) KRT solution used in this study successfully prevented the development of metabolic alkalosis related to RCA. Thus, we believe that our results could not have been affected significantly by several acute and/or chronic comorbidities which may represent potential confounding factors. Finally, the lack of a control group treated with conventional KRT solutions does not allow us to draw conclusions on a putative superiority of the newly available solutions in maintaining s-P levels and steady acid-base balance.
Notwithstanding these limitations, this is the first study providing data on the efficacy and safety of a new RCA protocol combining a low-concentration citrate solution with a recently introduced phosphate-containing solution in three different KRT modalities. Finally, by performing direct serum citrate measurements, we were able to assess the safety of this approach also in patients with severe liver dysfunction, who are at high risk for citrate accumulation.
CONCLUSIONS
Our simplified RCA protocol, which can be used for CVVH, CVVHDF and SLED, allows to ensure an adequate circuit life, to prevent KRT-related hypophosphatemia, and to optimize the acid-base balance. On these grounds, we believe that our results provide consistent data on the efficacy of our new RCA protocol, which can be safely adopted by nephrologists and intensivists to treat critically ill patients with AKI in the ICU
FUNDING
The present study was funded by Baxter Healthcare Corporation by a Grant to Department of Medicine and Surgery. An independent statistician monitored the raw data and the statistics. This publication was subject to review by internal employees from Baxter Healthcare Corporation prior to submission for protection of Confidential Information. However, the Authors retain full responsibility for the content of this publication.
AUTHORS’ CONTRIBUTIONS
F.D.M.: conceptualization, methodology, investigation, data curation, writing—original draft. A.S.: methodology, investigation, statistical analysis, writing—review & editing. G.R.: statistical analysis, writing—review & editing. M.C.P.: investigation, data curation. P.G.: resources, data curation. C.M.: resources, data curation. G.V.: investigation, data curation. C.I.: investigation, data curation. V.P.: data curation, writing—review & editing. S.M.: data curation, writing—review & editing. E.F.: supervision, methodology, writing—review & editing, project administration.
DATA AVAILABILITY STATEMENT
The datasets used and/or analyzed during the current study are available from the corresponding author on reasonable request.
CONFLICT OF INTEREST STATEMENT
None declared. The results presented in this paper have not been published previously in whole or in part.


Comments