


ABSTRACT
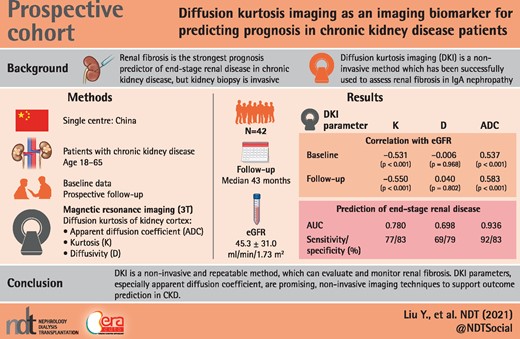
Renal fibrosis is the strongest prognostic predictor of end-stage renal disease (ESRD) in chronic kidney disease (CKD). Diffusion kurtosis imaging (DKI) is a promising method of magnetic resonance imaging successfully used to assess renal fibrosis in immunoglobulin A nephropathy. This study aimed to be the first to evaluate the long-term prognostic value of DKI in CKD patients.
Forty-two patients with CKD were prospectively enrolled, and underwent DKI on a clinical 3T MR scanner. We excluded patients with comorbidities that could affect the volume or the components of the kidney. DKI parameters, including mean Kurtosis (K), mean diffusivity and apparent diffusion coefficient (ADC) of kidney cortex were obtained by region-of-interest measurement. We followed up these patients for a median of 43 months and investigated the correlations between each DKI parameter and overall renal prognosis.
Both K and ADC values were correlated well with the estimated glomerular filtration rate (eGFR) on recruitment and the eGFR of the last visit in follow-up (P ˂ 0.001). K and ADC values were also well associated with the eGFR slopes in CKD patients, both with the first–last time point slope (P = 0.011 and P ˂ 0.001, respectively) and with the regression slope (P = 0.010 and P ˂ 0.001, respectively). Cox proportional hazard regression indicated that lower eGFR and ADC values independently predicted eGFR loss of ˃30% and ESRD. The receiver operating characteristic analysis showed that K and ADC values were predictable for renal prognosis, and ADC displayed better capabilities for both ESRD [area under the curve (AUC) 0.936, sensitivity 92.31%, specificity 82.76%] and the composite endpoint (eGFR loss ˃30% or ESRD) (AUC 0.881, sensitivity 66.67%, specificity 96.3%).
Renal ADC values obtained from DKI showed significant predictive value for the prognosis of CKD patients, which could be a promising noninvasive technique in follow-up.
KEY LEARNING POINTS
What is already known about this subject?
renal fibrosis is the strongest prognosis predictor of end-stage renal disease in chronic kidney disease (CKD), but renal biopsy, which is the gold standard to assess the severity of renal fibrosis, is invasive with ensuing complications;
diffusion kurtosis imaging (DKI) was a noninvasive and repeatable method that has been successfully used to assess renal fibrosis in immunoglobulin A nephropathy in our previous work; and
this study aimed to be the first to evaluate the long-term prognostic value of DKI in CKD patients.
What this study adds?
our study demonstrated that the non-Gaussian DKI model was a potential method to evaluate and monitor renal fibrosis in CKD patients;
renal kurtosis and apparent diffusion coefficient (ADC) obtained from DKI were highly correlated not only with renal function on recruitment, but also with estimated glomerular filtration rate (eGFR) slopes and eGFR of the last visit in follow-up; and
ADC value from DKI model also showed predictive value for the progression of CKD, which could be a promising noninvasive technique in CKD patients follow-up.
What impact this may have on practice or policy?
In this study, we proved that DKI, as a noninvasive and repeatable method, can evaluate and monitor renal fibrosis. Furthermore, the long-term prognostic value of DKI model was also confirmed in CKD patients; and
this study provides a promising, noninvasive imaging technique for CKD patients follow-up.
INTRODUCTION
Chronic kidney disease (CKD) is a worldwide public health problem, which has been defined as abnormalities of kidney structure or function present for ≥3 months with implications for health [1]. The global prevalence was estimated as 13.4% [95% confidence interval (CI) 11–15.1] [2]. CKD patients with estimated glomerular filtration rate (eGFR) between 15 and 60 mL/min/1.73 m2 transit to end-stage renal disease (ESRD) at an estimated rate of 1.5% per year [3], and renal fibrosis is the strongest prognostic predictor [4]. Renal biopsy is currently the gold standard to assess the severity of renal fibrosis, but it is invasive with ensuing complications [5], susceptible to sampling bias and not suitable for long-term follow-up. Therefore, a noninvasive and repeatable method is critically needed to evaluate and monitor renal fibrosis. With the development of radiological techniques, magnetic resonance imaging (MRI) has a wide range of applications in renal parenchymal diseases [6]. Diffusion-weighted imaging (DWI) is a noncontrast technique performed using a mono-exponential model, which can detect the random Gaussian motion of intra- and extracellular water [7]. The former study showed that the DWI parameters correlated with renal histology [8], but they were also strongly influenced by renal perfusion and water transport [9]. Diffusion kurtosis imaging (DKI) is the extension of DWI, which is acquired at ultrahigh b-values (>1000 s/mm2). DKI can provide more information about non-Gaussian diffusion of water molecules using a polynomial model [10]. We have successfully used DKI to assess renal fibrosis in immunoglobulin A (IgA) nephropathy (IgAN) in our previous work [11]. Kurtosis (K) and apparent diffusion coefficient (ADC) values of DKI were well correlated with clinicopathological data, and they also showed superb diagnostic capabilities in receiver operating characteristic (ROC) analysis to discriminate severe renal fibrosis from mild lesions. We assumed that the disappearance of glomerular cellular elements with replacement by an expanding extracellular matrix (ECM) and fibrous tissue in the pathogenesis of IgAN could be detected by the DKI model. However, the application of this method in CKD patients and the feasibility for long-term follow-up has not been validated. This study aimed to apply this novel technique to CKD patients and evaluate its long-term prognostic value.
MATERIALS AND METHODS
This study was registered retrospectively in the Chinese Clinical Trial Registry (ChiCTR), with the registration number ChiCTR2100046519. It is retrievable from the World Health Organizatoion International Clinical Trials Registry Platform. We prospectively enrolled 42 CKD patients in our study in January 2017. On recruitment, the baseline clinical data were documented, and DKI was performed on a clinical 3T MR scanner. Region-of-interest (ROI) measurements were performed to determine ADC, K and diffusivity (D) of the cortex of the kidneys. We followed up these patients until October 2020, and collected all the clinical data and outcomes. The correlations between each DKI parameter and overall renal prognosis were investigated.
Patient population
This prospective study was approved by the institutional ethical review board of Peking Union Medical College Hospital (Ethical No. ZS-1271). Between January 2017 and March 2017, adults aged 18–65 years with CKD were consecutively enrolled in our study, and written informed consent was obtained from all patients. Patients with other comorbidities that could affect the volume or the components of the kidney, such as renal cysts, polycystic kidney disease, medullary sponge kidney, hydronephrosis, renal artery stenosis, renal vein thrombosis and/or renal tumors, or contraindications for MRI examination were excluded. Ultimately, 42 patients were included in our study population, and DKI scanning was performed after enrollment.
Clinical parameters
When the patients were enrolled in our study, case notes, renal pathology and laboratory records were collected from the Hospital Information System. The GFR was estimated using the CKD Epidemiology Collaboration equation [12].
MRI protocol
All MR examinations were performed on a MAGNETOM Skyra 3T MR scanner (Siemens Healthineers, Erlangen, Germany) using an 18-channel phased-array body coil, combined with a 32-channel spine coil. DKI (with b-values of 0, 400, 800, 1200 and 1600 s/mm2) of both kidneys was performed in the axial plane using the prototype simultaneous multi-slice (SMS) sequence with the CAIPIRINHA unaliasing technique, and the parameters were as follows: TR/TE = 3000/66 ms (SMS), Fat suppression mode: SPAIR (SMS), field of view (FOV) = 400 × 325 mm2, matrix 104 × 128, slice thickness = 4 mm, 30 slices, excitation number 2, bandwidth (kHz) 1370, voxel size = 3.2 × 3.2 × 4.0 mm3, GRAPPA (PE) 2, diffusion directions 3, diffusion scheme: monopolar, phase coding direction: A ≫ P. PAT 2. Total scanning time: 3 min 56 s. At the b-value of 1600 s/mm2, the signal value is ˃3 times the noise level. We used traced DWI imaging by a set of images created with averaging source images sensitive to diffusion in different directions. By these methods, we obtained the three sets of source images in three arbitrary perpendicular orientations. All the patients were instructed to breathe freely during scanning.
Image analysis
The DKI data were transferred to an independent workstation for analysis. DKI parameter maps (K and D) and ADC maps were generated by a post-processing software program called Body Diffusion Toolbox version 1.2.1 developed by Siemens Healthineer. Multiple oval ROIs (average 4.91 ± 1.33 mm2) of the bilateral cortex at the mid-zone of both kidneys were placed on the DKI images manually with each DKI parameter map and ADC map by two radiologists with 4 and 12 years of experience, respectively, in abdominal MRI, with reference to the b = 0 mm2/s weighted images for region boundaries (Figure 1). Artifacts were avoided when placing ROIs. All measurements were repeated twice and the average values were recorded. The images were de-identified and organized in a random order before analysis. Two radiologists blinded to the clinical information of patients performed analysis independently. The ADC map was calculated according to the conventional mono-exponential diffusion model by using multiple b-values. The DKI model used the following equation: , where S is the signal at a particular b-value, S0 is the baseline signal without a diffusion gradient, K is kurtosis and D is diffusivity. After brief training, a junior radiologist who had 1 year of experience in image reading was competent to do the work, and it took about 15 min for each patient. The post-processing software was easy to operate and could automatically obtain the results of the analysis.
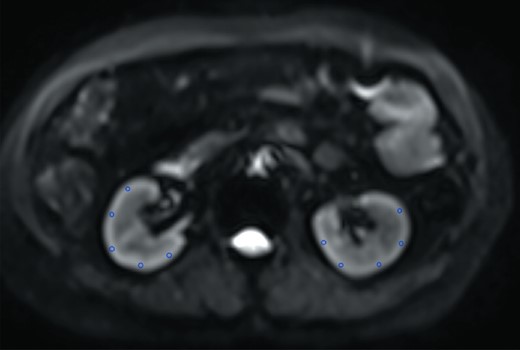
Representatives of multiple ROIs for bilateral cortexes at the mid-zone of the both kidneys on the b = 0 mm2/s image. The same ROIs were then copied to maps of all metrics.
Bilateral cortexes and medullas were delineated carefully at the level of the renal hilum. The values of K, D and ADC were recorded. Because the data from the left kidneys were more stable and lacked liver interference, we used the DKI data from the left kidneys for the statistical analyses.
Interobserver agreement was calculated for the measurement of DKI metrics by using the intraclass correlation coefficient (ICC) test: ADC = 0.82, K = 0.76, D = 0.73 (ICC test: 0.00–0.20, poor agreement; 0.21–0.40, fair agreement; 0.41–0.60, moderate agreement; 0.61–0.80, good agreement; 0.81–1.00, excellent agreement). The average values of two radiologists were documented.
eGFR slope calculation
We calculated slopes of eGFR in two ways reported previously [13]:
Slope = [GFR(j) – GFR(i)]/[Time(j) – Time(i)], the time point (j) and the time point (i) indicate the time point of last visit and recruitment.
The slope is calculated by using regression analysis using all available data for consecutive visits.
The first method is sensitive to accidental errors or variations in the eGFR, and depends only on two points. The second method considered the variability of eGFR, when its data points are ˃2.
Statistical analysis
SPSS version 26.0 for Windows (SPSS Inc., Chicago, IL, USA) was used for the statistical data analysis. The Kolmogorov–Smirnov test was used to test the normality of data. Normally distributed variables were expressed as mean values with standard deviations (SD). Non-normally distributed variables were expressed as median values with quartiles. Categorical variables were described as percentages. The independent samples t-test was used to compare the clinical data between two groups. Mann–Whitney U test was used to compare the follow-up intervals between two groups. Pearson chi-square test was used to compare gender differences. Pearson’s correlation test was used to determine the relationships between DKI metrics and clinical parameters on recruitment and in follow-up period, respectively. Cox proportional models were used to analyze the association of DKI metrics and renal outcome. ROC analysis and corresponding area under the curve (AUC) statistics were applied to determine the discriminatory accuracy of the MRI parameters above, in terms of the diagnostic performance. DKI metrics were set as independent variables with the different endpoints (ESRD and eGFR decreasing ˃30%) as dependent variables. We figured out the optimal cutoff values to maximize the sum of sensitivity and specificity, calculated the AUC, Youden index and P-value of each curve. The difference in diagnostic performance was analyzed by comparing the ROC curves using Z-test. A two-tailed P ˂ 0.05 was considered statistically significant.
RESULTS
Baseline clinical, laboratory and radiological data
Forty-two patients with CKD were enrolled in our study. The baseline data were summarized in Table 1. There were 26 (61.9%) males and 16 (38.1%) females among them, with a mean age of 41.3 ± 15.4 years old on recruitment. The most common etiology was IgAN (26/42, 61.9%). The other etiologies included chronic glomerulonephritis (eight patients, 19.0%), diabetic nephropathy (one patient, 2.4%), hypertensive nephropathy (one patient, 2.4%) and chronic tubulointerstitial disease (one patient, 2.4%). There were also five patients (11.9%) with unknown etiologies. At baseline, the average eGFR was 45.3 ± 31.0 mL/min/1.73 m2 (range 7.1–115 mL/min/1.73 m2) and the average proteinuria was 3.0 ± 4.0 g/24 h (range 0.2–19.17 g/24 h). The patients were divided into two groups based on eGFR: a high eGFR group (eGFR ≥45 mL/min/1.73 m2) with 18 patients and a low eGFR group (eGFR <45 mL/min/1.73 m2) with 24 patients. No significant differences in age, gender, proteinuria and follow-up interval were observed between the two groups. As to the DKI values, significantly increased K values (0.68 ± 0.06 versus 0.61 ± 0.07, P = 0.002) and decreased ADC values (1.44 ± 0.15 versus 1.59 ± 0.18, P = 0.005) were detected in the low eGFR group compared with the high eGFR group. The median follow-up time was 43 months (range 24–44 months). During the follow-up period, all the patients received appropriate treatment according to the etiology and CKD classification. Besides supportive treatment and management of CKD complications, 21 patients (50%) had received corticosteroid and/or immunosuppressant treatment.
Baseline clinical and laboratory data, and DKI metrics
| Characteristics | Total | eGFR ≥45 mL/min/1.73 m2 | eGFR ˂45 mL/min/1.73 m2 | P-value |
|---|---|---|---|---|
| Demographic data | ||||
| No. of patients, % | 42 | 18 (42.9) | 24 (57.1) | – |
| Male/female | 26/16 | 12/6 | 14/10 | 0.582 |
| Age, years, mean ± SD | 41.3 ± 15.4 | 36.8 ± 15.9 | 44.9 ± 14.4 | 0.094 |
| Follow-up interval, months, median(IQR) | 43 (24–44) | 43 (42–44) | 35 (9–44) | 0.082 |
| Laboratory data, mean ± SD | ||||
| Serum creatinine, μmol/L | 224.4 ± 156.2 | 109.7 ± 31.4 | 310.5 ± 157.2 | ˂0.001** |
| eGFRa, mL/min/1.73 m2 | 45.3 ± 31.0 | 74.2 ± 24.1 | 23.6 ± 11.7 | ˂0.001** |
| Proteinuria, g/24 h | 3.0 ± 4.0 | 2.6 ± 4.7 | 3.3 ± 3.4 | 0.546 |
| DKI values, mean ± SD | ||||
| K | 0.65 ± 0.07 | 0.61 ± 0.07 | 0.68 ± 0.06 | 0.002** |
| D, 10−3 mm2/s | 3.10 ± 0.81 | 3.04 ± 0.75 | 3.14 ± 0.87 | 0.703 |
| ADC, 10−3 mm2/s | 1.50 ± 0.18 | 1.59 ± 0.18 | 1.44 ± 0.15 | 0.005** |
*P˂0.05, **P˂0.01.
Renal DKI metrics and clinical parameters
The correlation between DKI metrics and clinical data was demonstrated in Table 2. There were no significant correlations between age and DKI values. K and ADC values correlate with the levels of systolic blood pressure (SBP) (P = 0.041 for K values, P = 0.039 for ADC values), but no significant correlation between DKI values and the diastolic blood pressure (DBP). Both K and ADC values showed a linear correlation with eGFR on recruitment (P < 0.001). When eGFR decreased, K values increased and ADC values decreased. K values seemed to correlate with the amount of proteinuria (P = 0.022), but ADC values did not show this tendency. Regarding the follow-up data, the linear relationships between DKI metrics and eGFR slopes were demonstrated in Supplemental Figure 1. The K values correlated with the eGFR slopes (P = 0.011 and P = 0.010, respectively), significant correlations between ADC values and the eGFR slopes (P ˂ 0.001). K and ADC values were also well correlated with the eGFR of the last visit (P < 0.001). No significant correlations were found between D values and clinical data, either on recruitment or in follow-up.
Correlation analyses between the DKI metrics and clinical data
| DKI values (cortex) | K | D (10−3 mm2/s) | ADC (10−3 mm2/s) | |||
|---|---|---|---|---|---|---|
| r | P-value | r | P-value | r | P-value | |
| Baseline data | ||||||
| Age, years | 0.044 | 0.784 | 0.266 | 0.089 | −0.018 | 0.908 |
| SBP, mmHg | 0.317 | 0.041* | 0.105 | 0.509 | −0.320 | 0.039* |
| DBP, mmHg | 0.013 | 0.942 | 0.037 | 0.836 | 0.013 | 0.942 |
| Serum creatinine, μmol/L | 0.394 | 0.010** | −0.069 | 0.664 | −0.582 | ˂0.001** |
| eGFR, mL/min/1.73 m2 | −0.531 | ˂0.001** | −0.006 | 0.968 | 0.537 | ˂0.001** |
| Proteinuria, g/24 h | 0.352 | 0.022* | −0.225 | 0.153 | −0.299 | 0.054 |
| Follow-up data | ||||||
| eGFR slope (first–last time point) | −0.390 | 0.011* | 0.180 | 0.254 | 0.544 | ˂0.001** |
| eGFR slope (from regression) | −0.392 | 0.010* | 0.222 | 0.157 | 0.568 | ˂0.001** |
| Serum creatinine, μmol/L | 0.338 | 0.028* | 0.223 | 0.156 | −0.531 | ˂0.001** |
| eGFR, mL/min/1.73 m2 | −0.550 | ˂0.001** | 0.040 | 0.802 | 0.583 | ˂0.001** |
*P˂0.05, **P˂0.01.
Prognostic value of K and ADC value
Clinical and radiologic variables were tested for association with the progression outcome of eGFR loss of ˃30% and/or ESRD using Cox proportional hazard model. Unadjusted and multivariable adjusted HRs (hazard ratios) for endpoint of eGFR loss ˃30% were presented in Table 3. In univariate analysis, only baseline eGFR and ADC value were significantly associated with progression risk. After adjustment by age, gender and eGFR, lower ADC value was independently associated with a greater risk of eGFR loss (P = 0.003). Table 4 showed the HRs for endpoint as ESRD. Univariate analysis indicated that eGFR, K value and ADC value were significant risk factors. Both lower eGFR (P = 0.001) and ACD value (P = 0.001) independently predicted ESRD, adjusted by age, gender and K value in multivariable analysis. As to the composite endpoint (eGFR loss ˃30% or ESRD), the results were similar to the endpoint as ESRD (Table 5). Univariate analysis showed that eGFR, K value and ADC value were significantly associated with progression risk, and multivariable adjusted analysis demonstrated that lower eGFR (P = 0.001) and ADC value (P ˂ 0.001) were predictive factors for renal prognosis.
Cox proportional HR for eGFR loss ˃30% in CKD patients
| Variables | Unadjusted | Model 1a | Model 2b | Model 3c | ||||||||
|---|---|---|---|---|---|---|---|---|---|---|---|---|
| HR | 95% CI | P-value | HR | 95% CI | P-value | HR | 95% CI | P-value | HR | 95% CI | P-value | |
| Age | 1.016 | 0.978–1.056 | 0.406 | 1.041 | 0.989–1.096 | 0.124 | 1.030 | 0.987–1.076 | 0.174 | 1.004 | 0.958–1.051 | 0.877 |
| Gender | 0.602 | 0.159–2.272 | 0.454 | 0.816 | 0.204–3.254 | 0.773 | 0.616 | 0.161–2.358 | 0.479 | 0.703 | 0.173–2.862 | 0.623 |
| Proteinuria | 1.078 | 0.980–1.186 | 0.121 | – | – | – | – | – | – | – | – | – |
| eGFR | 0.963 | 0.931–0.996 | 0.029* | 0.964 | 0.927–1.002 | 0.062 | – | – | – | 0.964 | 0.931–0.998 | 0.038* |
| K value | 1.008 | 0.999–1.017 | 0.082 | – | – | – | – | – | – | – | – | – |
| ADC value | 0.991 | 0.986–0.997 | 0.002** | 0.989 | 0.981–0.996 | 0.003** | 0.990 | 0.984–0.996 | 0.002** | – | – | – |
Adjusted for age, gender, eGFR and ADC value.
Adjusted for age, gender and ADC value.
Adjusted for age, gender and eGFR. *P˂0.05, **P˂0.01.
Cox proportional HR for renal failure in CKD patients
| Variables | Unadjusted | Model 1a | Model 2b | Model 3c | Model 4d | ||||||||||
|---|---|---|---|---|---|---|---|---|---|---|---|---|---|---|---|
| HR | 95% CI | P-value | HR | 95% CI | P-value | HR | 95% CI | P-value | HR | 95% CI | P-value | HR | 95% CI | P-value | |
| Age | 0.995 | 0.960–1.031 | 0.786 | 0.968 | 0.925–1.014 | 0.171 | 1.016 | 0.964–1.071 | 0.547 | 1.015 | 0.964–1.068 | 0.578 | 1.010 | 0.952–1.072 | 0.734 |
| Gender | 0.983 | 0.321–3.008 | 0.976 | 0.866 | 0.259–2.899 | 0.816 | 0.686 | 0.177–2.653 | 0.300 | 1.344 | 0.395–4.571 | 0.636 | 0.278 | 0.048–1.598 | 0.151 |
| Proteinuria | 1.087 | 0.996–1.186 | 0.064 | – | – | – | – | – | – | – | – | – | – | – | – |
| eGFR | 0.904 | 0.856–0.955 | ˂0.001** | 0.905 | 0.857–0.956 | ˂0.001** | 0.889 | 0.831–0.952 | 0.001** | – | – | – | 0.848 | 0.772–0.931 | 0.001** |
| K value | 1.012 | 1.003–1.021 | 0.009** | 1.002 | 0.992–1.012 | 0.748 | – | – | – | 0.999 | 0.987–1.011 | 0.888 | 0.969 | 0.943–0.996 | 0.024* |
| ADC value | 0.987 | 0.981–0.993 | ˂0.001** | – | – | – | 0.981 | 0.970–0.992 | 0.001** | 0.986 | 0.978–0.993 | ˂0.001** | 0.973 | 0.957–0.988 | 0.001** |
Adjusted for age, gender, eGFR and K value.
Adjusted for age, gender, eGFR and ADC value.
Adjusted for age, gender, K and ADC value.
Adjusted for age, gender, eGFR, K and ADC value. *P˂0.05, **P˂0.01.
Cox proportional HR for composite endpoint in CKD patients
| Variables | Unadjusted | Model 1a | Model 2b | Model 3c | Model 4d | ||||||||||
|---|---|---|---|---|---|---|---|---|---|---|---|---|---|---|---|
| HR | 95% CI | P-value | HR | 95% CI | P-value | HR | 95% CI | P-value | HR | 95% CI | P-value | HR | 95% CI | P-value | |
| Age | 1.000 | 0.967–1.033 | 0.986 | 0.973 | 0.933–1.015 | 0.209 | 1.017 | 0.970–1.065 | 0.486 | 1.011 | 0.969–1.056 | 0.606 | 1.003 | 0.955–1.054 | 0.897 |
| Gender | 1.077 | 0.383–3.030 | 0.888 | 1.426 | 0.476–4.270 | 0.526 | 1.482 | 0.484–4.537 | 0.491 | 1.006 | 0.340–2.972 | 0.992 | 2.639 | 0.731–9.529 | 0.139 |
| Proteinuria | 1.071 | 0.983–1.167 | 0.116 | – | – | – | – | – | – | – | – | – | – | – | – |
| eGFR | 0.932 | 0.895–0.970 | 0.001** | 0.932 | 0.895–0.970 | 0.001** | 0.933 | 0.893–0.975 | 0.002** | – | – | – | 0.901 | 0.851–0.953 | 0.001** |
| K value | 1.010 | 1.002–1.018 | 0.015* | 1.001 | 0.993–1.010 | 0.752 | – | – | – | 0.997 | 0.987–1.007 | 0.565 | 0.977 | 0.960–0.994 | 0.008** |
| ADC value | 0.989 | 0.984–0.994 | ˂0.001** | – | – | – | 0.987 | 0.980–0.995 | 0.001** | 0.988 | 0.982–0.994 | ˂0.001** | 0.981 | 0.971–0.990 | ˂0.001** |
Adjusted for age, gender, eGFR and K value.
Adjusted for age, gender, eGFR and ADC value.
Adjusted for age, gender, K and ADC value.
Adjusted for age, gender, eGFR, K and ADC value. *P˂0.05, **P˂0.01.
Diagnostic performance for predicting renal outcome
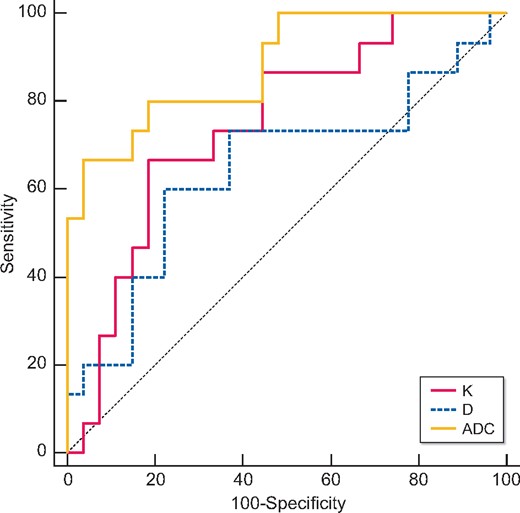
Table 6 and Figures 2–4 showed the results of the ROC analysis of the DKI parameters for discriminating the renal outcome. When the endpoint was set as ESRD, the AUCs for the K, D and ADC values were 0.780 (95% CI 0.625–0.893, P = 0.0006), 0.698 (95% CI 0.504–0.891, P = 0.045) and 0.936 (95% CI 0.858–1.000, P ˂ 0.0001), respectively. Excellent discrimination existed for K and ADC. When the optimal cutoff values of 0.67 (K) and 1.45 × 10⁻³ mm2/s (ADC) were used, sensitivity values of 76.92 and 92.31%, respectively, and specificity values of 82.76 and 82.76%, respectively, can be achieved. Regarding the pairwise comparison of ROC curves, there were significant differences between K and ADC (P = 0.0252) and between D and ADC (P = 0.0203). Although the AUC of K is larger than that of D, the level of statistical significance was not achieved (P = 0.5442; Figure 2). As to the endpoint as eGFR loss ˃30%, ADC showed better capability for discrimination [AUC = 0.730 (95% CI 0.571–0.889, P = 0.0045)]. The pairwise comparison showed no significant difference among K, D and ADC (Figure 3). Concerning the composite endpoint, the results were also similar to the endpoint as ESRD. When the optimal cutoff values of 0.67 (K) and 1.34 × 10⁻³ mm2/s (ADC) were used, sensitivity values of 66.67% and specificity values of 81.48 and 96.3%, respectively, can be achieved (Table 6). The pairwise comparison demonstrated significant differences between K and ADC (P = 0.0417) and between D and ADC (P = 0.0126) (Figure 4).
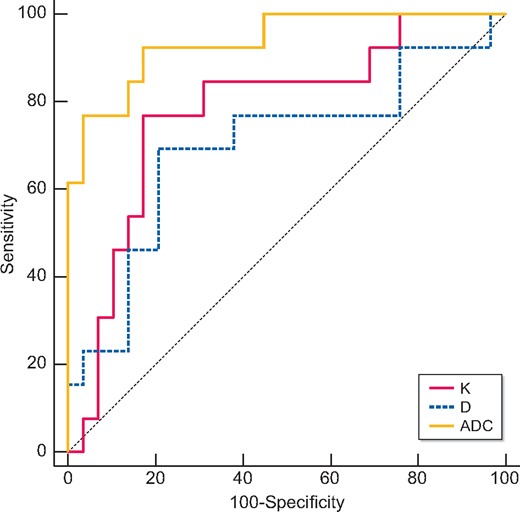
Validity of K, D and ADC in discriminating the renal outcome between with and without ESRD. Excellent discrimination existed for K and ADC. Regarding the pairwise comparison of ROC curves, there were significant differences between K and ADC (P = 0.0252) and between D and ADC (P = 0.0203).
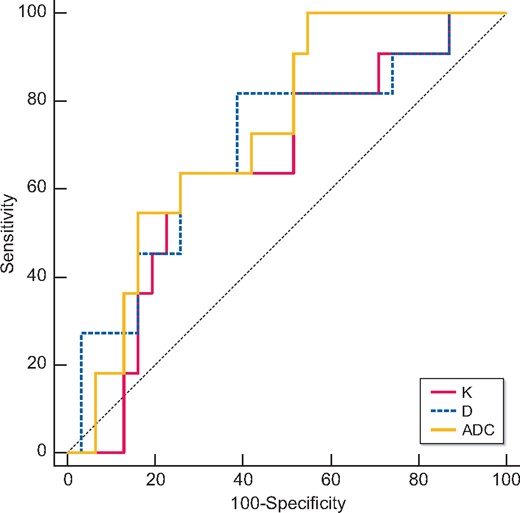
Validity of K, D and ADC in discriminating the renal outcome between with and without eGFR loss of ˃30%. Excellent discrimination existed for ADC. Regarding the pairwise comparison of ROC curves, the AUC of ADC was larger than those of K and D. There were no significant differences among K, D and ADC.
Validity of K, D and ADC in discriminating the renal outcome between with and without the composite endpoint (ESRD or eGFR loss of ˃30%). Excellent discrimination existed for K and ADC. Regarding the pairwise comparison of ROC curves, there were significant differences between K and ADC (P = 0.0417) and between D and ADC (P = 0.0126).
ROC analysis to evaluate the predictive performance of K, D and ADC for discriminating different renal outcomes
| Parameters | AUC | Threshold | Sensitivity (%) | Specificity (%) |
|---|---|---|---|---|
| ESRD | ||||
| K | 0.780 | ˃0.67 | 76.92 | 82.76 |
| D | 0.698 | ≤2.60 × 10⁻³ mm2/s | 69.23 | 79.31 |
| ADC | 0.936 | ≤1.45 × 10⁻³ mm2/s | 92.31 | 82.76 |
| eGFR loss ˃30% | ||||
| K | 0.648 | ˃0.67 | 63.64 | 74.19 |
| D | 0.698 | ≤2.86 × 10⁻³ mm2/s | 81.82 | 61.29 |
| ADC | 0.730 | ≤1.57 × 10⁻³ mm2/s | 100.00 | 45.16 |
| Composite endpoint (ESRD or eGFR loss ˃30%) | ||||
| K | 0.746 | ˃0.67 | 66.67 | 81.48 |
| D | 0.647 | ≤2.60 × 10⁻³ mm2/s | 60.00 | 77.78 |
| ADC | 0.881 | ≤1.34 × 10⁻³ mm2/s | 66.67 | 96.3 |
DISCUSSION
Our study demonstrated that the non-Gaussian DKI model was a potential method to evaluate and monitor renal fibrosis in CKD patients. Renal K and ADC obtained from DKI were highly correlated with renal function on recruitment, eGFR slope and eGFR of the last visit in follow-up. As a noninvasive digital biomarker, ADC value from DKI model independently predicted the progression of CKD.
CKD arises from many heterogeneous disease pathways that alter the function and structure of the kidney irreversibly [14]. Despite different etiologies, the final common pathologic manifestation of CKD is renal fibrosis, which is consistently the strongest predictor of renal survival [15]. Currently, renal biopsy is still widely adopted as a gold standard to evaluate the extent of renal fibrosis [16], but this technique has several limitations. It is invasive, with ensuing complications [17], and the sampled tissue may not be representative of the whole picture of the kidney. Moreover, it is not practical for longitudinal follow-up.
Recently, more advanced imaging techniques showed promise for noninvasive assessment of renal fibrosis. DWI has been widely used to assess renal pathology in CKD patients [8, 18], which could noninvasively measure the water diffusivity in living tissues based on the assumption that water diffusion exhibits Gaussian behavior and the diffusion-weighted signal monoexponentially decays with the increase of b-values [19]. Diffusion MRI was reliable for renal fibrosis follow-up, even earlier than the decline of renal function [20]. However, water diffusion behavior in biologic tissues is much more complicated due to the complex cellular structure with diffusion barriers, like cell membranes. DKI is an extension of conventional DWI, first described by Jensen et al. [10], which is a polynomial model requiring ultra-high b-values (>1000 s/mm2) and a modified image post-processing procedure. Based on the features described above, DKI can quantify non-Gaussian water diffusion and detecting microstructural changes in biological tissues [21, 22].
DKI can yield two characteristic variables: K and D. K quantifies the deviation of tissue diffusion from a Gaussian pattern, and D is the diffusion coefficient corrected by a non-Gaussian bias [10, 22]. Pentang et al. first applied DKI to the healthy human kidney in 2014, which indicated its feasibility in human kidney with an adequate signal-to-noise ratio [23]. In the same year, a center in China also reported the preliminary DKI measurement of the healthy human kidney with larger sample size [24]. Although with opposite results for K and D, it promised the value of DKI in kidney disease. In 2016, Kjølby et al. first proved that DKI was feasible for evaluating renal fibrosis in a mouse model [25]. With regard to the application of DKI in kidney disease patients, we have proved that DKI is able to assess renal fibrosis in IgAN [11]. K and ADC values obtained from DKI were not only correlated with the eGFR, but also associated with the extent of histologic fibrosis. Further ROC analysis demonstrated that K performed better in discriminating severe glomerulosclerosis; and ADC performed better in identifying severe tubular atrophy/interstitial fibrosis. Recent research also reported the role of DKI in the functional and pathological assessment of CKD patients in a larger cohort with healthy control, which showed that DKI could offer better diagnostic performance than DWI [26]. However, research on the role of DKI as an imaging biomarker for predicting renal prognosis is still lacking. As far as we know, this study is the first to investigate the prognostic value of DKI in CKD patients.
We observed that K from the DKI model increased with the deterioration of renal function in CKD patients, which was similar to our former study in IgAN. More importantly, this study demonstrated that a high level of K was associated with renal function decline in CKD patients. K was supposed to represent the direct interaction of water molecules with the cell membrane and intracellular compounds [22], which increased when the tissue had more irregular and heterogeneous environments with many large interfaces. With the progression of CKD, the progressive loss of glomerular capillary structures and the disappearance of glomerular cellular elements with replacement by an expanding ECM and fibrous tissue could result in a more complex microstructure and marked variation in cell size and shape than in normal kidneys, leading to increased K. Based on the results of our previous study, we speculated that a high level of K value may be associated with more severe glomerulosclerosis, which resulted in worse kidney outcomes. The K value has a negative correlation with eGFR slopes and eGFR of the last visit. These results suggested that the K value in the DKI model had potential value in grading the severity of renal sclerosis for additional information to ADC. However, in a multivariate analysis, it did not show superior predictive capability than the eGFR and ADC values, which was more sensitive to the tubules and interstitium fibrosis proved in our previous study [11].
The ADC value was also significantly correlated with renal function in CKD patients, which was in the opposite direction of the K value. This result was consistent with the results of previous DWI studies [8, 18, 27]. In terms of predictive efficacy of prognosis, ADC value also showed good performance. ADC is a measure of water diffusivity that comprises the effect of capillary perfusion and the random Gaussian motion of molecules restricted in tissues [7]. The results of our study suggested that a low level of ADC was not only associated with progressive renal fibrosis, but also with the decreased perfusion due to the progression of CKD, both of which were predictive of worse renal outcomes. Our previous study showed that the extent of tubular atrophy/interstitial fibrosis had more influence on ADC, which may be explained by the decreased perfusion and water transport [11]. The multivariate Cox regression showed that ADC value was the independent predictive factor of eGFR loss ˃30% and/or ESRD, even after adjustment by eGFR and K value. We assumed the reason was that ADC was more sensitive to the lesions of tubules and interstitium, which contributed more to renal fibrosis and prognosis. The result showed that baseline ADC value had the potential to predict the clinical outcome of kidney in CKD patients. Further studies with larger sample sizes are needed to confirm this result, and basic research is also required to determine the precise mechanism of this process.
Different from the conventional method with b-values of 0 and 800 s/mm2 by the mono-exponential model, the ADC maps in our study were calculated according to the conventional mono-exponential diffusion model by multiple b-values with the maximum b-value of 1600 s/mm2. DWI with ultrahigh b-value has been studied in various diseases to improve lesion discernibility, such as prostate cancer [28], neurological disorders [29] and other oncological diseases [30, 31]. For low b-values, T2-weighted effects and tissue perfusion impeded the specificity of the images. When using higher b-values, cellularity and tissue complexity have increased influence on the images, with the effect of tissue perfusion reduced [32]. Although ADC maps could be generated by two b-values, more b-values could give more accurate ADC values [33]. As diffusion occurs in a non-Gaussian fashion at ultrahigh b-values [10], ADC data might be more confident when using multiple b-values [34]. So, we presumed that ADC maps generated in this optimized way might be more sensitive to kidney lesions, which still needs further study to confirm.
In terms of the predictive efficacy, both K and ADC showed clinical potential for the prediction of renal prognosis. ADC performed better than K and D with a relatively larger AUC and stronger correlation, regardless of whether the endpoint was set as eGFR loss ˃30%, ESRD or the composite endpoint. The cut-off values of K and ADC for predictive efficacy of ESRD were similar to the cut-off values of those for diagnostic efficacy in our previous work, which suggested that renal fibrosis was closely correlated with renal prognosis and the DKI model was stable.
There are some limitations of our study. First, the sample size of our study is still relatively small considering of the complexity of CKD. Further studies with larger sample size are needed to validate our results in the future. Second, our study included a relatively short follow-up period, with a median of 43 months, which was not long enough to observe the natural history of CKD. We will extend the follow-up period to more than 10 years to examine the endpoint of ESRD in this group of patients. Third, in evaluating the correlation between renal function and DKI metrics, we did not use measured GFR with more accuracy than eGFR, which needs improvement in future work. Fourth, there were no special preparatory measures of patients prior to the examination, such as hydration or fasting, which may result in bias. However, no clinical signs of overhydration (e.g. peripheral edema, jugular venous distension and high blood pressure) or dehydration were noted in the participants. Fifth, we have excluded the patients with comorbidities that affected the volume or the components of the kidney, and this is a limitation of radiologic techniques in clinical routine.
In conclusion, a new, noninvasive DKI model was closely associated with the renal function in CKD patients. Renal ADC values obtained from DKI showed significant predictive value for the prognosis of CKD, which could be a promising noninvasive technique in patient follow-up.
ACKNOWLEDGEMENTS
We thank Dr Thomas Benkert and Dr Robert Grimm, from MR Application Development, Siemens Healthcare GmbH, Erlangen, Germany, for the development of the sequence and post-processing software.
FUNDING
This work was partially supported by grants from the National Natural Scientific Foundation of China (81970607, 81470937 to L.C.); the Key Research and Development Program of Ningxia Hui Autonomous Region (2018BFG02010 to L.C.); Capital’s Funds for Health Improvement and Research (CFH 2020-2-4018 to L.C.); Beijing Natural Science Foundation (L202035 to L.C., 7192176 to H.S.); CAMS Innovation Fund for Medical Sciences (CIFMS 2020-I2M-C&T-A-001 to L.C.); the Capital Specialized Clinical Application Project (Z171100001017196 to L.C.); Chinese Academy of Medical Sciences Innovation Fund for Medical Sciences (CIFMS 2016-I2M-2-004 to L.C.); and National Key-point Research Program Precision Medicine Grant (2016YFC0901500 to L.C.); the Capital Exemplary Research Wards Project (BCRW202001 to L.C.); the Peking Union Medical College Hospital Youth Science Foundation (pumch201910804 to Y.L.). The funders had no role in study design, data collection and analysis, decision to publish or preparation of the manuscript.
AUTHORS’ CONTRIBUTIONS
L.C. and H.S. are guarantors of the integrity of the entire study. L.C., H.S. and X.L. were responsible for study concepts and design. Literature research was conducted by Y.L. and G.-M.-Y.Z. Clinical studies were conducted by Y.L., G.-M.-Y.Z. and X.P. Y.L. was involved in statistical analysis and manuscript preparation. Manuscript editing was conducted by L.C. and H.S.
DATA AVAILABILITY STATEMENT
The data underlying this article will be shared on reasonable request to the corresponding author.
REFERENCES
Author notes
Yan Liu, Gu-Mu-Yang Zhang, contributed equally to this study.
None declared.


Comments