


ABSTRACT
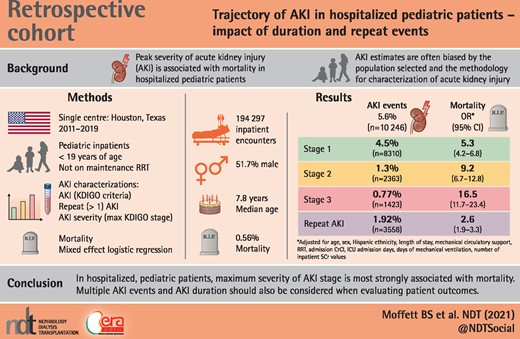
Peak severity of acute kidney injury (AKI) is associated with mortality in hospitalized pediatric patients. Other factors associated with AKI, such as number of AKI events, severity of AKI events and time spent in AKI, may also have associations with mortality. Characterization of these events could help to evaluate patient outcomes.
Pediatric inpatients (<19 years of age) from 2011 to 2019 who were not on maintenance renal replacement therapy and had least one serum creatinine (SCr) obtained during hospital admission were included. Percent change in SCr from the minimum value in the prior 7 days was used for AKI staging according to Kidney Disease: Improving Global Outcomes (KDIGO) criteria. Maximum value for age appropriate normal was used for patients with only one SCr. Repeat AKI events were classified in patients if KDIGO criteria were met more than once with at least one SCr value between episodes that did not meet KDIGO criteria. Patient demographics were summarized and incidence of AKI was determined along with associations with mortality. AKI characterizations for the admission were developed including: AKI, repeat (more than one) AKI, AKI severity (maximum KDIGO stage) and total number of AKI events. AKI duration as percent admission days in a KDIGO stage and AKI percent velocity were determined. Kaplan–Meier analysis was performed for time to 30-day survival by AKI characterization. A mixed-effects logistic regression model with mortality as the dependent variable nested in patients was developed incorporating patient variables and AKI characterizations.
A total of 184 297 inpatient encounters met study criteria [male 51.7%, age 7.8 years (interquartile range 2.5–13.8) and mortality 0.56%]. Hospital length of stay was 1.9 days (IQR 0.37, 4.8 days), 15.4% had an intensive care unit admission and 12.2% underwent mechanical ventilation. AKI occurred in 5.6% (n = 10 246) of admissions [Stage 1, 4.5% (n = 8310); Stage 2, 1.3% (n = 2363); Stage 3, 0.77% (n = 1423)] and repeat AKI events occurred in 1.92% (n = 3558). AKI was associated with mortality (odds ratio 6.0, 95% confidence interval 4.8–7.6; P < 0.001) and increasing severity (KDIGO maximum stage) was associated with increased mortality. Multiple AKI events were also associated with mortality (P < 0.001). Duration of AKI was associated with mortality (P < 0.001) but AKI velocity was not (P > 0.05).
AKI occurs in 5.6% of the pediatric inpatient population and multiple AKI events occur in ∼30% of these patients. Maximum KDIGO stage is most strongly associated with mortality. Multiple AKI events and AKI duration should also be considered when evaluating patient outcomes.
INTRODUCTION
Key Learning Points
What is already known about this subject?
acute kidney injury (AKI) in hospitalized pediatric patients is associated with increased mortality; and
AKI estimates are often biased by the population selected for study and the methodology for characterization of AKI.
What this study adds?
this is the largest descriptive study of AKI in hospitalized pediatric patients using the 7-day component of the Kidney Disease: Improving Global Outcomes guideline;
bias was minimized by using age related normal for patients with only one serum creatinine for a more accurate assessment of AKI; and
multiple AKI events often occur in hospitalized pediatric patients. Number of AKI events and the duration of the AKI are associated with mortality.
What impact this may have on practice or policy?
multiple AKI events and duration of AKI should be incorporated into assessments of patient clinical status; and
guideline development for prevention of AKI should include evaluation and assessment of multiple events and duration.
Acute kidney injury (AKI) is a major comorbidity in hospitalized pediatric patients and occurs in approximately 12–40% of the population [1–4]. The large variability in the incidence of AKI in the hospitalized pediatric population can be attributed to varying patient populations studied with differing acuity of illness, but is also likely due to the inconsistent definitions of AKI used for characterization [5]. The Kidney Disease: Improving Global Outcomes (KDIGO) definition for AKI is the current proposed standard for assessing AKI in the pediatric population [6]. However, subtle variations within the KDIGO definition have also occurred, including the precise definition of baseline serum creatinine (SCr) value. Prior publications have used either an SCr value that was obtained in the prior 3 months or the first SCr value obtained on admission, both of which could result in differing characterizations of AKI epidemiology as compared with the recommended use of a SCr obtained in the prior 7 days [6]. This variability can lead to inaccurate characterization of incidence and impact of AKI on morbidity and mortality.
The current literature has largely focused on maximum stage of AKI and its association with mortality. While the peak degree of kidney injury is important, other factors in the description of AKI may also contribute to adverse outcome associations. The duration of AKI, while not highlighted as concisely as severity, is likely also very important, even in cases with kidney recovery. Based on our clinical experience, patients may have more than one AKI ‘event’ during hospitalization, particularly in prolonged hospitalizations. Sustained elevations of SCr signal longer AKI duration, which can be quantified as a portion of the length of stay in hospitalized patients. Finally, how rapidly patients reach a maximum AKI stage from a baseline SCr (AKI velocity) has never been characterized and may be associated with mortality. Identification and characterization of these various dimensions associated with AKI and KDIGO staging may be useful in understanding the impact of AKI in the hospitalized pediatric patient.
The primary aim of this investigation is to characterize the epidemiology of AKI, including the incidence of multiple AKI events, in the hospitalized pediatric patient using the KDIGO definition of change in SCr from the prior 7 days for AKI. Secondary aims include evaluating the association of AKI with mortality, including the association of multiple AKI events, maximum KDIGO stage, duration of AKI as time spent in AKI and velocity of AKI.
MATERIALS AND METHODS
A retrospective descriptive study was designed and institutional review board approval was obtained from Baylor College of Medicine. Texas Children’s Hospital is a large, quaternary care center with three hospitals in and around the Houston, Texas area that contribute to the dataset. The hospital electronic medical record was queried from 1 January 2011 to 31 December 2019 for every SCr value obtained from a patient.
Patients were included in the study if they were admitted to the hospital and had at least one SCr obtained while admitted as an inpatient. All SCr values were IDMS traceable and the methodology for laboratory analysis was maintained throughout the study period. Exclusion criteria consisted of: patients >19 years of age, patients <16 days of age (due to influence of maternal SCr), patients admitted to the obstetrics, maternal–fetal medicine or fetal services, and patients undergoing maintenance renal replacement therapy or plasmapheresis at admission. Patient SCr values were excluded if they were obtained during renal replacement therapy or mechanical circulatory support, and these values were not used for ascertainment of KDIGO stage.
Data collection included: patient age, sex, ethnicity, weight, height, SCr, date and time of SCr collection, admission/discharge date and time, use of renal replacement therapy, use of mechanical circulatory support, intensive care unit admission, use of mechanical ventilation and hospital mortality. Patients with missing height values had median values imputed based upon age and gender. SCr values below the lower limit of detection (0.15 mg/dL) were considered to be 0.1 mg/dL for calculation of KDIGO stage. Creatinine clearance was estimated by the modified Schwartz equation [7].
AKI was categorized based on the KDIGO criteria, including the criteria for initiation of renal replacement therapy and an estimated creatinine clearance <35 mL/min/1.73 m2, but not including urine output data [6]. Percent change in SCr from the minimum SCr value in the prior 7 days was used for staging AKI (Supplementary data, Appendix I). For patients with only one SCr value, the maximum value for age-appropriate normal was used as baseline for calculation of KDIGO stage [8]. Multiple AKI events were adjudicated in patients when change in SCr from minimum value in the prior 7 days resulted in KDIGO criteria attainment with subsequent SCr values chronologically between KDIGO stages that that did not fulfill KDIGO criteria.
Characterizations of AKI for the admission were developed and the strength of their association with mortality was evaluated. AKI characterizations evaluated in association with mortality included: presence of AKI (yes/no), repeat AKI event (yes/no), AKI severity (maximum KDIGO stage for the admission Stages 1, 2 or 3), early onset (≤3 days after admission) as compared with late onset AKI (>3 days after admission) and total number of AKI events. Two new variables were also developed to describe AKI in the population: (i) duration of AKI (percent admission days with a SCr value categorized in a KDIGO stage) and (ii) velocity of AKI. Velocity of AKI was calculated as the time (h) from the minimum SCr in the prior 7 days to the maximum percent change in SCr from that value (percent change in SCr/h).
Descriptive statistical methods [mean and standard deviation; median and interquartile range (IQR)] were used to characterize the patient population, based on normality of distribution, and determine the overall incidence of AKI and the incidence of multiple AKI events during a patient admission. Comparisons between mortality groups were evaluated with Student’s t-test, Wilcoxon rank-sum test and Fisher’s exact test as the data dictated. Kaplan–Meier analysis was performed for time to 30-day mortality for each of the AKI characterizations (any AKI, repeat AKI event, AKI severity and total number of AKI events) with log-rank test with censoring points as discharge (alive/dead). Total number of admissions meeting study criteria was the denominator for all calculations.
A mixed-effects logistic regression model nested in patients with mortality as the dependent variable was developed. The following variables were incorporated into the model and were assessed based on the presence during the admission: age at admission, sex, Hispanic ethnicity, length of stay, mechanical circulatory support (yes/no), renal replacement therapy (yes/no), estimated creatinine clearance at admission, intensive care unit admission days, days of mechanical ventilation and number of SCr values during the admission. The number of SCr values obtained during the admission was included in the model to adjust for severity of illness and variability of monitoring practices. The AKI characterizations developed, along with AKI duration and velocity, were individually placed into the logistic regression model and assessed for their strength of association with mortality. All data analyses were performed with Stata IC version 12 (StataCorp., College Station, TX, USA). A P < 0.05 was considered statistically significant a priori.
RESULTS
Demographics
The initial query of the electronic medical record resulted in 1 480 701 SCr values. After application of inclusion criteria, the final dataset comprised 184 297 admissions (99 917 patients) with 626 885 SCr values and 952 935 total patient admission days (Supplementary data, Appendix II). Encounters with no SCr values, one SCr value and more than one SCr values were described. (Supplementary data, Appendix III).
Demographics for the study population (n = 184 297) are summarized in Table 1. Hospital length of stay was median (IQR) 1.9 days (0.37–4.8 days) and 15.4% (n = 28 416) were admitted to an intensive care unit during the admission for a median (IQR) 3 days (2–7 days). Mechanical circulatory support was used in 0.12% (n = 212), renal replacement therapy was initiated in 0.85% (n = 1570) (hemodialysis 0.71%, continuous renal replacement therapy 0.12% and peritoneal dialysis 0.37%) and mechanical ventilation in 12.2% (n = 22 466) admissions.
Patient admission demographics
| Category | Result (n = 184 297) |
|---|---|
| Male, % | 51.7 |
| Age, median (IQR), years | 7.8 (2.5–13.8) |
| Hispanic, % | 42.2 |
| Weight, median (IQR), kg | 25.4 (13.1–50.8) |
| Height, median (IQR), cm | 116 (80–152) |
| Mortality, % | 0.56 |
| Category | Result (n = 184 297) |
|---|---|
| Male, % | 51.7 |
| Age, median (IQR), years | 7.8 (2.5–13.8) |
| Hispanic, % | 42.2 |
| Weight, median (IQR), kg | 25.4 (13.1–50.8) |
| Height, median (IQR), cm | 116 (80–152) |
| Mortality, % | 0.56 |
Each encounter had a median (IQR) 1 (1–2) SCr values obtained during an admission. First SCr on admission and creatinine clearance was 0.40 mg/dL (IQR 0.30–0.57) and 115 ± 45 mL/min/1.73 m2, respectively, and was drawn on median (IQR) Day 1 of admission (1–1). Final SCr and creatinine clearance prior to discharge, for patients not discharged on renal replacement therapy, were 0.40 (IQR 0.30–0.54) and 120 ± 46 mL/min/1.73 m2. A total of 20.8% (n = 37 781) encounters, not discharged on renal replacement therapy, were discharged with an estimated creatinine clearance <90 mL/min/1.73 m2, 7.1% (n = 12 909) with an estimated creatinine clearance <60 mL/min/1.73 m2 and 1.5% (n = 2677) with an estimated creatinine clearance <30 mL/min/1.73 m2.
AKI incidence
AKI occurred at least once in 5.6% (n = 10 246) of admissions [Stage 1, 4.5% (n = 8310); Stage 2, 1.3% (n = 2363); Stage 3, 0.77% (n = 1423)] and the overall incidence of AKI in the dataset was 22.0 events/1000 patient admission days. More than one AKI event occurred in 1.92% (n = 3558) of total admissions and the median (IQR) number of AKI events in patients with AKI was 1 (1–2). Intensive care unit admissions had a higher incidence of AKI (20.9%) as compared with non-intensive care unit admissions (2.8%). When only encounters with multiple SCr measurements were included (n = 63 475), the incidence of AKI was 16.0% (n = 10 176) [Stage 1, 12.9% (n = 8310); Stage 2, 3.7% (n = 2363); Stage 3, 2.2% (n = 1423)]; 5.6% (n = 3558) had multiple AKI events per admission.
The maximum KDIGO stage reached per patient admission was: Stage 1, 3.70% (n = 6828); Stage 2, 1.14% (n = 2098); Stage 3, 0.72% (n = 1320). The maximum SCr and minimum estimated creatinine clearance for KDIGO classification was median (IQR) 0.41 mg/dL (0.30–0.59) and 111 ± 42 mL/min/1.73 m2 and occurred on median (IQR) Day 1 (1–1). A portion of admissions with KDIGO Stage 1 also had a separate discrete KDIGO Stage 2 (n = 1228, 14.6%) or Stage 3 (n = 646, 7.7%) event. Similarly, admissions with KDIGO Stage 2 also had a separate and discrete Stage 3 (n = 290, 12.3%) event and 243 admissions experienced all three KDIGO stages as discrete events. Early onset AKI (≤3 days after admission) occurred in 27.6% (n = 2830) of encounters with AKI.
Median (IQR) AKI duration was 2 (1–5) days. Velocity of AKI, defined as percent change from minimum SCr in the prior 7 days to maximum SCr divided by hours between the two values, was 0.74%/h (IQR 0.47–1.47%/h) in patients with AKI.
Association of AKI with mortality
Encounters with AKI had a greater incidence of mortality (0.25% versus 5.7%, P < 0.001) and maximum KDIGO stage for the admission was associated with mortality (P < 0.001) (Figure 1). Early onset AKI (≤3 days after admission) was less likely to be associated with mortality as compared with late onset (4.6% versus 6.1%, P = 0.004).
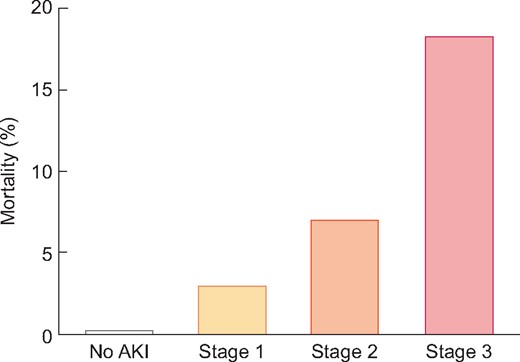
Association of maximum KDIGO stage with mortality. The incidence of mortality stratified by maximum KDIGO stage. The incidence of mortality increases with each categorized stage.
Patients who died had a higher number of AKI events than those who survived [median 1 (IQR 1–2) versus 2 (IQR 1–4), P < 0.001] (Table 2). There was an association with number of AKI events and mortality when stratified by maximum KDIGO stage (P < 0.001) (Figure 2). Differences in patient and hospital variables were associated with single as compared with repeat AKI event per admission (Table 2).
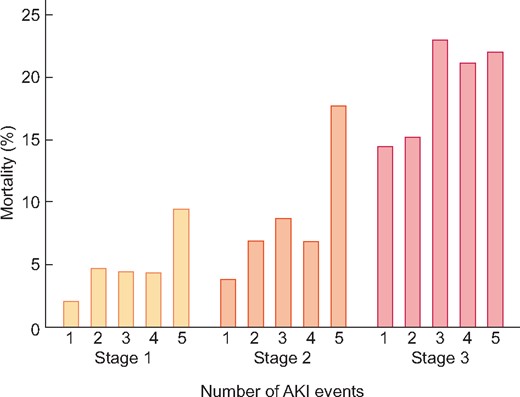
Association of mortality with number of AKI events per maximum KDIGO stage. The incidence of mortality associated with multiple AKI events within each KDIGO stage. Overall mortality is greater in each KDIGO stage and within each stage as AKI events increase.
Comparison of multiple AKI events
| Category (n = 10 246) | One AKI event (n = 6688) | Repeat AKI (n = 3558) | P-value |
|---|---|---|---|
| Male, % | 54.5 | 53.9 | 0.56 |
| Age, median (IQR), years | 5.6 (1.5, 13.0) | 4.1 (0.99, 11.3) | <0.001 |
| Hispanic, % | 43.5 | 44.6 | 0.32 |
| Length of stay, median (IQR), days | 10.5 (5.9, 18.8) | 31.9 (17.7, 58.1) | <0.001 |
| Intensive care unit admission, % | 51.0 | 71.2 | <0.001 |
| Mechanical ventilation, % | 40.5 | 61.9 | <0.001 |
| Mechanical circulatory support, % | 0.61 | 3.3 | <0.001 |
| Renal replacement therapy, % | 3.8 | 12.9 | <0.001 |
| Mortality, % | 3.6 | 9.8 | <0.001 |
Duration of AKI was greater in patients who expired during the admission as compared with those who did not expire (median 4, IQR 2–11 days versus median 2, IQR 1–4 days, P < 0.001). This association was maintained significance when duration of AKI was stratified by KDIGO stage (P < 0.05 for all stages). Percent velocity of AKI attainment was greater in patients who expired [1.13 (IQR 0.63–2.37) versus 0.72 (IQR 0.46–1.41), P < 0.001], but this association did not maintain significance when AKI status was stratified by KDIGO stage (P > 0.05). Kaplan–Meier analysis demonstrated differences in 30-day survival in patients with AKI (log-rank <0.001), in patients with one AKI event (log-rank <0.001), by number of AKI events (log-rank <0.001) and by maximum KDIGO stage (log-rank <0.001) (Figure 3).
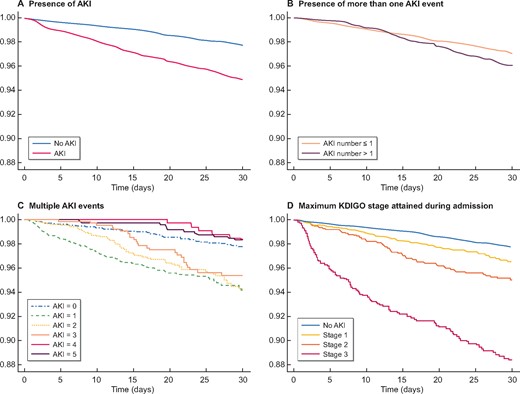
Kaplan–Meier graphs for 30-day survival by AKI characterizations. Kaplan–Meier analyses of survival based upon AKI characterization. The presence of AKI (upper left corner) as compared with no AKI was associated with decreased time to inpatient mortality, as was the presence of more then one AKI event (upper right corner). However, multiple AKI events (bottom left corner) were not associated with decreased time to mortality more than three AKI events per admission. Maximum KDIGO stage attained during admission (bottom right corner) was associated with mortality for each of the stages in comparison with no AKI.
A mixed-effects multivariable logistic regression model with mortality as the dependent variable nested in patient was developed. The initial base model consisted of the following variables: gender, ethnicity, age, length of stay, ventilator days, intensive care unit days, estimated creatinine clearance on admission, number of SCr values drawn per admission, peritoneal dialysis, hemodialysis, continuous renal replacement therapy, mechanical circulatory support, percent time in KDIGO stage and percent velocity of AKI (Supplementary data, Appendix IV).
The AKI characterizations that were developed (any AKI, more than one AKI event, maximum KDIGO stage and total number of AKI events) were included in the base model individually and strength of association with mortality was evaluated (Table 3). Maximum KDIGO stage maintained the strongest association with mortality (P < 0.001). With each inclusion of an AKI characterization into the model, percent time in a KDIGO stage maintained a positive relationship with mortality, with odds ratio (OR) ranging from 1.02 to 1.05 (P < 0.05), suggesting a 2–5% increase in odds of mortality with each day in a KDIGO stage. Percent velocity did not attain statistical significance in any iteration of the model (P > 0.05).
AKI characterizations and strength of association with mortality
| Category (n = 184 297) | Incidence of AKI characterization (%) | OR (mortality) | 95% CI | P-value |
|---|---|---|---|---|
| Any AKI | 5.6 | 6.0 | 4.8–7.6 | <0.001 |
| Maximum KDIGO stagea | ||||
| Stage 1 | 3.7 | 5.3 | 4.2–6.8 | <0.001 |
| Stage 2 | 1.1 | 9.2 | 6.7–12.8 | <0.001 |
| Stage 3 | 0.72 | 16.5 | 11.7–23.4 | <0.001 |
| Repeat AKI eventsb | 1.9 | 2.6 | 1.9–3.3 | <0.001 |
| Total number of AKI eventsc | ||||
| 1 | 3.62 | 5.3 | 4.1–6.8 | <0.001 |
| 2 | 0.95 | 7.3 | 5.3–10.0 | <0.001 |
| 3 | 0.37 | 7.4 | 4.8–11.2 | <0.001 |
| 4 | 0.20 | 6.0 | 3.5–10.4 | <0.001 |
| ≥5 | 0.74 | 4.9 | 2.9–8.4 | <0.001 |
In comparison with referent value of no KDIGO stage; bin comparison with referent value of 1 or 0 AKI events; cin comparison with referent value of 0 AKI events—a maximum of five events was chosen as this represented 99.7% of the events in the study population. CI, confidence interval.
DISCUSSION
The novel aspects of this investigation include the incorporation of the 7-day stipulation for baseline SCr as recommended in the KDIGO guidelines and the development of novel descriptors for assessment of pediatric AKI. The identification and characterization of multiple AKI events are unique to this manuscript, as is the development and evaluation of two new metrics (AKI duration and velocity) for assessing AKI-associated mortality. Additionally, we have incorporated the use of an age-appropriate normal to minimize the bias associated with multiple SCr sampling in critical illness.
Multiple investigations have utilized minimum SCr values in the prior 3 months, which could result in overestimation of AKI, due to growth and the potential for increased SCr prior to admission [1, 9]. Others have only utilized SCr on admission, which would result in underestimation of AKI, due to frequent elevation of SCr on admission in critically ill patients [5]. By limiting the epoch of evaluation to 7 days as originally recommended in the KDIGO guidelines, we have been able to characterize AKI per the current KDIGO definition. We recognize that this is a very sensitive method for assessment of AKI. Prospective investigations of AKI have used a return to baseline SCr of 5 days or more before a second AKI could be assessed. The impact of added AKI to a current AKI ‘event’, which was characterized in our study, is unique and should spur further investigation into the criteria for baseline SCr when evaluating AKI.
It is evident from the current investigation that restriction of patients to only those with more than one SCr available for AKI assessment skews the patient population to increased acuity and inflates the incidence of AKI. The patient population with only one available SCr closely resembles the patient population for which no SCr values were obtained, suggesting a similar incidence of AKI in the non-critically ill hospitalized pediatric population. Use of a validated age-based normal for baseline SCr or the minimum SCr in the prior 7 days should be considered when assessing AKI in the hospitalized pediatric population [8].
We have identified that 5.6% of pediatric hospital admissions will experience AKI (22 events per 1000 patient-days) and approximately one-third of those patients will experience more than one AKI event. The incidence of AKI identified in this study (5.6%) is lower than has been previously reported in other publications, which have identified a range of incidences (approximately 4–40%), but similar to a recent publication that evaluated the change in two SCr values over 7 days (5.3%) [1, 3, 4, 10, 11]. When segmented by location of admission, the incidence of AKI in the intensive care unit population in this study was similar but lower than what was reported in the prospective AWARE trial, while acute care AKI was similar to an investigation in non-intensive care unit patients [12, 13]. This is not surprising as almost 20% of the KDIGO Stage 3 AKI events in the AWARE study were diagnosed based on oliguria. While some of the variance in the incidence can be attributed to populations included in the analyses, it is apparent that methodologic variation for assessment and staging of AKI has a significant contribution to the changing incidence. The use of a baseline estimated creatinine clearance can also have influence on the ascertainment of AKI in the hospitalized pediatric population. Zappitelli et al. noted that that prevalence of mild AKI was increased with using a baseline estimated creatinine clearance of 120 mL/min/1.73 m2 in comparison with normal maximum SCr values for patients without a baseline SCr [5]. This investigation used a normal maximum SCr value for those patients with only one SCr, which may have underestimated the presence of mild (KDIGO Stage 1) AKI.
Our results suggest that the maximum KDIGO stage, the number of AKI events and the AKI duration (the time spent in a KDIGO stage) are important variables to consider when evaluating patient outcomes from AKI. The strongest association with mortality was the maximum KDIGO stage attained during admission and this should continue to be used for assessment of patient outcomes [1]. However, we have also demonstrated that the other AKI characterizations developed, with the exception of AKI percent velocity, should be used in conjunction with maximum KDIGO stage. Based on these data, the use of maximum KDIGO stage as the sole characterization of AKI in reference to patient outcomes may be inadequate.
The limitations associated with this study are those common to retrospective analyses with large clinical databases. Due to the limitations of the dataset, we were unable to assess the impact of patient diagnoses and cocomorbidities and the results we have presented should be evaluated in the context of local patient populations and case mix. Our institution is a large quaternary care organization with significant critical care, cardiac surgical, oncology and transplant populations, all of which have been noted to have increased risk of AKI, and these populations would have increased risk of mortality in comparison with nonsubspecialty patient groups [9, 14, 15]. Evaluation of the etiology of AKI was beyond the scope of this study and we have not attempted to characterize this in the current investigation. The impact of pathophysiology and utilization of potentially nephrotoxic medications have been well documented as etiologies for AKI, as have interventions to potentially reduce AKI [16–19]. The novel metrics that we have developed are in need of prospective evaluation. In particular, the evaluation AKI velocity may suffer from the fact that this is a retrospective analysis and consistent SCr monitoring was not always employed. Future investigations of velocity of change in SCr values and the impact on patient outcomes are worthwhile.
Assessment of fluid status and urine output are two areas that were not evaluated in assessing the impact and incidence of AKI. Fluid overload has been reported as a significant predictor of mortality and adverse patient events in critically ill pediatric patients [20, 21]. The incidence and impact of AKI, when assessed using only SCr, could be diminished due to excessive total body fluid status, dilution of SCr concentrations and increased mortality. The assessment of urine output has been identified as an important variable when staging AKI severity, but due to limitations on the data available, we were unable to quantify this variable [22]. The inclusion of urine output into the assessment of AKI in this population would likely increase the reported incidence, as nearly 20% of patients of patients with diminished urine output have been noted to not have a change in SCr [12, 22].
Future directions include the use of the AKI characterizations developed in this analysis when evaluating impact of initiatives to decrease AKI. Interventions to reduce AKI-associated mortality can be tailored to impact not only the reduction in maximum KDIGO score, but also the reduction in multiple AKI events and shortening the recovery time after an AKI event. The impact of AKI and the novel metrics developed in this study on long-term outcomes should also be investigated.
CONCLUSIONS
The incidence of AKI in the hospitalized pediatric population was 5.6%, with 1.9% of patients experiencing multiple AKI events. Maximum KDIGO stage attained during admission was most strongly associated with mortality. Multiple AKI events and duration of AKI were both associated with mortality and should be evaluated when assessing patient outcomes.
REFERENCES
Author notes
None declared.


Comments