


ABSTRACT
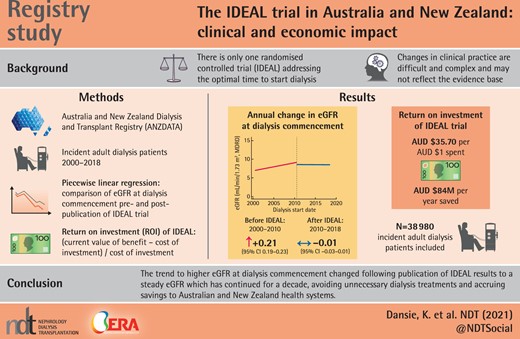
The impact of research findings on clinical practice usually remains uncertain and unmeasured. To address this problem, we examined the long-term clinical and economic impact of the Initiating Dialysis Early and Late (IDEAL) trial using data from the Australia and New Zealand Dialysis and Transplant Registry.
We performed a registry-based study including all incident adult dialysis patients in Australia and New Zealand from July 2000 to June 2018. A piecewise linear regression model was used to examine differences in mean estimated glomerular filtration rate (eGFR) at dialysis commencement for the years prior to (2000–2010) and following (2010–2018) publication of the IDEAL trial results. The return on investment (ROI) was calculated using the total cost of performing the IDEAL trial and the cost or savings accruing in Australia and New Zealand from changes in dialysis initiation practice.
From July 2000 to June 2010, mean eGFR at dialysis commencement increased at a rate of 0.21 mL/min/1.73 m2/year [95% confidence interval (CI) 0.19–0.23]. After the IDEAL trial results were published, mean eGFR at dialysis commencement did not show any temporal change [−0.01 mL/min/1.73 m2/year (95% CI −0.03–0.01)]. The ROI of the IDEAL trial was AU$35.70/AU$1 spent, an estimated savings to the Australian and New Zealand health systems of up to AU$84 million/year.
The previous trend to higher eGFR at dialysis commencement changed following publication of the IDEAL trial results to a steady eGFR that has continued for a decade, avoiding unnecessary dialysis treatments and accruing savings to the Australian and New Zealand health systems.
Key Learning Points
What is already known about this subject?
Despite the critical nature of the decision, there is only a single randomized controlled trial addressing the optimal time to start dialysis treatment.
Changes in clinical practice are difficult and complex and may not reflect the evidence base.
What this study adds?
There was an immediate change in practice in Australia and New Zealand around dialysis initiation following the trial publication, with no trend towards a change in the starting estimated glomerular filtration rate since 2010.
The change in practice resulted in substantial benefit to patients (in avoiding unnecessary dialysis) and cost savings.
‘Pragmatic’ trials that address important clinical issues with interventions that can be readily implemented can rapidly and effectively influence sustained change.
What impact this may have on practice or policy?
Policy frameworks that support clinically relevant trials embedded in routine care delivery are likely to be very cost-effective.
INTRODUCTION
Prior to 2000, there was uncertainty regarding the optimal timing for dialysis commencement. Traditionally dialysis was commenced upon emergence of signs and symptoms of uraemia in conjunction with biochemical indicators [1]. A number of observational cohort and case–control studies suggest that commencing dialysis ‘early’, with an estimated glomerular filtration rate (eGFR) of 10–14 mL/min/1.73 m2 may lead to improvements in patient quality of life and survival [2–4]. However, other observational data suggested that early commencement of dialysis may be harmful [5–9]. Australian and New Zealand clinical guidelines reflected this uncertainty with ‘no recommendations were possible’ regarding when to commence dialysis [10]. Against this landscape, the Initiating Dialysis Early and Late (IDEAL) trial was conducted. The primary aim of the IDEAL trial was to determine whether initiation of dialysis at an eGFR of 10–14 mL/min/1.73 m2 reduced all-cause mortality compared with 5–7 mL/min/1.73 m2. The study was conducted from 2000 to 2008 across 32 Australian and New Zealand sites (828 patients, 3.87% of incident dialysis patients). It found that planned early initiation of dialysis for patients with chronic kidney disease was not associated with improved clinical outcomes or survival [11]. However, early initiation added a median dialysis duration of 6 months for each patient at a cost of AU$18 715/patient [12].
The outcomes of this study were published in June 2010 [11]. Using the Australia and New Zealand Dialysis and Transplant (ANZDATA) Registry, we sought to examine temporal changes in eGFR at dialysis initiation and whether there were effects that might be attributable to the publication of the IDEAL trial. We also sought to determine the economic impact of the IDEAL trial by calculating the return on investment (ROI) ∼10 years after publication of the results.
MATERIALS AND METHODS
Ethics approval was obtained from the Royal Adelaide Hospital Human Research Ethics Committee. Data for the analysis were provided by ANZDATA and included incident adult (≥18 years) dialysis patients in Australia and New Zealand from July 2000 to June 2018. Late referrals (referral to a nephrologist ˂3 months before commencement of dialysis; n = 11 306), pre-emptive transplants (n = 1718) and patients with missing (n = 545) or implausible (n = 220; eGFR >30 mL/min/1.73 m2) eGFR values were excluded, leaving 38 980 patients included in the analysis (n = 13 167 excluded in total, as excluded groups have overlap). A piecewise linear regression model was used to examine the difference in mean eGFR [calculated using the Modification of Diet in Renal Disease (MDRD) formula for unstandardized creatinine assays] at commencement of dialysis for the years prior (2000–2010) and following (2010–2018) publication of the IDEAL trial results in June 2010. The piecewise linear regression model fits a linear regression model to the data over two different periods: July 2000–June 2010 and July 2010–June 2018. These correspond to the periods prior to and after IDEAL trial publication. The difference between slopes of the regression lines in the two periods and the intercept change from the model was assessed. P-values ˂0.05 were considered significant.
The MDRD formula for calculating eGFR was chosen, as the original trial published results calculated using both the Cockcroft–Gault equation corrected for body surface area and the MDRD formula, and the MDRD formula has been found to have superior precision and accuracy [13]. In the IDEAL trial the mean eGFR at commencement of dialysis calculated using the MDRD formula was 9.0 mL/min/1.73 m2 (for the early-start group) and 7.2 mL/min/1.73 m2 (for the late-start group), with a mean difference between the groups of 1.8 mL/min/1.73 m2 [11].
For this study, eGFR at dialysis start is defined as the eGFR upon commencement of the first renal replacement therapy (RRT) modality for a patient with end-stage kidney disease and is calculated using serum creatinine, age and sex reported at that time from the ANZDATA Registry. The mean patient eGFR at dialysis start was examined in unadjusted and multivariate mixed-effects models. Covariates included in the multivariate mixed-effects model were age at dialysis start, ethnicity, initial dialysis modality (peritoneal dialysis/haemodialysis), body mass index (BMI) and presence of type 2 diabetes mellitus. The treating hospital was included as a random effect. An interaction between type 2 diabetes and time (pre- and post-trial publication) was included due to perceptions that practice may differ in this group.
In order to evaluate the gain or loss on investment from the IDEAL trial based on its impact on dialysis initiation practice, the ROI was calculated using the formula:
ROI = (Current Value of Benefit − Cost of Investment)/Cost of Investment to obtain a ratio of returns for each dollar invested [14]. The cost-effectiveness analysis of the original study showed an additional mean cost per patient of AU$18 715 in the early-start group compared with the late-start group, with a difference in eGFR (MDRD) of 1.8 mL/min/1.73 m2 at dialysis start between the two groups [12]. We used the cost per increment of eGFR calculated from the original study (AU$10 397/mL/min/1.73 m2) and the change in trajectory of the mean eGFR at dialysis initiation between July 2000 and June 2010 (pre-publication) and July 2010 and June 2018 (post-publication) to calculate the current value of benefit of the attenuation of the pre-publication trend. All costs and benefits were inflated to 2017–2018 financial year Australian dollars using the consumer price index for costs and the total health price index for benefits [15, 16]. This was performed because the education grants that supported the trial (i.e. costs) depreciate at the consumer price index rate, whereas the dialysis-associated healthcare costs avoided (benefits) depreciate at the total health price index rate.
RESULTS
Table 1 shows the patient characteristics from July 2000 to June 2010 (pre-publication) and July 2010 to June 2018 (post-publication). Differences between groups were seen in most factors. The observed mean eGFR at dialysis commencement for each financial year from July 2000 to June 2018 is shown in Table 2.
Demographics of incident dialysis patients in Australia and New Zealand
| Characteristics | Dialysis start | Dialysis start | Total, |
|---|---|---|---|
| (July 2000–June 2010), | (July 2010–June 2018), | n (%) | |
| n (%) | n (%) | ||
| n | 19 239 | 19 741 | 38 980 |
| Age (years) | |||
| 18–44 | 2892 (15) | 2809 (14) | 5701 (15) |
| 45–64 | 7679 (40) | 8079 (41) | 15 758 (40) |
| 65–74 | 5003 (26) | 5201 (26) | 10 204 (26) |
| ≥75 | 3665 (19) | 3652 (18) | 7317 (19) |
| Type 2 diabetes | 7883 (41) | 9724 (49) | 17 607 (45) |
| PD as initial dialysis modality | 5751 (30) | 6222 (32) | 11 973 (31) |
| Gender | |||
| Female | 7688 (40) | 7509 (38) | 15 197 (39) |
| Initial country | |||
| Australia | 15 723 (82) | 16 225 (82) | 31 948 (82) |
| New Zealand | 3516 (18) | 3516 (18) | 7032 (18) |
| Ethnicity | |||
| Caucasian | 14 318 (74) | 12 393 (63) | 26 711 (69) |
| Aboriginal/Torres Strait Islander | 1356 (7) | 1788 (9) | 3144 (8) |
| Asian | 1449 (8) | 1995 (10) | 3444 (9) |
| Māori | 1156 (6) | 1269 (6) | 2426 (6) |
| Pacific | 807 (4) | 1214 (6) | 2021 (5) |
| Other | 153 (1) | 782 (4) | 935 (2) |
| Not reported | 0 (0) | 300 (2) | 300 (1) |
| Primary kidney disease | |||
| Diabetic nephropathy | 6673 (35) | 8488 (43) | 15 161 (39) |
| Glomerulonephritis | 4604 (24) | 3730 (19) | 8334 (21) |
| Hypertension | 2834 (15) | 2661 (13) | 5495 (14) |
| Polycystic disease | 1353 (7) | 1230 (6) | 2583 (7) |
| Reflux nephropathy | 593 (3) | 397 (2) | 990 (3) |
| Other | 2144 (11) | 2228 (11) | 4372 (11) |
| Uncertain | 1038 (5) | 837 (4) | 1875 (5) |
| Not reported | 0 (0) | 170 (1) | 170 (0.4) |
| BMI (kg/m2) | |||
| <18.5 (underweight) | 587 (3) | 423 (2) | 1010 (3) |
| 18.5–24.9 (normal) | 6299 (33) | 5184 (27) | 11 483 (29) |
| 25–29.9 (overweight) | 6405 (33) | 6041 (31) | 12 446 (32) |
| ≥30 (obese) | 5894 (31) | 7773 (40) | 13 667 (35) |
Observed and fitted mean eGFR (MDRD) at commencement of dialysis for Australian and New Zealand patients by financial year before and after July 2010
| Financial year | Patients, n | Observed mean starting eGFR (mL/min/1.73 m2) | Fitted mean starting eGFR as of the first day of each financial year (mL/min/1.73 m2) |
|---|---|---|---|
| 2000–2001 | 1709 | 7.00 | 7.00 |
| 2001–2002 | 1666 | 7.40 | 7.20 |
| 2002–2003 | 1591 | 7.77 | 7.41 |
| 2003–2004 | 1708 | 7.66 | 7.62 |
| 2004–2005 | 1819 | 7.81 | 7.83 |
| 2005–2006 | 2126 | 7.99 | 8.03 |
| 2006–2007 | 2075 | 8.41 | 8.24 |
| 2007–2008 | 2134 | 8.57 | 8.45 |
| 2008–2009 | 2233 | 8.80 | 8.65 |
| 2009–2010 | 2178 | 8.94 | 8.86 |
| 2010–2011 | 2103 | 8.58 | 8.51 |
| 2011–2012 | 2260 | 8.52 | 8.50 |
| 2012–2013 | 2391 | 8.36 | 8.49 |
| 2013–2014 | 2436 | 8.49 | 8.48 |
| 2014–2015 | 2536 | 8.51 | 8.47 |
| 2015–2016 | 2508 | 8.43 | 8.46 |
| 2016–2017 | 2650 | 8.40 | 8.44 |
| 2017–2018 | 2857 | 8.46 | 8.43 |
Between 2000 and 2010, in an unadjusted model, fitted mean eGFR at commencement of dialysis progressively increased from 7.00 mL/min/1.73 m2 [95% confidence interval (CI) 6.89–7.11] on 1 July 2000 to 9.07 mL/min/1.73 m2 (95% CI 8.97–9.17) on 30 June 2010, equating to an increase of 0.21 mL/min/1.73 m2/year (95% CI 0.19–0.23) (Figure 1 and Table 3). In contrast, after the IDEAL trial results were published, the fitted mean eGFR at commencement of dialysis dropped by 0.56 mL/min/1.73 m2 (95% CI −0.70 to −0.41; P < 0.001) and did not show any temporal change [−0.01 mL/min/1.73 m2/year (95% CI −0.03–0.01)] (Figure 1 and Table 3). The upward trajectory of fitted mean eGFR at dialysis commencement decreased by 0.22 mL/min/1.73 m2/year (95% CI 0.19–0.25; P < 0.001). Results of the multivariate model are shown in Table 3 and confirmed the change in slope. From 2000 to 2008, patients with type 2 diabetes mellitus had significantly higher eGFRs at dialysis commencement compared with those who did not have type 2 diabetes [mean difference 0.94 mL/min/1.73 m2 (95% CI 0.84–1.05), P < 0.001]. From 2010 to 2018, there was a significant interaction with time for type 2 diabetic patients, with their mean eGFR at dialysis entry significantly decreasing [−0.42 mL/min/1.73 m2 (95% CI −0.56 to −0.29), P < 0.001] to a level similar to patients without type 2 diabetes.
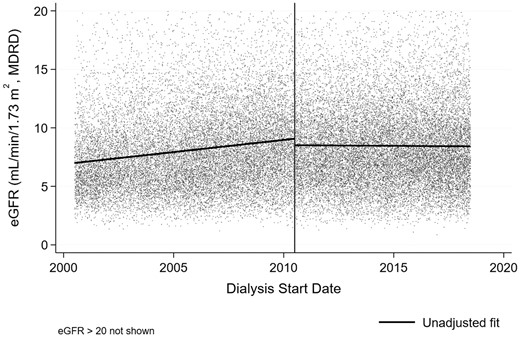
Unadjusted piecewise linear regression fit (before and after 1 July 2010, indicated by vertical line) of eGFR at dialysis start vs start date.
Results of unadjusted and adjusted (multivariate) piecewise, mixed-effects linear regression models for eGFR at dialysis commencement
| Variables | Unadjusted model | Adjusted model | ||||||
|---|---|---|---|---|---|---|---|---|
| Coefficienta | 95% CI | P-value | Coefficienta | 95% CI | P-value | |||
| Intercept (at July 2000) | 7.00 | 6.89–7.11 | <0.001 | 7.22 | 6.90–7.54 | <0.001 | ||
| July 2000–June 2010 | 0.21 | 0.19–0.23 | <0.001 | 0.19 | 0.17–0.21 | <0.001 | ||
| July 2010–June 2018 | −0.01 | −0.03–0.01 | 0.3 | 0.01 | −0.02–0.03 | 0.6 | ||
| Intercept change (at July 2010) | −0.56 | −0.70 to −0.41 | <0.001 | −0.30 | −0.45 to −0.15 | <0.001 | ||
| Age (years) | ||||||||
| 18–44 | – | – | – | ref. | ||||
| 45–64 | – | – | – | 0.07 | −0.04–0.17 | 0.2 | ||
| 65–74 | – | – | – | 0.46 | 0.35–0.57 | <0.001 | ||
| ≥75 | – | – | – | 0.90 | 0.77–1.02 | <0.001 | ||
| Ethnicity | – | – | – | |||||
| Aboriginal/Torres Strait Islander | – | – | – | −1.33 | −1.50 to −1.17 | <0.001 | ||
| Asian | – | – | – | −0.83 | −0.96 to −0.70 | <0.001 | ||
| Māori | – | – | – | −1.14 | −1.32 to −0.96 | <0.001 | ||
| Pacific | – | – | – | −2.80 | −2.26 to −1.90 | <0.001 | ||
| Other | – | – | – | −0.63 | −0.85 to −0.40 | <0.001 | ||
| Not reported | – | – | – | 1.23 | −0.20–0.61 | 0.3 | ||
| BMI | – | – | – | |||||
| <18.5 (underweight) | – | – | – | 0.82 | 0.60–1.03 | <0.001 | ||
| 18.5–24.9 (normal) | – | – | – | ref | ||||
| 25–29.9 (overweight) | – | – | – | −0.22 | −0.31 to −0.14 | <0.001 | ||
| ≥30 (obese) | – | – | – | −0.29 | −0.38 to −0.20 | <0.001 | ||
| Peritoneal dialysis as initial dialysis modality | – | – | – | 0.96 | 0.88–1.03 | <0.001 | ||
| Type 2 diabetes | – | – | – | 0.94 | 0.84–1.05 | <0.001 | ||
| Additional intercept change (at July 2010) if type 2 diabetes | – | – | – | −0.42 | −0.56 to −0.29 | <0.001 | ||
Describes the coefficients from the regression models. Larger values indicate stronger relationships between the variable and mean eGFR at dialysis start and sign (+ or −) represents whether it is a positive or negative relationship. Covariates included in the adjusted model were age at dialysis start, ethnicity, initial dialysis modality (peritoneal dialysis/haemodialysis), BMI and presence of type 2 diabetes mellitus.
The current value of benefit was AU$396 643 566 over 2010–2018 based on direct savings from dialysis-associated healthcare avoided (AU$10 397.22/mL/min/1.73 m2) given the immediate intercept change of 0.56 mL/min/1.73 m2 and a mean decrease in slope of 0.22 mL/min/1.73 m2/year following publication of the IDEAL trial results (unadjusted model; Table 4). The cost of investment was the sum of the grants to conduct the trial, which totalled AU$10 808 113. The ROI of the IDEAL trial was AU$35.70 for every AU$1 spent, an estimated savings to the Australian and New Zealand health systems of up to AU$84 million/year.
ROI calculation
| Financial year | Predicted difference in slopes from trend prior to IDEAL trial publication | Average increase in dialysis cost per patient (AU$) | Patients initiating dialysis per year, n | Total extra dialysis payments (savings by reversing this trend), AU$ |
|---|---|---|---|---|
| 2010–2011 | 0.774 | 8049 | 2103 | 16 927 763 |
| 2011–2012 | 0.993 | 10 325 | 2260 | 23 333 830 |
| 2012–2013 | 1.212 | 12 600 | 2391 | 30 126 759 |
| 2013–2014 | 1.431 | 14 875 | 2436 | 36 236 546 |
| 2014–2015 | 1.650 | 17 151 | 2536 | 43 494 410 |
| 2015–2016 | 1.868 | 19 426 | 2508 | 48 720 798 |
| 2016–2017 | 2.087 | 21 702 | 2650 | 57 509 024 |
| 2017–2018 | 2.306 | 23 977 | 2857 | 68 501 950 |
| Total in 2008 AU$ | 324 851 080 | |||
| Total in 2017–2018 AU$ | 396 643 566 | |||
| Sum of grants to conduct the IDEAL trial (in 2017–2018 AU$) | 10 808 113 | |||
| ROI per dollar spent | (396 643 566−10 808 113)/10 808 113 | |||
| = (Current Value of Benefit − Cost of Investment)/Cost of Investment | AU$35.70 | |||
Grants for the IDEAL trial include National Health and Medical Research Council of Australia (APP211146), National Health and Medical Research Council of Australia (APP465095), Australian Health Ministers Advisory Council (PDR 2001/10), Royal Australasian College of Physicians/Australian and New Zealand Society of Nephrology (Don and Lorraine Jacquot Fellowship), National Heart Foundation (Australia), National Heart Foundation (New Zealand) and unrestricted grants from Baxter Healthcare, Health Funding Authority of New Zealand (Te Mana Putea Hauora O Aotearoa), International Society for Peritoneal Dialysis, Amgen Australia and Janssen-Cilag.
DISCUSSION
The optimal point at which to start long-term dialysis treatment has been long debated. Prior to the IDEAL trial there was a steady trend towards an ‘earlier’ start. In this study we demonstrated a clear and substantial change in practice in Australia and New Zealand occurring around the time of publication of the IDEAL trial results, with a change in the previous upward trend to a steady ‘plateau’ that has persisted. As a result of this practice change, substantial and ongoing health systems savings are likely. Although the achieved difference in eGFR between the early- and late-start groups was modest [11], the published findings of the IDEAL trial were closely temporally associated with a substantial change in practice around the timing of dialysis initiation in Australia and New Zealand. As the only published randomized controlled trial (RCT) in this area, the IDEAL trial provided a higher level of evidence than the numerous previously published observational cohort studies [2–9, 17]. The estimated savings to the Australian and New Zealand health systems resulting from conducting the IDEAL trial, versus the counterfactual of not conducting the trial, was up to AU$84 million/year with a calculated ROI of AU$35.70 for every AU$1 invested in the IDEAL trial.
We acknowledge that by calculating the ROI we are drawing causal inferences from a before-and-after study. However, beyond the IDEAL trial publication date, there were no other relevant events coinciding with the change of which we are aware. There have been no other trials addressing this issue. Previous Australian and New Zealand clinical practice guidelines did not have a recommendation about eGFR at dialysis start, and there was no guideline published in direct response to the IDEAL trial publication. The international Kidney Disease: Improving Global Outcomes guidelines [18, 19] published in 2012 made a recommendation (5.3.1) to commence dialysis based on symptoms rather than a particular level of eGFR. This was graded as ‘2B’, reflecting the single RCT. We also acknowledge that the increasing trend in eGFR observed from July 2000 to June 2010 would not have continued indefinitely; however, we have modelled a linear trend over the time periods prior to and after June 2010; the ‘step’ in calculated eGFR in June 2010 is another artefact of the modelling process. The model was fitted to the end of June 2018, at which point, if the original trend had continued, the fitted mean eGFR at dialysis start would have been 10.73 mL/min/1.73 m2, which is still well within a plausible range. There is also the possibility that a plateau could have occurred at some point following June 2010, regardless of the IDEAL trial publication, and hence the difference between the predicted trend and the observed plateau calculated in this study could have been smaller.
From a cost perspective, our finding is important and robust. Cost analyses were incorporated in the trial protocol [12], but ongoing healthcare costs for the IDEAL cohort are not available. Given this limitation, we extrapolated ongoing savings from the within-trial analysis. Given the large benefit we calculated, even if the clinical difference, and therefore economic benefit, were smaller than we predicted, it is still likely to be an important amount.
There are likely to be a number of reasons for the swift uptake and implementation of this practice change. First, the close-knit Australian and New Zealand nephrology community facilitated rapid dissemination of knowledge. Second, many units had been involved in recruiting patients to the study and were therefore engaged with the findings. Finally, the change in practice (towards starting dialysis based on symptoms rather than an earlier biochemistry-driven point) was one that could be implemented easily. Indeed, it offered benefits to patients and providers by avoiding unnecessary dialysis and reducing healthcare costs. This last factor is likely to be the major one, given that similar changes have been observed in the USA, with the percentage of patients commencing kidney replacement therapy at higher eGFR levels increasing steadily from 1996 to 2010 and remaining stable or slightly decreasing from 2010 onwards [20]. Similarly, in Canada, a statistically significant increasing trend was observed in the monthly proportions of early dialysis starts prior to the IDEAL trial, with an immediate decrease following the trial and a significant change in trend between the pre-trial and post-trial periods [21].
This analysis highlights the role of a clinical quality registry (ANZDATA) in ‘closing the loop’ with respect to monitoring practice patterns for all incident dialysis patients in all renal units in Australia and New Zealand following changes in the evidence base. The registry enabled efficient evaluation of the timing and extent of implementation of the IDEAL trial findings.
In summary, there was a rapid and comprehensive change in dialysis initiation practice in Australia and New Zealand following the release of the IDEAL trial results in 2010. It is estimated that this practice change generated a large savings to the Australian and New Zealand health systems, delivering an extremely high ROI for the IDEAL trial. This illustrates the potential of an RCT to rapidly influence practice and the role of a registry in efficiently identifying and following practice changes.
FUNDING
This analysis was supported by the Better Evidence and Translation–Chronic Kidney Disease (BEAT CKD) National Health and Medical Research Council (NHMRC) Programme Grant (APP1092957).
CONFLICT OF INTEREST STATEMENT
C.H. has received consulting fees from Janssen and GlaxoSmithKline (paid to the institution only), travel support from Otsuka and grant funding from the NHMRC and Medical Research Future Fund. D.J. has received research grants, speaker’s honoraria, consultancy fees, travel sponsorships and a practitioner fellowship from the following institutions: Baxter Healthcare, Fresenius Medical Care, Amgen, AstraZeneca, AWAK and the NHMRC of Australia. C.P. has received travel support from Amgen. S.M. has received grant funding from Baxter Healthcare, Kidney Health Australia, the New Zealand Ministry of Health and the Australian Organ and Tissue Donation and Transplantation Authority and travel funding from Nippro. K.D., C.D., R.M., J.Cr., J.Ch., B.C. and D.H. declare that they have no relevant financial interests. The results herein have not been published previously other than in abstract form.
Data availability statement
The data underlying this article cannot be shared publicly due to privacy policies to protect patient confidentiality. Deidentified data extracts may be shared on reasonable request to the ANZDATA registry, in line with the ANZDATA data request procedures. ANZDATA data policies including the Ethics and Privacy Policy and Data Request Procedure can be found at https://www.anzdata.org.au/anzdata/services/data-policies/.


Comments